Published by Electrotek Concepts, Inc., PQSoft Case Study: Harmonic Resonance Evaluation for Feeder and Substation Capacitor Banks, Document ID: PQS0706, Date: July 27, 2007.
Abstract: A utility operates feeder and substation capacitor banks on a 25.56kV distribution feeder. The utility uses frequency scan simulations to determine the effect of distribution feeder and substation capacitor banks on harmonic resonance and frequency response characteristics. It is assumed that the simulations will show that the frequency response characteristics of the feeder are very dependent on the status of the feeder and substation capacitor banks.
This case study evaluates the effect of substation and feeder capacitor banks on the frequency response characteristic of a 25.56kV distribution feeder.
INTRODUCTION AND MODEL DEVELOPMENT
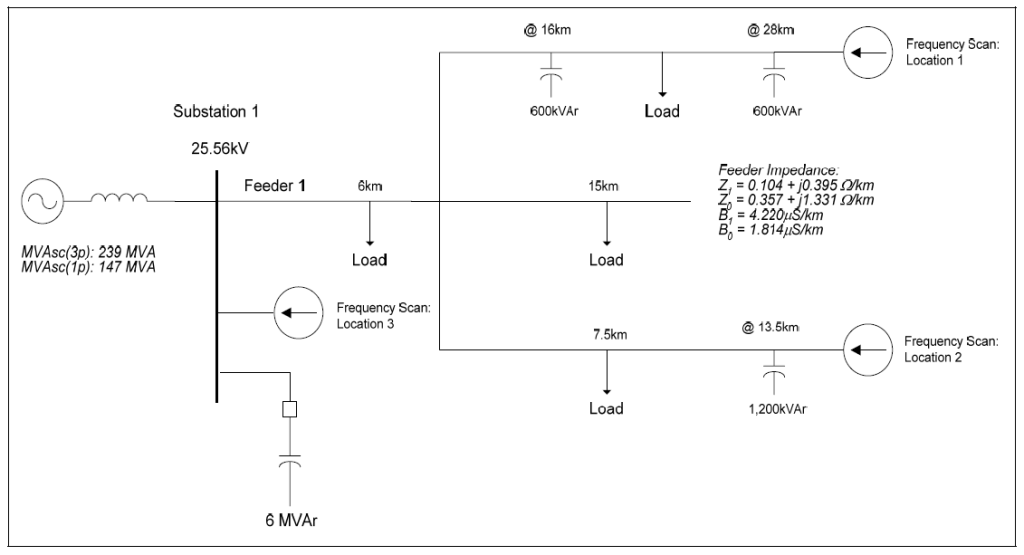
The effect of distribution feeder and substation capacitor banks on harmonic resonance and frequency response characteristics was studied for the system shown in Figure 1. The accuracy of the system model was verified using three-phase and single-line-to-ground fault currents and other steady-state quantities, such as capacitor bank rated current and voltage rise.
SIMULATION RESULTS
Frequency scan analysis was used to determine the impedance vs. frequency characteristic for the circuit for various operating conditions. The frequency range for these cases was 60 Hz to 5,000 Hz (1 Hz increment). The load on the feeder for the full load condition was approximately 10.4 MVA at 98% power factor. The following frequency scan cases were completed:
| Case Number | Scan Location | Load Condition | Substation Capacitor Bank | Feeder Capacitor Bank |
|---|---|---|---|---|
| Case 1a | 1 | Full Load | Off | All Off |
| Case 1b | 1 | Full Load | Off | All On |
| Case 1c | 1 | Full Load | On | All Off |
| Case 1d | 1 | Full Load | On | All On |
| Case 2a | 2 | Full Load | Off | All Off |
| Case 2b | 2 | Full Load | Off | All On |
| Case 2c | 2 | Full Load | On | All Off |
| Case 2d | 2 | Full Load | On | All On |
| Case 3a | 3 | Full Load | Off | All Off |
| Case 3b | 3 | Full Load | Off | All On |
| Case 3c | 3 | Full Load | On | All Off |
| Case 3d | 3 | Full Load | On | All On |
Figure 2 shows the impedance vs. frequency simulation results for scan location number 1 for the four operating conditions.
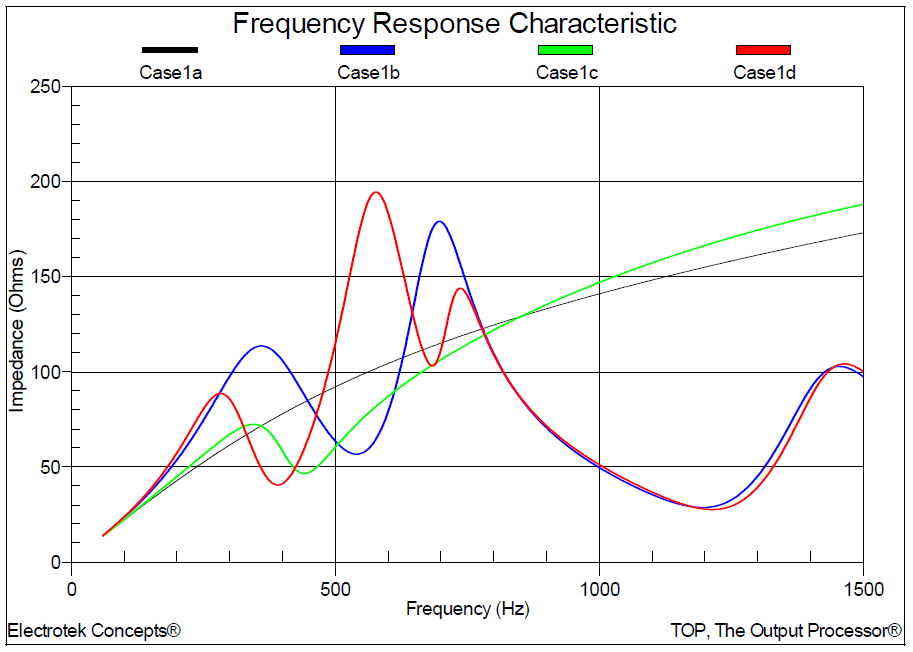
Figure 3 shows the impedance vs. frequency simulation results for scan location number 2 for the four operating conditions.
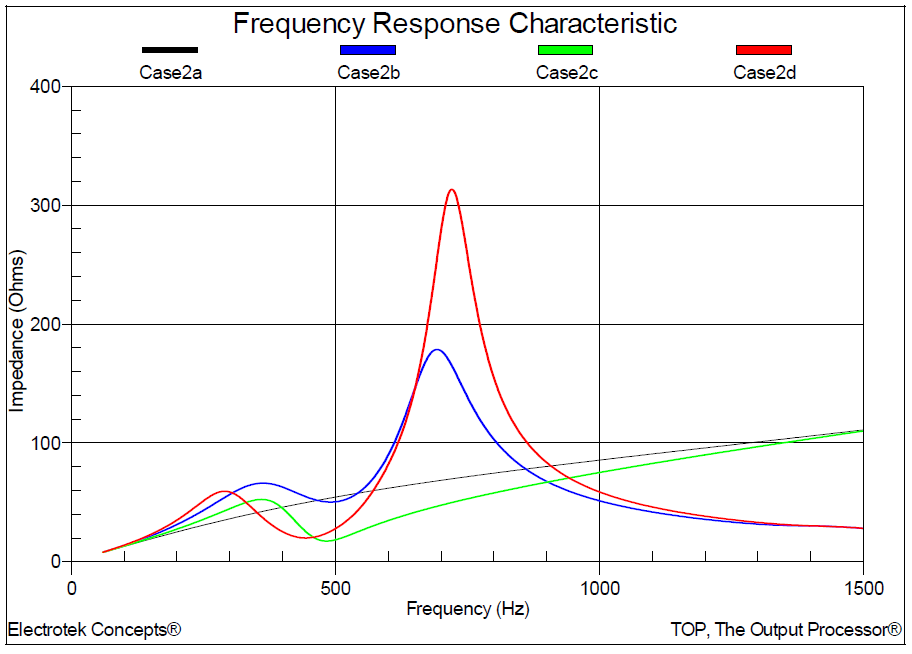
Figure 4 shows the impedance vs. frequency simulation results for scan location number 3 for the four operating conditions.

SUMMARY
The simulations show that the frequency response characteristics of the feeder are very dependent on the status of the feeder and substation capacitor banks. Additional observations include:
1. For scan locations number 1 and number 2 (end of feeder segments), the simulated frequency response is generally more severe for the condition of having the smaller distributed feeder capacitor banks in service as compared to having the larger substation capacitor bank in service.
2. For scan location number 3 (substation bus), the simulated frequency response is generally more severe for the condition of having the larger substation capacitor bank in service as compared to having the smaller distributed feeder capacitor banks in service.
3. It is often difficult to generalize the affect on voltage distortion levels when the location and characteristics of the harmonic producing loads are not known. The resulting voltage distortion for the different operating conditions will depend on the locations, ratings, and characteristics of the various nonlinear loads on the circuit. For example, if the nonlinear loads are near the ends of two feeder segments (scan locations 1 and 2), it is likely that the feeder voltage distortion will be somewhat higher for the condition of having the feeder capacitors in services. However, if the nonlinear loads are near the substation (scan location 3), it is likely that the feeder voltage distortion will be somewhat higher for the condition of having the larger substation capacitor bank in service. Actual current and voltage distortion levels may be determined by field measurement and/or more detailed computer simulations that include the harmonic current source characteristics.
REFERENCES
Power System Harmonics, IEEE Tutorial Course, 84 EH0221-2-PWR, 1984.
RELATED STANDARDS
IEEE Std. 519-1992 IEEE Std. 1036-1992
GLOSSARY AND ACRONYMS
ASD: Adjustable-Speed Drive
CF: Crest Factor
DPF: Displacement Power Factor
PF: Power Factor
PWM: Pulse Width Modulation
THDG: Total Harmonic Distortion
TPF: True Power Factor
