Published by Electrotek Concepts, Inc., PQSoft Case Study: Distribution System Harmonic Evaluation, Document ID: PQS1013, Date: October 15, 2010.
Abstract: This case study presents a utility distribution system harmonic analysis evaluation. The simulations were completed using the SuperHarm program. The analysis included frequency response and harmonic distortion simulations for a 13.2 kV substation and several industrial customers with power factor correction capacitor banks. The mitigation alterative included a shunt passive harmonic filter which reduced voltage distortion levels below the specified limitations.
INTRODUCTION
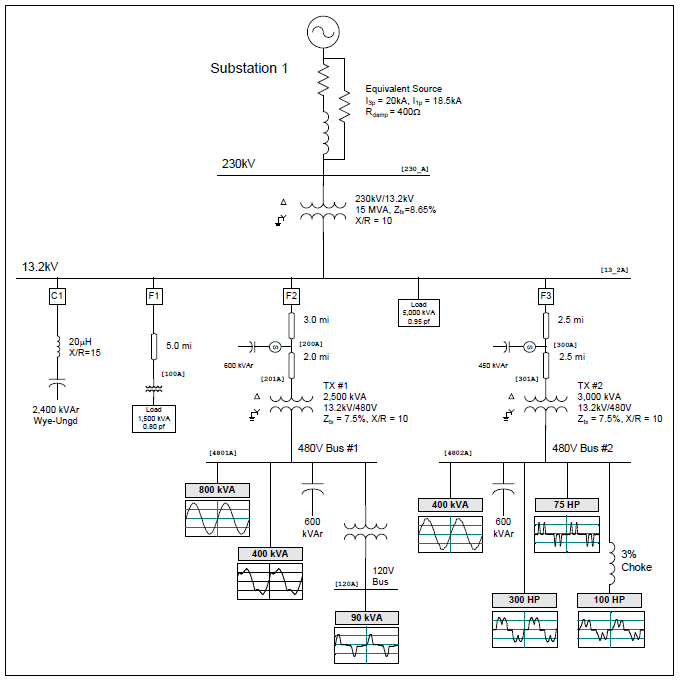
A distribution system harmonic analysis case study was completed for the system shown in Figure 1. The 13.2 kV utility substation included a 15 MVA, 230 kV/13.2 kV step-down transformer and a number of distribution feeders that supplied several industrial customers. There was a 2,400 kVAr, 13.2 kV capacitor bank at the substation bus and 600 kVAr and 450 kVAr capacitor banks on the two distribution feeders. The customer loads included 600 kVAr, 480 V power factor correction capacitor banks and a variety of nonlinear devices. The case study was completed using the SuperHarm® program. The accuracy of the simulation model was verified using three-phase and single-line-to-ground fault currents and other steady-state quantities.
SIMULATION RESULTS
Relevant utility system and customer data for the case included:
Substation capacitor bank rating: 2,400 kVAr
Short-circuit capacity at the 13.2 kV bus: 168 MVA (ISC = 7.326 kA)
Substation load: 5,000 kVA, 0.95 pf
Feeder load: 1,500 kVA, 0.80 pf
Feeder capacitor bank ratings: 450 kVAr, 600 kVAr
Customer capacitor bank rating: 600 kVAr
Miscellaneous linear load: 800 kVA
Fluorescent lighting (ITHD = 21.7%): 400 kVA
DC drive (ITHD = 35.3%): 300 hp
PWM ASD (no choke – ITHD = 130.8%): 75 hp
PWM ASD (with 3% choke – ITHD = 45.1%): 100 hp
Switch mode power supplies (ITHD = 77.2%): 90 kVA
Figure 2 shows a representative simulated nonlinear load model current waveform (single phase) for the 300 hp dc drive operating at 75% power factor. The current had a fundamental frequency value of 343 A, an rms value of 363 A, and a THD value of 35.3%. The simulated waveform shown in Figure 2 was created using an inverse DFT with 256 points per cycle. The nonlinear load characteristics were determined using field measurements at the customer facilities.
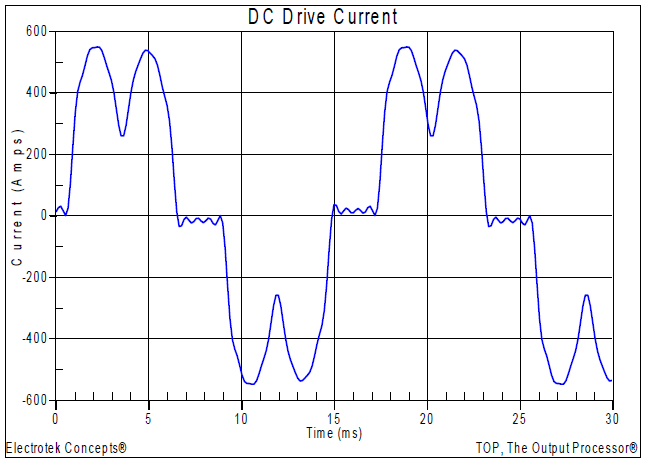
Figure 3 shows the impedance vs. frequency simulation result with the 2,400 kVAr, 13.2 kV substation capacitor bank in service (Case 7b). The base-case result with no utility or customer capacitor banks in service (Case 7a) is also shown on the graph so the two conditions can be easily compared. The simulated parallel resonance due to the addition of the shunt capacitor bank was 504 Hz (8.4th harmonic). A simple expression may be used to validate this result:
hr ≈ √ (MVA3Φ / MVAr3Φ) = √ (168 / 2.4) = 8.37 (502 Hz)
In addition, the simulated steady-state voltage rise with the 2,400 kVAr, 13.2 kV capacitor bank in service was 1.4%. This value may be validated using the following expression:
ΔV = (MVAr3Φ / MVAsc ) * 100 = (2.4 / 168) * 100 = 1.43%
where:
hr = parallel resonant frequency (x fundamental)
ΔV = steady-state voltage rise (per-unit)
MVA3Φ = three-phase short circuit capacity (MVA = √313.2 kV7.3kA≈168MVA)
MVAr3Φ = three-phase capacitor bank rating (MVAr)

Figure 4 shows the impedance vs. frequency characteristic simulation results for the following system conditions:
– Case 7a: No utility or customer capacitor banks in-service
– Case 7b: 2,400 kVAr, 13.2 kV substation bus capacitor bank in-service
– Case 7c: 2,400 kVAr, 13.2 kV substation bus, 600 kVAr feeder #2, and 450 kVAr feeder #3 capacitor banks in-service
– Case 7d: 2,400 kVAr, 13.2 kV substation bus, 600 kVAr feeder #2, 450 kVAr feeder 3, and both 600 kVAr, 480 V customer capacitor banks in-service
The results show that the frequency response characteristic was very dependent on the status of the utility and customer capacitor banks. The addition of the two 13.2 kV distribution feeder capacitor banks moved the parallel resonance from the 8.4th harmonic to the 6.7th harmonic (Case 7c), while the addition of the two customer low voltage capacitor banks moved the parallel resonance to the 4.6th harmonic (Case 7d). The condition also resulted in a second parallel resonance near the 9.2nd harmonic. The addition of the other capacitor banks also created new parallel resonances at harmonics between the 12th and 24th.
The simulation results illustrate the fact that the frequency response characteristic was far more complex with multiple capacitor banks in-service than the trivial base-case with just one capacitor bank in-service (Case 7b).

Table 1 summarizes the results for the four corresponding harmonic distortion simulations. The table includes the simulated voltage distortion (VTHD) levels at five buses for the four different operating conditions previously summarized in Figure 4. The voltage distortion at the customer #2 low voltage bus exceeded the commonly applied 5% limitation for the case with the 600 kVAr, 480 V power factor capacitor bank in-service (Case 7d). In addition, the voltage distortion at the 450 kVAr, 13.2 kV capacitor bank location on feeder #2 was very close to exceeding the 5% limitation.
Figure 5 shows the corresponding secondary bus voltage waveform that was created using an inverse DFT with 256 points per cycle.
Table 1 – Summary of the Simulated Voltage Distortion Results
| Case Number | 13.2 kV Bus | 13.2 kV Feeder #2 | 13.2 kV Feeder #3 | 480 V Bus #1 | 480 V Bus #2 |
|---|---|---|---|---|---|
| 7a | 0.45% | 0.53% | 2.09% | 1.28% | 4.44% |
| 7b | 0.73% | 0.85% | 2.01% | 1.48% | 4.31% |
| 7c | 1.17% | 2.67% | 2.99% | 2.83% | 4.87% |
| 7d | 1.21% | 1.62% | 4.87% | 2.92% | 9.43% |
For the customer with the 3,000 kVA, 7.5% impedance transformer and the 600 kVAr power factor correction capacitor bank, the parallel resonant frequency on the secondary bus may be approximated using the following expression:
hr ≈ √ Xc / Xsc = √ MVA3Φ / MVAr3Φ = √ (kVAtx * 100) / (kVAr3Φ * Ztx%)
hr ≈ √ (kVAtx * 100) / (kVAr3Φ * Ztx%) = √ (3000 * 100) / (600 * 7.2) = 8.17 (490Hz)
where:
hr = parallel resonant frequency (x fundamental)
XC = capacitor bank reactance (Ω)
XSC = system short circuit reactance (Ω)
MVA3Φ = three-phase short circuit capacity (MVA)
MVAr3Φ = three-phase capacitor bank rating (MVAr)
kVAtx = three-phase transformer rating (kVA)
kVAr3Φ = three-phase capacitor bank rating (kVAr)
Ztx% = transformer reactance (%)

Due the excessive voltage distortion levels at the low voltage bus, customer #2 decided to reconfigure their 600 kVAr capacitor bank as a 4.7th harmonic filter. Figure 6 shows the basic configuration of the harmonic filter, while Figure 7 summarizes the filter component and duty calculations.
When mitigation of harmonic distortion is required, one of the options is to apply a filter at the source of harmonics, or at a location where the harmonic currents can be effectively removed from the system. The most cost effective filter is generally a single-tuned passive filter and this will be true for the majority of cases. Filters should be carefully designed to avoid unexpected interactions with the system.
Passive filters are made of inductive, capacitive, and resistive elements. They are relatively inexpensive compared with other means for eliminating harmonic distortion, but they have the disadvantage of potentially adverse interactions with the power system. They are employed either to shunt the harmonic currents off the line or to block their flow between parts of the system by tuning the elements to create a resonance at a selected harmonic frequency.
Filters are generally tuned slightly below the harmonic frequency of concern. This method allows for tolerances in the filter components and prevents the filter from acting as a direct short circuit for the offending harmonic current. It also minimizes the possibility of dangerous harmonic resonance should the system parameters change and cause the tuning frequency to shift slightly higher.

Table 2 summarizes the results for the additional case evaluating the 600 kVAr, 4.7th harmonic filter bank at the customer #2 bus. The corresponding frequency response characteristic is shown in Figure 8. The voltage distortion level at the low voltage bus was reduced from 9.43% to 2.18% with the addition of the harmonic filter. In addition, the voltage distortion at the 450 kVAr, 13.2 kV capacitor bank location on feeder #2 was reduced from 4.87% to 1.29%. This result illustrates the advantage of the passive harmonic filter by diverting a majority of the harmonic current from flowing onto the utility system.
Figure 8 shows the impedance vs. frequency simulation results with the customer #2 600 kVAr power factor correction capacitor bank reconfigured as a 4.7th harmonic filter (Case 7e). Due to the excessive component duty requirements, the low voltage capacitor bank units that were used in the harmonic filter were rated at 600 V for application on the 480 V bus. The harmonic filter component calculations are summarized in Figure 7.
Table 2 – Summary of the Simulated Voltage Distortion with a Harmonic Filter
| Case Number | 13.2 kV Bus | 13.2 kV Feeder #2 | 13.2 kV Feeder #3 | 480 V Bus #1 | 480 V Bus #2 |
|---|---|---|---|---|---|
| 7a | 0.45% | 0.53% | 2.09% | 1.28% | 4.44% |
| 7d | 1.21% | 1.62% | 4.87% | 2.92% | 9.43% |
| 7e | 0.33% | 1.11% | 1.29% | 1.82% | 2.18% |


The significant design calculations for the harmonic filter summarized in Figure 7 are shown below. The actual fundamental frequency compensation provided by a derated capacitor bank was determined using
kVAractual = kVarrated * (kVactual / kVrated)2 = 600 * (0.480/0.600)2 = 384 kVar
The fundamental frequency current for the capacitor bank was:
IFLcap = kVAractual / √3*kVactual = 384 / √3*0.480 = 461.9 Amps
The equivalent single-phase impedance (wye) of the capacitor bank was:
XCY= Vrated2 / MAVrrated = 0.6002 / 0.6 = 0.600Ω
The filter reactor impedance was determined using:
XR = XC / n2 = 0.600Ω / 4.72 = 0.0272Ω (where n = filter tuning)
Including the filter reactor increased the fundamental current to:
IFLfilter = Vbus / √3 ( XC + XR) = 480 / √3 (-0.600 + 0.0272) = 438.8Amps
Because the filter draws more fundamental current than the capacitor bank alone, the supplied fundamental frequency compensation may be determined using:
kVarsupplied = √3 * Vbus * IFLfilter = √3 * 480 * 483.8 = 402.2kVAr
The harmonic number for the new parallel resonance was approximated using:
hrnew = ( hfilter / √( 1+ (Xsc/Xfilter))) = ( 4.7 / √( 1+ (0.00576/0.0272))) = 4.27
where:
hrnew = resulting (new) parallel resonant frequency (x fundamental)
hfilter = harmonic filter tuning frequency (x fundamental)
XSC = system short circuit reactance (Ω)
Xfilter = reactance of series filter reactor (Ω)
Passive filters should always be placed on a bus where the short-circuit impedance (XSC) can be expected to remain relatively constant. While the notch frequency is determined by the filter tuning, and will remain fixed, the new parallel resonance will move as the system short circuit impedance varies. For example, one common problem occurs in factories that have standby generation for emergencies. The parallel resonant frequency for running with standby generation alone is generally much lower than when interconnected with the utility. This may shift the parallel resonance down into a harmonic where successful operation is impossible. Filters often have to be removed for standby operation because of this. Filters must also be designed with the capacity of the bus in mind. The temptation is to rate the current-carrying capability based solely on the load that is producing the harmonic. However, even a small amount of background voltage distortion on a very strong bus may impose severe duty on the filter.
SUMMARY
This case study summarized a utility distribution system harmonic analysis evaluation. The analysis included frequency response and harmonic distortion simulations for a 13.2 kV substation and several industrial customers with power factor correction capacitor banks. The mitigation alterative applied included a shunt passive harmonic filter which reduced voltage distortion levels below the specified limitations.
REFERENCES
1. IEEE Recommended Practice for Monitoring Electric Power Quality,” IEEE Std. 1159-1995, IEEE, October 1995, ISBN: 1-55937-549-3.
2.R.C. Dugan, M.F. McGranaghan, S. Santoso, H.W. Beaty, “Electrical Power Systems Quality,” McGraw-Hill Companies, Inc., November 2002, ISBN 0-07-138622-X.
RELATED STANDARDS
IEEE Std. 1159, IEEE Std. 519
GLOSSARY AND ACRONYMS
ASD: Adjustable-Speed Drive
CF: Crest Factor
DPF: Displacement Power Factor
PF: Power Factor
PWM: Pulse Width Modulation
THD: Total Harmonic Distortion
TPF: True Power Factor
