Published by Electrotek Concepts, Inc., PQSoft Case Study: Low Voltage Harmonic Filter Design, Document ID: PQS0304, Date: January 10, 2003.
Abstract: The industrial harmonic problem can be solved using a comprehensive approach including site surveys, harmonic measurements, and computer simulations.
When mitigation of harmonic distortion is required, one of the options is to apply a filter at the source of harmonics, or at a location where the harmonic currents can be effectively removed from the system. The most cost effective filter is generally a single-tuned passive filter and this will be applicable for the majority of cases. Filters must be carefully designed to avoid unexpected interactions with the system.
This case presents the design of a low voltage shunt passive harmonic filter that is applied to improve poor power factor and reduce excessive voltage distortion levels.
INTRODUCTION
When mitigation of harmonic distortion is required, one of the options is to apply a filter at the source of harmonics, or at a location where the harmonic currents can be effectively removed from the system. The most cost effective filter is generally a single-tuned passive filter and this will be applicable for the majority of cases. Filters must be carefully designed to avoid unexpected interactions with the system.
The need for filters is often precipitated by an adverse system response due to the addition of capacitors, resulting in resonance. These adverse system responses to harmonics can be modified by changing the capacitance or the reactance. Two methods that require the addition of intentional reactance are:
1. Adding a shunt filter. Not only does this shunt troublesome harmonic currents off the system, but also it completely changes the system response, often, but not always, for the better.
2. Adding a reactor to the system to simply tune the system away from resonances. Harmful resonances are generally between the system inductance and shunt power factor correction capacitors. The reactor must be added between the capacitor and the power source. One method is to simply put a reactor in series with the capacitor to move the system resonance without actually tuning the capacitor to create a filter.
This case presents the design procedure for a single-tuned passive filter at a bus supplied by a single transformer that dominates the system impedance.
A passive shunt filter works by short-circuiting the harmonic currents as close to the source of distortion as practical. This keeps the currents out of the supply system and alters the resonant frequency of the system. This is the most common type of filtering applied because of economics and that it tends to improve the load voltage as well as remove the current.
OVERVIEW OF PASSIVE FILTERS
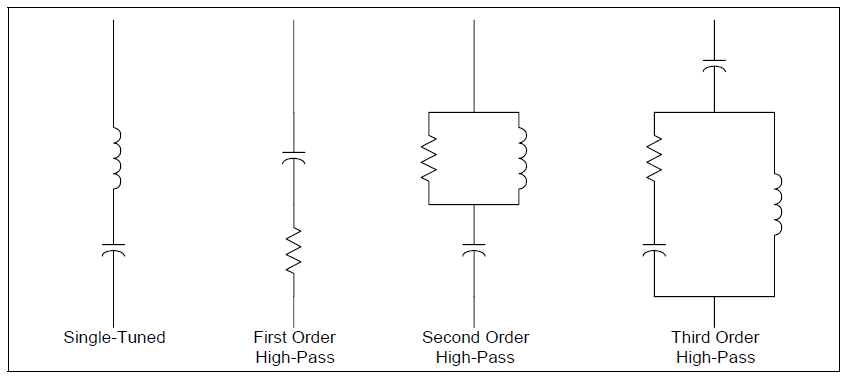
Passive filters are made of inductive, capacitive and resistive elements. They are relatively inexpensive compared with other means for eliminating harmonic distortion, but they have the disadvantage of potentially adverse interactions with the power system. They are employed either to shunt the harmonic currents off the line or to block their flow between parts of the system by tuning the elements to create a resonance at a selected harmonic frequency. Figure 1 shows several types of common filter arrangements.
Figure 1 – Common Passive Filter Configurations
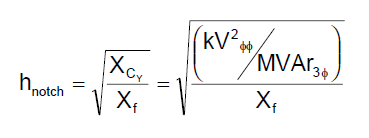
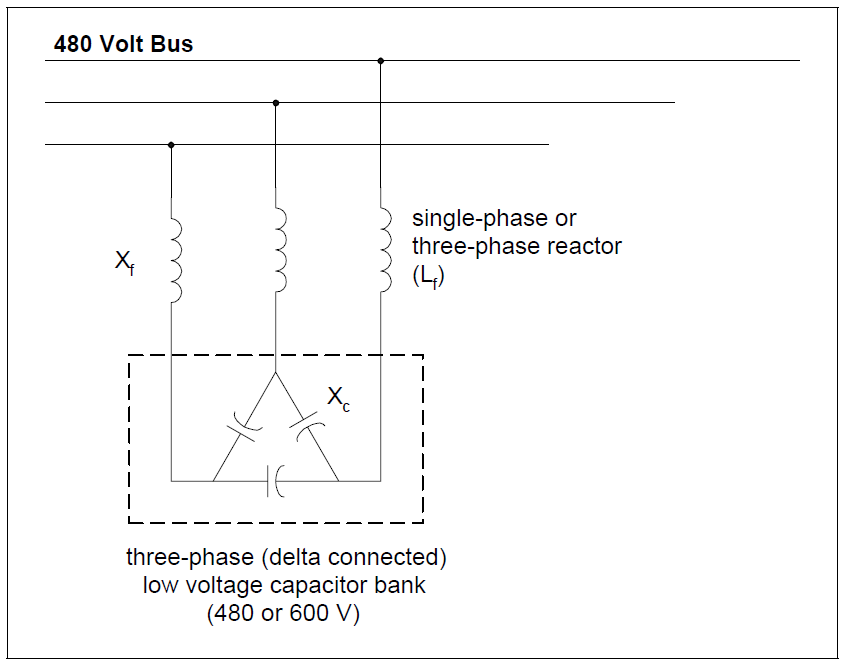
The most common type of passive filter is the single-tuned notch filter. This is the most economical type and is frequently sufficient for the application. An example of a common 480-volt filter arrangement is illustrated in Figure 2. The notch filter is series-tuned to present low impedance to a particular harmonic current. It is connected in shunt with the power system. Thus, harmonic currents are diverted from their normal flow path on the line into the filter. Notch filters can provide power factor correction in addition to harmonic suppression. Figure 2 shows a common delta-connected low-voltage capacitor bank converted into a filter by adding an inductance in series. In this case, the notch harmonic, hnotch, is determined using:
.
where: XCY = equivalent wye capacitive reactance (Ω) Xf = inductive reactance of filter reactor (Ω) kVφφ = system rms phase-to-phase voltage (kV) MVAr3φ = three-phase capacitor bank rating (MVAr)
Figure 2 – Example Low Voltage Single-Tuned Notch Filter
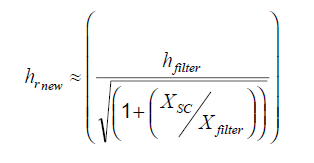
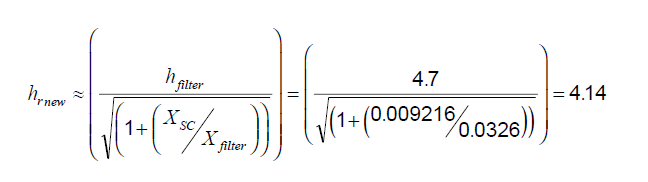
One important side effect of adding a filter is that it creates a sharp parallel resonance point at a frequency below the notch frequency. This resonant frequency must be placed safely away from any significant harmonic. The harmonic number for the new parallel resonance can be approximated using:
.
where: hrnew = resulting (new) parallel resonant frequency (x fundamental) XSC = system short circuit reactance (Ω) Xfilter = reactance of series filter reactor (Ω)
This frequency should be checked when designing filters to make sure that the parallel resonance is not introduced at a lower order characteristic harmonic. For example, installing a 7th harmonic filter may retune the system to the 5th harmonic and actually increase the voltage distortion level. It is generally good practice to apply filters starting at the lowest characteristic harmonic to avoid this problem.
Filters are commonly tuned slightly lower than the harmonic to be filtered to provide a margin of safety in case there is some change in system parameters. If they were tuned exactly to the harmonic, changes in either capacitance or inductance with temperature or failure might shift the parallel resonance higher into the harmonic. This could present a situation worse than no filter because the resonance is generally very sharp. For this reason, filters are added to the system starting with the lowest problem harmonic. For example, installing a 7th harmonic filter usually requires that a 5th harmonic filter to have been installed first. The new parallel resonance with a 7th harmonic filter only would have been near the 5th harmonic. When the two are operated side-by-side, the 5th harmonic filter must be energized first and de-energized last
A delta-connected (capacitor) filter (Figure 2) does not admit zero-sequence currents because the capacitor is connected in delta. This makes it largely ineffective for filtering zero-sequence triplen harmonics. Other solutions must be employed when it becomes necessary to control zero-sequence 3rd harmonic currents. For capacitors connected in wye, you have the option of altering the path for the zero-sequence triplen harmonics simply by changing the neutral connection. Placing a reactor in the neutral of a capacitor is a common way to force the bank to filter only zero-sequence harmonics. This technique is often employed to eliminate telephone interference.
Passive filters should always be placed on a bus where the short circuit impedance (XSC) can be expected to remain relatively constant. While the notch frequency is determined by the filter tuning, and will remain fixed, the parallel resonance will move as the system short circuit impedance varies. For example, one common problem occurs in factories that have standby generation for emergencies. The parallel resonant frequency for running with standby generation alone is generally much lower than when interconnected with the utility. This may shift the parallel resonance down into a harmonic where successful operation is impossible. Filters often have to be removed for standby operation because of this. Filters must also be designed with the capacity of the bus in mind. The temptation is to size the current-carrying capability based solely on the load that is producing the harmonic. However, even a small amount of background voltage distortion on a very strong bus may impose severe duty on the filter.
HARMONIC FILTER DESIGN METHODOLOGY
The general method for applying passive harmonic filters is
1. Apply one single-tuned shunt filter first, and design it for the lowest generated frequency (e.g., 4.7th for a six-pulse drive). 2. Determine the voltage distortion level at the low voltage bus. 3. Vary the filter elements according to the specified tolerances and check its effectiveness. 4. Check the frequency response characteristic to verify that the newly created parallel resonance is not close to a harmonic frequency. 5. If required, investigate the need for several filters, such as 5th and 7th, or 3rd, 5th, and 7th.
Filters are generally tuned slightly below the harmonic frequency of concern. This method allows for tolerances in the filter components and prevents the filter from acting as a direct short circuit for the offending harmonic current. It also minimizes the possibility of dangerous harmonic resonance should the system parameters change and cause the tuning frequency to shift slightly higher.
Capacitor stress should be evaluated with respect to nameplate values. Contingency limits may be obtained from the manufacturer or from IEEE Std. 18. Filter reactor specifications should include both a fundamental and harmonic current value. In addition, the harmonic current should be determined assuming a reasonable value for background distortion from other sources.
LOW VOLTAGE HARMONIC FILTER DESIGN
The design of an industrial low voltage (480 volt bus) shunt passive harmonic filter, rated 500kVAr @ 600 volt (connection illustrated in Figure 2) is summarized in Table 1 and shown in detail below.
Reactive Compensation
The actual fundamental frequency compensation provided by a derated capacitor bank is determined using:
.
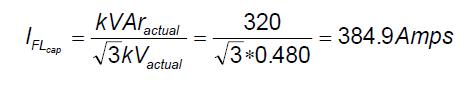
The fundamental frequency current for the capacitor bank is:
.
The equivalent single-phase impedance of the capacitor bank is:
.
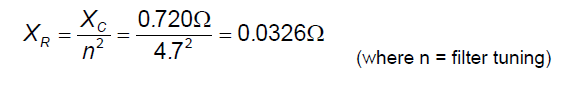
The filter reactor impedance is determined using:
.
Including the filter reactor increases the fundamental current to:
.
Due to the fact that the filter draws more fundamental current than the capacitor alone, the supplied compensation can be determined using:
.
Current and Voltage Determination
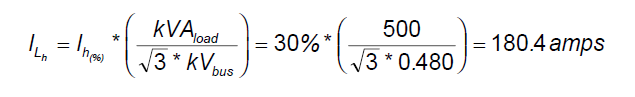
The next step involves evaluating the harmonic limits of the filter bank. The current from nonlinear load can be determined using:
.
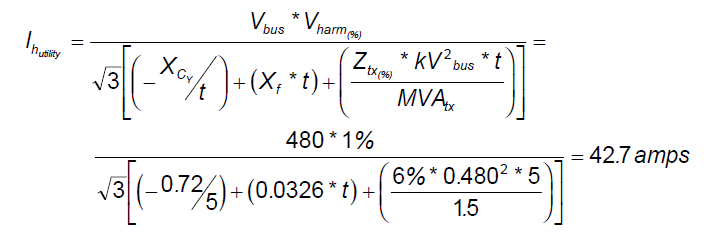
The current from utility (t = harmonic number for major component) can be determined using:
.
Assuming that the currents add, the harmonic filter load can be determined using:
.
The total rms current can be determined using:
.
The next step involves evaluating the harmonic limits of the filter bank. The fundamental frequency capacitor voltage can be determined using:
.
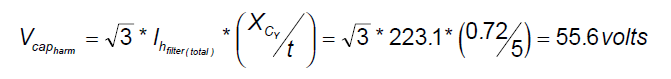
The harmonic voltage can be determined using:
.
The total rms voltage can be determined using:
.
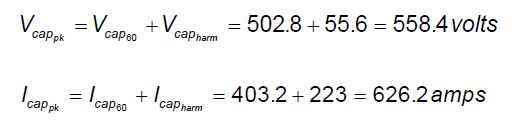
The peak voltage and current (assume in-phase addition) can be determined using:
.
Comparison with Harmonic Limits
The final step is a check against voltage ratings. The peak voltage (120%) can be determined using:
.
The rms current (135%) can be determined using:
.
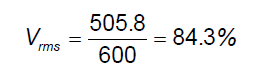
The rms voltage (110%) can be determined using:
.
The total kVAr (135%) can be determined using:
.
Quality Factor
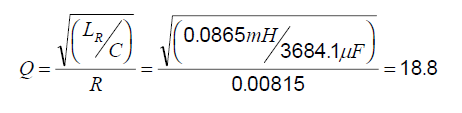
The quality factor of the filter is a measure of the sharpness of tuning and is defined as:
.
where: R = series resistance of filter (Ω) / n = tuning / XR = filter impedance (Ω)
Typically, the value of R consists of only the resistance of the inductor. In this case, the Q of the filter is equal to (n*X/R ratio → 4.7*4=18.8). This usually results in a very large value of Q and a very sharp filtering action. The reactors used for filter applications are generally built with an air core, which provides linear characteristics with respect to frequency and current. A ±5% tolerance in the reactance is usually acceptable for industrial applications.
Resulting Parallel Frequency
The harmonic number for the new parallel resonance can be approximated using:
.
where: hrnew = resulting (new) parallel resonant frequency (x fundamental) XSC = system short circuit reactance (Ω) Xfilter = reactance of series filter reactor (Ω)
Frequency Response
The frequency response characteristic illustrating the series resonance (low impedance) and resulting parallel resonance (high impedance) is shown in Figure 3.
Figure 3 – Frequency Response Characteristic with Filter in Service
SUMMARY
The industrial harmonic problem can be solved using a comprehensive approach including site surveys, harmonic measurements, and computer simulations. Simple calculations are used to determine the system resonant frequencies and then the preliminary model development is completed. Initial estimates of voltage distortion levels are made based on the level of harmonic current injection and the frequency response characteristic. A harmonic filter provides a low impedance path for harmonic currents, thereby minimizing harmonic voltage distortion problems.
REFERENCES
IEEE Recommended Practice for Electric Power Distribution for Industrial Plants (IEEE Red Book, Std 141-1986), October 1986, IEEE, ISBN: 0471856878 IEEE Recommended Practice for Industrial and Commercial Power Systems Analysis (IEEE Brown Book, Std 399-1990), December 1990, IEEE, ISBN: 1559370440 IEEE Recommended Practice for Protection and Coordination of Industrial and Commercial Power Systems, March 1988, IEEE, ISBN: 0471853925
Published by Mustafa Hussein Ibrahim1, Muhammed A Ibrahim2, University of Mosul (1), Ninevah University(2) Iraq. ORCID: 1. 0000-0002-9950-6524, 2. 0000-0003-4818-1245
Abstract. The government of Iraq recently joined the Paris Climate Agreement, it has now begun to encourage the participation of small and large consumers to generate electricity from renewable energy resources. This article analyses a hybrid solar-wind electrical system for Duhok city northern part of Iraq to know the feasibility of this system compared to the local electrical network. Firstly, an access to solar and wind resources have been ensured for Duhok. For evaluation and optimization study, both stand-alone (off-grid) and grid connecting (on-grid) systems taken into consideration to be optimized. HOMER is a software application employed to perform the power and cost analysis based on wind speed, solar irradiance and load profile. According to the numerous configurations. Simulation outcomes have been shown that the on-grid hybrid solar-wind energy system at Duhok site is most cost-effective than off-grid design for the same load, also it is better cost efficient than Duhok residential power grid, as our system cost unit COE is (0.0109 $\kWh) while Duhok residential electricity COE is 0.1$\kWh.
Streszczenie. Niedawno rząd Iraku dołączył do paryskiego porozumienia klimatycznego, teraz zaczął zachęcać małych i dużych odbiorców do udziału w wytwarzaniu energii elektrycznej z odnawialnych źródeł energii. Ten artykuł analizuje hybrydowy system energii słonecznej i wiatrowej dla północnej części Iraku w mieście Duhok, aby poznać wykonalność tego systemu w porównaniu z lokalną siecią elektryczną. Po pierwsze zapewniono Duhok dostęp do zasobów energii słonecznej i wiatrowej. Do oceny i badania optymalizacyjnego brane są pod uwagę zarówno systemy autonomiczne (poza siecią), jak i systemy przyłączania do sieci (w sieci). HOMER to aplikacja służąca do przeprowadzania analizy mocy i kosztów w oparciu o prędkość wiatru, nasłonecznienie i profil obciążenia. Według licznych konfiguracji. Wyniki symulacji wykazały, że hybrydowy system energii słonecznej i wiatrowej w sieci w Duhok jest najbardziej opłacalny niż projekt poza siecią dla tego samego obciążenia, a także jest bardziej opłacalny niż mieszkaniowa sieć energetyczna w Duhok, ponieważ koszt naszego systemu jednostka COE wynosi (0,0109 $\kWh), podczas gdy wskaźnik COE energii elektrycznej w budynkach mieszkalnych Duhok wynosi 0,1 $\kWh. (Analiza hybrydowego systemu zasilania energią słoneczno-wiatrową przy użyciu Homera dla Duhok, Irak)
Keywords: Renewable, Hybrid, Solar, Wind. Słowa kluczowe: energia odnawialna, ogniwa fotowoltaiczne, elektrownie wiatrow
Introduction
The Turning to the renewable energy resources and improving the efficiency of that environmentally, friendly power in the developed countries has been significantly noticed. This is because of rapid increase in normal or fossil fuel charge that leads to air pollution and global warming. [1]. This kind of energy expected to be invested to cover around fifty percent of the total world’s energy consumption by 2040. [2]. The dependency on nuclear power and fossil fuel can be reduced via growing the renewable energy applications. Renewable resources are unpolluted, sustainable and used as decentralized generation units. Moreover, it has an extra constructive position of being free energy [3].
The government of Iraq recently joined the Paris Climate Agreement, which aims to reduce global warming. The government has now begun to encourage the participation of small and large consumers to generate electricity from renewable energy resources. In the present work, we use HOMER Pro software to evaluate a suggested hybrid solar-wind electrical system at Duhok city to know the feasibility of this system compared to the local electrical network, also for more optimization details, both stand-alone and grid connecting systems taken into consideration to be optimized.
The suggested model at this article is unique because a similar study has not been done before in this site (Dohuk city) therefore cannot to be precisely compared among other available models at other sites. for the reason that the input parameters such as wind/solar/temperature can certainly vary from site to site making the optimization results varied and cannot be compared correctly.
System Description
The proposed hybrid solar-wind electrical system with battery bank and local grid, illustrated in simple diagram as shown in Fig. 1 below:
Fig. 1 The basic diagram for the suggested hybrid solar-wind electrical system
The solar system provides energy when the sun is shine( clear sky days ) whereas on frosty days which are frequently to be cloudy, the wind systems will substitute solar panels in providing more power for both off-grid and on-grid appliances. Here is a design of both on-grid in addition to the off-grid systems for hybrid solar-wind power system in Duhok city. The main reason of selecting Duhok site (Fig. 2) is location where the power grid availability is about 24 hours and the ease access for solar and wind resource.
The available sun radiation on earth computed in to two main approaches. The first method is calculated according to the Global Horizontal Irradiance GHI which is usually calculated by a pyranometer while the second technique is according to immediate normal irradiance DNI which is measured by a pyrheliometer [4][5].
Fig. 2 The case study location (Duhok) on the world map.
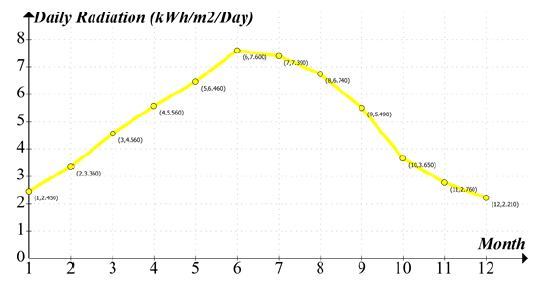
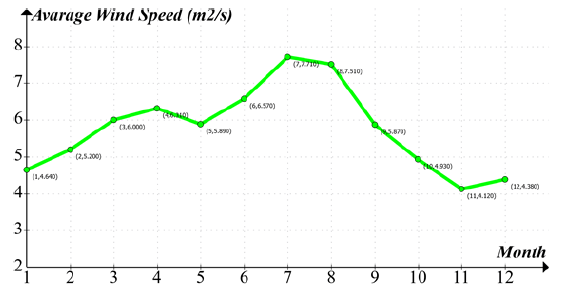
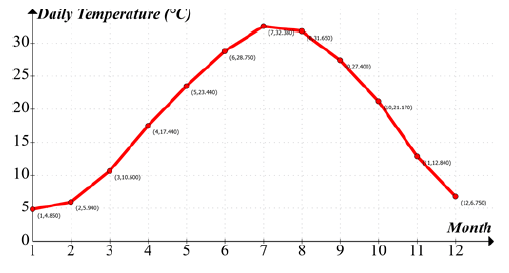
Both wind speed and solar Irradiance data have been obtained for Duhok, Iraq is determined by surface meteorology and solar energy project (SSE) of National Aeronautics and Space Administration (NASA) [6], which collects meteorology and insolation data for entire earth in order to help in the evolution of renewable and clean energy systems [7]. As showed in HOMER program software, the longitude and latitude of Duhok is 42°56’38.0″ E, 36°51’36.4″ N respectively. The mean daily irradiance per each month showed in Fig. 3 for an annual average 4.85 (kWh/m2/day), whereas Fig. 4 reports the mean daily wind speed per each month for annual average 5.67 (m/s). also the mean daily irradiance per each month showed in Fig. 5 .
Fig. 3 Monthly average solar irradiance.
Fig. 4 Monthly average wind speed.
Fig. 5 Monthly average ambient temperature.
Methods
Wind turbine system
Wind turbine acquires the mean power production characteristic which varies according to determinations of the producer. Wind turbine starts generating electricity at their cut-in speed then power starts to increase until turbine reaches the rated speed. It should be noted that power curve of wind turbines is one of very significant characteristics, which describes the relation of the power produced by the turbine with a rotational speed [8][9]. The total annual power (WE) in (kWh) generated by wind turbine can be represented via equation (1) below:
.
where (Nh) is the number of data hour in the year, (t) is the hour of the year, (Ptr) is the power output in (kW) as function of the average wind speed over a given hour, and (Ntr) is the numbers of turbines at the site [7].
The wind power output (Pw) in (kW) is specified by the following relation in equation (2), where (pα) is the air density ≈ (1.22 kg/m3), (A) is the swept area of wind turbine rotor in (m2), (Vr) is the velocity of wind in (m/s), (Cp) is the wind turbine power coefficient, (ng) is the efficiency of wind generator and (nt) is the efficiency of wind turbine.
.
Photovoltaic system
The following relation in equation (3) can calculate the total annual power (SE) results from Photovoltaic system in (kWh). Where (Nh) is the number of data hour in the year, (t) is the hour of the year, (Asolar) is the fixed area of the solar field in (m2), (Gt) is the hourly insulation in (Wm-2), (nsolar,t) is the solar system efficiency for a specified hour of day through a given month [10].
.
The output power of the photovoltaic system (ppv) in (kW) expressed in the following relation in equation (4). Where (fPV) is the derating factor percentage for the photovoltaic array, (YPV) is the photovoltaic array rated capacity in (kW), which is the power production under STC. (GT,STC) is the incident solar insolation at STC (1 kW/m2), (GT) is the solar insolation incident on the PV array at the current time step in (kW/m2), (Tc,STC) is the temperature of the photovoltaic cell under STC which is 25°C, (Tc) is the temperature of the photovoltaic cell at the current time step in (°C), and (αP) is the power temperature coefficient in (%/°C). [11][12][13].
.
The following relation in equation (5) determines the total annual power output in (kWh) obtained from the renewable hybrid system (HE) that denotes to the sum of PV power (SE) and WT power (WE) [14]:
.
HOMER program simulation model
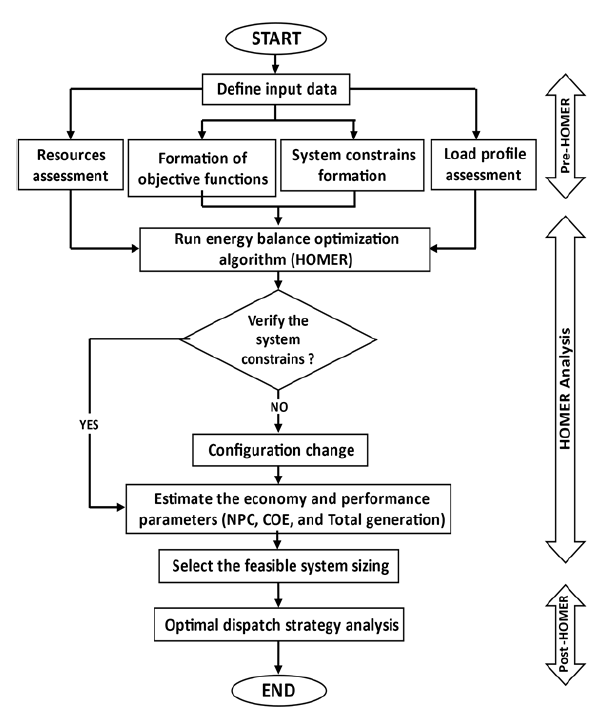
Hybrid optimization model for electric renewables (HOMER) is a computer model established by the National Renewable Energy Laboratory in the United States (NREL) to help designers to design renewable energy systems in both ON-grid and OFF-grid projects and ease the assessment of power generation technologies through an extensive variety of combinations. [15],[16]. A flowchart of HOMER simulation process can be found in Fig. 6 below which describing all the simulation stages in detail [17]:
Fig. 6 A flowchart of HOMER simulation process
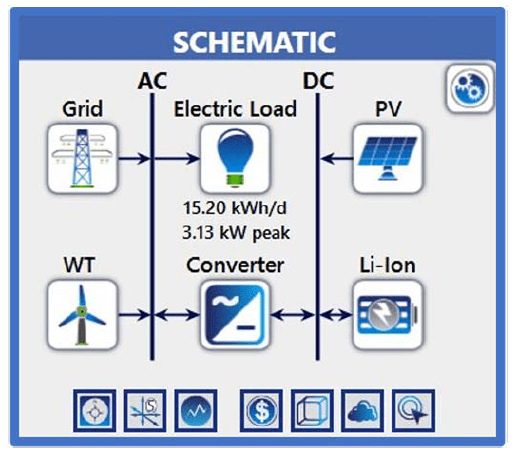
Fig. 7 HOMER Schematic for grid connected model (on-grid)
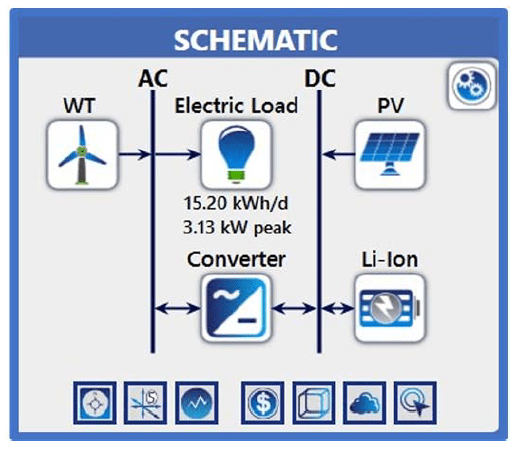
Fig. 8 HOMER Schematic for standalone model (off-grid)
The hybrid power model designed in the HOMER program is shown in Fig. 7 & Fig. 8 respectively. This model consists of Generic 3 kW wind turbine, Generic PV flat plate, electronic converter, Generic Li-ion 1 kWh battery and residential load.
Optimization analysis
HOMER simulates all the achievable solutions for the system, then shows a list of all feasible system patterns planned gradually from lowest to highest in NPC (Net Present Cost) and excludes all the infeasible configurations. HOMER use a proprietary derivative-free algorithm to exploration for the optimum solution among all these feasible systems. The least NPC is the optimum design for the system [18],[19],[20].
Many researchers have utilized HOMER for analyzing [21],[22],[23],[24]. Analysis with HOMER needs a wide range of data on renewable resources, energy storage systems, control algorithms and economic restrictions. The evaluation criteria of the HOMER assessment are the Net Present Cost (NPC) and the Cost of Energy (COE). The COE is defined in HOMER as the mean cost/kWh of valuable power generated by the system. To compute the value of COE, Homer program will divide the yearly cost of electricity production by the beneficial generated electricity. the COE can be calculated by the relation in the following equation (6):
.
Where (Egrid,sales) is the overall sold energy from the grid in(kWh/year), (Eprim,DC) is the DC primary load served in (kWh/year), (Eprim,AC) is the AC primary load served in (kWh/year) and (Cann,tot) is the overall yearly cost in ($/year).
The total NPC is calculated in HOMER using the relation in the following equation (7), where (Cann,tot) is the overall yearly cost in ($/year), (CRF) is the capital recovery factor, (Rproj) the project lifetime in year, (i) the interest rate %, While the (CRF) is calculated by the equation (8) [11].
.
In order to calculate the optimal cost, the model has been configured to simulate the same electrical load with the off-grid and on-grid design.
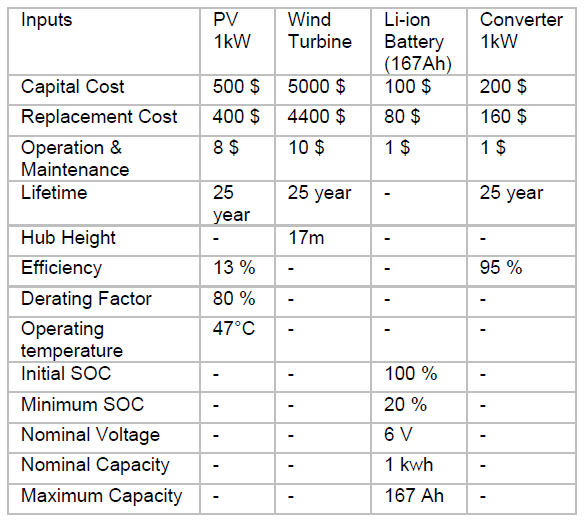
Table 1. The Data Input for Proposed Model.
.
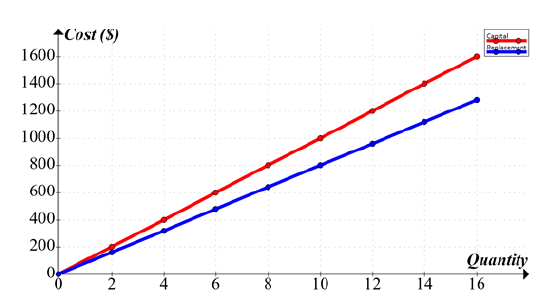
Fig. 9 Capital & Replacement cost curve for the Li-ion battery.
A Generic PV flat panel is utilized, these photovoltaic panels are flat plate builds by Generic, the wind unit is an A.C Generic 3 KW, also a generic lithium-ion battery has been utilized with a nominal capacity of 1 kWh, and a generic converter this is important to supports the hybrid system design in off-grid configuration. From observing the cost curve in Fig. 9, it is clear that varying the amount of batteries will affect the cost, which will ultimately affect the total NPC.
The grid model unit is a local grid with 10 kW capacity, power rate definition is 0.1$\kWh and sellback rate of 0.05$\kWh, when there is power shortage, the grid provides electricity to achieve a load request. Further, it receives electrical power when excessive energy is available.
Results and discussion
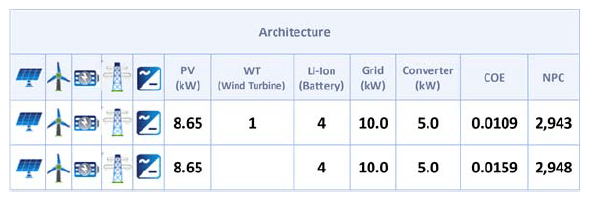
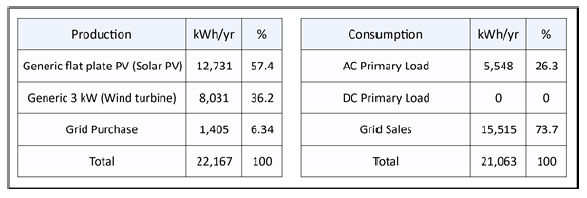
In this paper, a domestic load used in the proposed hybrid system. Supposing that the project life is 25 year. Fig. 10 and Fig. 11 presents the optimization outcomes for proposed model in both designs on-grid and off-grid respectively. Optimization progression has been executed during each achievable choice of variables of this hybrid system regardless the effect of sensitive variables. Fig. 12 shows the total annually production of proposed model 22,165 kWh/yr with 21,063 kWh/yr consumption in residential load.
Fig. 10 Screenshot for optimization results at ON-Grid model.
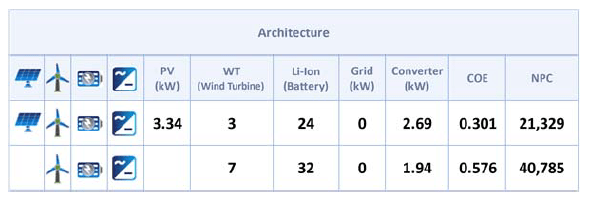
Fig. 11 Screenshot for optimization results at OFF-Grid model.
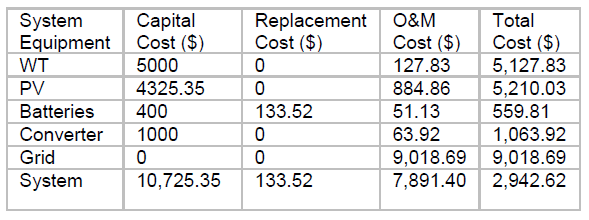
Table 2. Cost Optimization Analysis for the System
.
Fig. 12 Screenshot for Power production & consumption at HOMER on-grid model
The lowest COE (Cost of Energy) obtained from HOMER results is 0.0109$, while Duhok residential electricity is 0.1$\kWh [25]. the renewable energy contribution was 93%. HOMER’s derivative-free algorithm will determine the optimal contribution ratio between renewable energy sources to supply the residential load efficiently with the desired power. As shown in Fig. 11 the energy cost of an off-grid system (COE 0.301$) is much higher than the on-grid system (COE 0.0109$). The total NPC for off-grid and on-grid system are 21,329$ and 2,943 $ respectively.
Conclusion
This academic piece of paper presents a comparative study of a two hybrid renewable energy systems, one connected to the local grid (on-grid) and the other is standalone (off-grid), without taking the influence of sensitive variables into consideration. This study occurred in Duhok , north of Iraq due to ease of solar and wind data access. The simulation results of the proposed system proved that hybrid solar-wind energy system connected to the local grid is most cost-effective than off-grid design for the similar load. Our hybrid system is better cost efficient than Duhok residential power grid, as our system cost unit is (0.0618 $\kWh) while Duhok residential electricity is 0.1$\kWh.
Acknowledgements Authors are very grateful to the (Mosul university / college of science and Nineveh University / College of Electronics Engineering) for their provided facilities, which helped to enhance the quality of this work.
REFERENCES
[1] Razak N, Othman M. Bin, Musirin I. Optimal sizing and operational strategy of hybrid renewable energy system using HOMER. 4th International Power Engineering and Optimization Conference (PEOCO). Selangor, Malaysia. 2010; 1: 495-501. [2] Kharrich M, Mohammed O, Kamel S, Selim A, Sultan H, Akherraz M, Jurado F. Development and implementation of a novel optimization algorithm for reliable and economic grid independent hybrid power system. Applied Sciences (Switzerland). 2020; 10(18). [3] Al-hafidh M, Ibrahem M. Zero Energy House in Iraq. International Journal of Inventive Engineering and Sciences. 2014; 2(7). [4] Reno M, Hansen C. Global horizontal irradiance clear sky models implementation and analysis. Sandia National Laboratories. Report number: 2389. 2012. [5] Vendoti S, Muralidhar M, Kiranmayi, R. Modelling and optimization of an off-grid hybrid renewable energy system for electrification in a rural area. Energy Reports. 2020; 6(2352). [6] The Atmospheric Science Data Center (ASDC). (2021, May 7). NASA Earth Science Data. https://earthdata.nasa.gov/eosdis/daacs/asdc. [7] Alsharif M. Optimization design and economic analysis of energy management strategy based on photovoltaic/energy storage for heterogeneous cellular networks using the HOMER model. Solar Energy. 2017; 147(38). [8] Sarkar J, Khule S. A study of MPPT schemes in PMSG based wind turbine system. International Conference on Electrical, Electronics, and Optimization Techniques (ICEEOT). Chennai, India. 2016; 1: 100–105. [9] Tigabu M, Guta D, Admasu B. Economics of Hydro-Kinetic Turbine for off-grid Application: A Case Study of Gumara River, Upper Blue Nile, Amhara, Ethiopia. International Journal of Renewable Energy Research-IJRER. 2019; 9(3). [10] Reichling J, Kulacki F. Utility scale hybrid wind-solar thermal electrical generation: A case study for Minnesota. Energy. 2008; 33(4). [11] Fantidis J, Bandekas D, Vordos N. Study of a Wind/PV/Battery hybrid system – Case study at Plaka in Greece. Journal of Engineering Science and Technology Review. 2015; 8(3). [12] Sanni S, Ibrahim M, Mahmud I. Potential of Off-grid Solar PV/Biogas Power Generation System: Case Study of Ado Ekiti Slaughterhouse. International Journal of Renewable Energy Research-IJRER. 2016; 9(3). [13] Ladide S, EL Fathi A, Bendaoud M. Flexible design and assessment of a stand-alone hybrid renewable energy system: a case study Marrakech, Morocco. International Journal of Renewable Energy Research-IJRER. 2019; 9(4). [14] Sofimieari I, Bin Mustafa M, Obite F. Modelling and analysis of a PV/wind/diesel hybrid standalone microgrid for rural electrification in Nigeria. Bulletin of Electrical Engineering and Informatics. 2019; 8(2302) [15] Givler T, Lilienthal P. Using HOMER® Software NREL’s Micropower Optimization Model to Explore the Role of Gensets in Small Solar Power Systems. A national laboratory of the U.S. Department of Energy Office of Energy Efficiency & Renewable Energy. Report number: TP-710-36774. 2005. [16] Lilienthal P, Lambert T. HOMER The Micropower Optimization Model. A national laboratory of the U.S. Department of Energy Office of Energy Efficiency & Renewable Energy. Report number: FS-710-35406. 2004. [17] Murugaperumal K, Ajay P. Feasibility design and technoeconomic analysis of hybrid renewable energy system for rural electrification. Solar Energy. 2019; 188(38). [18] Giraud F, Salameh Z. Steady-state performance of a grid-connected rooftop hybrid wind-photovoltaic power system with battery storage. IEEE Transactions on Energy Conversion. 2001; 16(1). [19] Al-Hafidh M, Ibrahem M. Hybrid power system for residential load. International Conference on Electrical, Communication, Computer, Power, and Control Engineering (ICECCPCE). Mosul, Iraq. 2013; 12: 70-75. [20] Ibrahim MH, Ibrahim MA. The Optimum PV Panels Slope Angle for Standalone System: Case Study in Duhok, Iraq. IOP Conf. Ser.: Mater. Sci. Eng. Diyala, Iraq. 2021; 1076: 12004. [21] Babalola AD, Yakubu AJ. Development of an Alternative Hybrid Power System using Hybrid Micro Power Optimization Model (HOMER). International Journal of Advance Industrial Engineering. 2019; 7(1). [22] Goyal S, Mishra S, Bhatia A. A comparative approach between different optimize result in hybrid energy system using HOMER. International Journal of Electrical and Computer Engineering (IJECE). 2019; 9(1). [23] Deshmukh M, Singh A. Modeling of energy performance of stand-alone SPV system using HOMER pro. Energy Procedia. 2018; 156(1876): 90–94. [24] Kamran M, Asghar R, Mudassar M. Designing and Optimization of Stand-alone Hybrid Renewable Energy System for Rural Areas of Punjab, Pakistan. International Journal of Renewable Energy Research-IJRER. 2018; 8(4). [25] General Directorate of Duhok. (2021, May 29). General Directorate of Duhok Government Electricity. http://www.duhokprovince.com
Authors: Mustafa Hussein Ibrahim, Department of New and Renewable Energy, College of Science, Mosul University, Iraq, Email: MustafaHussein@uomosul.edu.iq ; Muhammed A Ibrahim, Department of Systems and Control, College of Electronics Engineering, Ninevah University, Iraq, E-mail: muhammed.ibrahim@uoninevah.edu.iq .
Source & Publisher Item Identifier: PRZEGLĄD ELEKTROTECHNICZNY, ISSN 0033-2097, R. 97 NR 9/2021. doi:10.15199/48.2021.09.28
Published by Electrotek Concepts, Inc., PQSoft Case Study: Substation Resonance and Harmonic Filter Application, Document ID: PQS0702, Date: July 26 1, 2007.
Abstract: A utility operates a 16.2 MVAr capacitor bank on a 24kV substation bus that supplies various customers that have significant amounts of nonlinear loads. The utility is investigating the possible conversion of the capacitor bank into a harmonic filter bank to control the frequency response characteristic and reduce the overall harmonic distortion levels. This case study presents some of the findings associated with a harmonic resonance study that included frequency scan simulations.
INTRODUCTION AND MODEL DEVELOPMENT
A substation harmonic resonance and filter application evaluation was completed for the system shown in Figure 1. The accuracy of the system model was verified using three-phase and single-line-to-ground fault currents and other steady-state quantities, such as capacitor bank rated current and voltage rise.
Figure 1 – Oneline Diagram for the Harmonic Resonance Case Study
SIMULATION RESULTS
The frequency response characteristic is determined by using frequency scan simulations. A frequency scan is the most commonly used technique for harmonic analysis of power systems. A scan determines the impedance vs. frequency characteristic at a particular bus by injecting a one-amp current source at the bus over a range of frequencies and then observing the resulting voltage. The voltage is directly related to the system impedance in ohms. Frequency scan analysis is the best method for identifying resonance conditions and evaluating harmonic filter designs.
Figure 2 shows the impedance vs. frequency simulation result for the basecase condition that has no shunt capacitor banks in service. The frequency scan is completed at the 24kV bus at Substation 1 where the 16.2 MVAr capacitor bank is installed. The frequency range for the scan is from 60 Hz to 5,000 Hz, with a 1 Hz increment.
Figure 2 – Basecase Frequency Response Characteristic
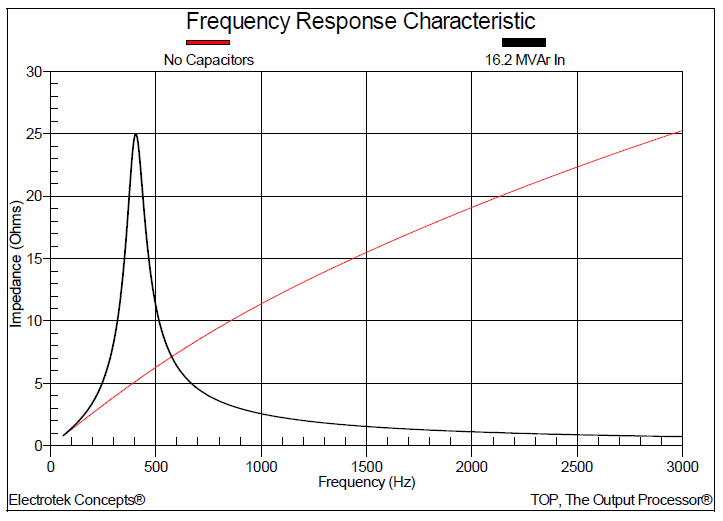
Figure 3 shows the impedance vs. frequency simulation result with the 16.2 MVAr, 24kV capacitor bank in service. The initial basecase result is also shown on the graph so the two conditions can be compared. The simulated parallel resonance due to the addition of the shunt capacitor bank was 404 Hz (6.73th harmonic). A simple hand-calculation can be used to validate this result:
.
where: hr = parallel resonant frequency (x fundamental) MVA3φ = three-phase short circuit capacity (MVA = √3*24kV*16.85kA≈700MVA) MVAr3φ = three-phase capacitor bank rating (MVAr)
Figure 3 – Frequency Response with 16.2 MVAr Capacitor Bank In-service
The simulated resonant frequency is slightly different from the calculated value. This is primarily due to the capacitance of the distribution feeder (that is ignored during the hand-calculation approximation) and the effect of load. The simulated steady-state voltage rise of 2.28% (23.4183kV vs. 23.9523kV) is also quite close to the calculated value:
.
Figure 4 shows the effect on the simulated frequency response characteristic when adding the two 300 kVAr, 4.16kV capacitor banks. The simulated parallel resonance is shifted slightly to 432 Hz (7.2th harmonic).
Because the resonant frequency shown in Figure 4 is near the 7th harmonic (432 Hz), it might be assumed that the solution to the problem would be to convert the 16.2 MVAr capacitor bank into a 7th harmonic filter. This would seem at first to be a reasonable approach since the goal of applying a harmonic filter is to change an uncontrolled high impedance (high voltage distortion) condition to a lower impedance condition (low voltage distortion). Figure 5 shows the impact on the simulated frequency response characteristic when converting the capacitor bank into a 7th harmonic filter. The previous case results are also shown on the graph so the conditions can be compared.
As can be observed in Figure 5, the high impedance near the 7th harmonic is replaced with a lower impedance value. This would suggest that the resulting voltage distortion should also be reduced when the filter is applied. However, the application of a single-tuned shunt filter bank creates a new parallel resonance that must also be evaluated. The simulated new parallel resonance frequency is 288Hz (4.8th harmonic).
Figure 4 – Frequency Response with 16.2 MVAr and 300 kVAr Capacitor Banks In-service
Figure 5 – Frequency Response with 16.2 MVAr, 7th Harmonic Filter
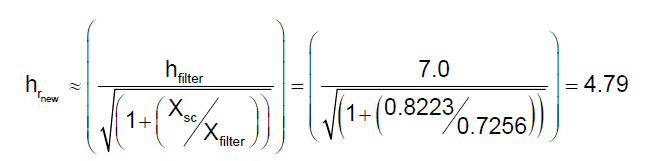
The harmonic number for the new parallel resonance may be approximated using:
.
where: hrnew = resulting (new) parallel resonant frequency (x fundamental) XSC = system short circuit reactance (Ω – (24kV/√3)/16.85kA=0.8223Ω) Xfilter = reactance of series filter reactor (Ω)
This frequency should be checked when designing shunt harmonic filters to make sure that a parallel resonance is not introduced at a lower order characteristic harmonic. In this example, installing a 7th harmonic filter retunes the system near the 5th harmonic which may actually increase the voltage distortion level. It is generally good practice to apply filters starting at the lowest characteristic harmonic to avoid this problem (e.g., 4.7th filter for six-pulse drive load).
Figure 6 shows the influence on the simulated frequency response characteristic when converting the 16.2 MVAr capacitor bank into a 4.7th harmonic filter. The previous case results are also shown on the graph so the conditions can be compared. The application of the 4.7th harmonic filter results in a new parallel resonance frequency that is 230Hz (3.8th harmonic).
Figure 6 – Frequency Response with 16.2 MVAr, 4.7th Harmonic Filter
SUMMARY
A harmonic filter provides a low impedance path for harmonic currents, thereby minimizing harmonic voltage distortion problems. The filter is generally tuned slightly below the harmonic frequency of concern. This method allows for tolerances in the filter components and prevents the filter from acting as a short circuit for the offending harmonic current. A general method for applying filters includes:
1. Apply one single-tuned shunt filter first, and design it for the lowest generated frequency (e.g., 4.7th). 2. Determine the voltage distortion level at the bus. The commonly applied limit of 5% was introduced in IEEE Std. 519. 3. Vary the filter elements according to the specified tolerances and check its effectiveness. 4. Check the frequency response characteristic to verify that the newly created parallel resonance is not close to a harmonic frequency. 5. Complete standards compliance check (e.g., IEEE Std. 519) if required. 6. If necessary, investigate the need for several filters, such as 5th and 7th.
REFERENCES
IEEE Recommended Practice for Electric Power Distribution for Industrial Plants (IEEE Red Book, Std 141-1986), October 1986, IEEE, ISBN: 0471856878 IEEE Recommended Practice for Industrial and Commercial Power Systems Analysis (IEEE Brown Book, Std 399-1990), December 1990, IEEE, ISBN: 1559370440 IEEE Recommended Practice for Protection and Coordination of Industrial and Commercial Power Systems, March 1988, IEEE, ISBN: 0471853925
Published by 1. Rafael GIVANILDO, 2. Denis LIMA, 3. Paulo PARIS, 4. Emerson PEDRINO Department of Computer Science, Federal University of Sao Carlos, Sao Carlos, Brazil
Abstract. This article aims to carry out a brief bibliographical review on the main concepts related to Smart Grid, in addition to the development of a low-cost and open-source smart meter prototype. This research was carried out based on concepts involved and used in developing the CS5463 chip, an embedded Linux system, and several software libraries, which helped with the implementation of the reference algorithm and charging simplification. Furthermore, the prototype had positive results, as it was possible to implement the proposed algorithms with a cost below US $ 50.00 and achieved an accuracy above 90%. Finally, it is concluded that the concept of Smart Grid and everything that permeates it is fundamental, especially given the context of digital transformation in this area. Such a prototype is an initial entry alternative for developing technologies that are trending in this area.
Streszczenie.. Celem tego artykułu jest przeprowadzenie krótkiego przeglądu bibliograficznego głównych pojęć związanych ze Smart Grid, a także opracowanie taniego prototypu inteligentnego licznika o otwartym kodzie źródłowym. Badania te zostały przeprowadzone w oparciu o koncepcję wykorzystana w opracowaniu układu CS5463, wbudowanego systemu Linux oraz kilku bibliotek oprogramowania, które pomogły we wdrożeniu algorytmu referencyjnego i uproszczeniu ładowania. Co więcej, prototyp uzyskał pozytywne wyniki, ponieważ możliwe było wdrożenie proponowanych algorytmów kosztem poniżej 50 USD i osiągnął dokładność powyżej 90%. Na koniec stwierdza się, że koncepcja Smart Grid i wszystko, co się przez nią przenika, ma fundamentalne znaczenie, zwłaszcza w kontekście cyfrowej transformacji w tym obszarze. Taki prototyp jest wstępną alternatywą dla rozwoju technologii, które są trendy w tej dziedzinie. (Tani i dokładny prototyp inteligentnego licznika dla inteligentnych sieci)
Keywords: Smart Meters, Smart Grids, Low-Cost Prototype. Słowa kluczowe: Smart Grid, miernik inteligentny, pomiar mocy
Introduction
Since the invention of electrical networks, there have been no significant changes in the technology used for the generation, transmission, and distribution of electrical energy, where the technologies used to date back to the end of the 19th-century [1] [2] [3].
As the global demand for energy increases, it is necessary to use techniques to make the network more efficient and actual, giving rise to a new concept to solve this challenge, called Smart Grids [4].
NIST (National Institute of Standards and Technology) defines Smart Grids as an electrical network that uses two-way flow information with secure communication and artificial intelligence technologies to integrate the entire spectrum of the power system, from power generation to final customer [5]. In the Brazilian context, the implementation of this concept is motivated mainly to reduce the non-technical losses of the network, which according to Aneel is around 6.6%. Also, there is a quest to increase the reliability of the system, reduce operating costs – especially those related to measurement, and increased energy efficiency [6] [7].
One of the challenges for the massive implementation of Smart Grid in Brazil is related to the large volume of investment required for its implementation. The key component, which requires most of this investment, is related to the exchange of the meter park for smart meters [8].
In this context, this work develops an initial prototype of an intelligent energy meter. The prototype will be presented as being of low cost concerning the prices of similar equipment (ranging from U$ 50 to U$ 100 for home use), with free software and code compatible with multiple embedded platforms. The decrease in cost of the meter is important, as it decreases the amount of investment needed to update the meter park [9] [10]. Besides, the prototype can be a starting point for future work in the area of Non-intrusive load monitoring (NILM).
Fig. 1. Demonstration of a complete smart grid system, with its main components and interconnections [12]
Fig. 2. Basic Conventional and Smart Meter Architectures Concept [12].
This article is organized as follows: Section 2 presents the concept of Smart Grid, section 3 presents the concept of Smart Meter, section 4 presents the developed prototype, and section 5 presents the results obtained. Finally, section 6 presents the conclusions.
Smart Grid Overview
In the current world scenario, the availability of electricity is essential for contemporary societies, as it is closely related to most activities. The unavailability of energy generates several negative impacts.
Unfortunately, classic networks are not resilient and agile, being susceptible to problems with generation (lack of demand) and transmission/distribution (quality problems and issues related to technical and non-technical losses) directly affecting the final consumer.
In 2005, S. Massoud Amin and Bruce F. Wollenberg coined the term Smart Grid in a publication by the IEEE (Institute of Electrical and Electronics Engineers). The authors define the term as large-scale electrical network infrastructure characterized by security, agility, and resilience/robustness facing new threats and unplanned conditions [11]. The term coined by them, meant a major paradigm shift, going beyond the simple implementation of certain technology to something bigger.
There are several motivations to justify investing in Smart Grid. Some of them are improvement in the country’s energy security, reduction of greenhouse gas emissions, and the possibility of reducing operational costs and nontechnical losses.
Brazil, like most developing countries, is in the initial stage of implementing the Smart Grids concept.
Looking from the distribution point of view, where there is an interconnection between the final consumer and the distribution sector, it is necessary to implement an architecture known as AMI – Advanced Metering Infrastructure, which enables bidirectional communication and several new network functionalities.
The key equipment of this architecture is Smart Meters, which collect and send data in a bidirectional way between the customer and the distributor. These devices are the target of this article. The meters can use different communication technologies, such as PLC, RF Mesh, or mobile networks, to establish the connection with the concentrators – or directly with the distributor depending on the case.
Looking at the network architecture in (Fig. 1), AMI is composed of three types of networks, they are Home area network – HAN, Neighborhood area network – NAN, and Wide area network – WAN. HAN is a network generated by smart meters and is responsible for collecting all information on consumption, micro-generation, and household occurrences.
Besides, this network can connect smart devices to the meter, allowing demand control by the distributor if necessary. NAN is the network responsible for concentrating data from existing meters in the neighborhood and sending it to the distributor via WAN. In this stage, concentrators are used, which concentrate data from smart meters and send them via IP network to the distributor’s backbone. After sending data over the WAN, they arrive at the distributor where it will be used for the most diverse services. It is worth mentioning the module known as MDMS (meter data management system) is responsible for managing, storing, and analyzing the data received.
Smart Meter Overview
Before talking about smart energy meters, it is important to talk about the origin and evolution of the meters. Electromechanical meters were the first-meter model and are still widely used today. They are based on the principle of electromagnetic induction, having been invented by Shallenberger in 1888 [13]. This meter measures only the active energy consumption, and manual data collection is required for data collection. The flow of information is unidirectional. The useful life of this type of meter can reach 25 years [10].
With the development of digital systems and their subsequent cheapening, electronic energy meters emerged. This type of meter is based on the use of A/D converters and a microcontroller or microprocessor for sampling techniques to determine the energy consumed by the consumer.
In general, electronic meters are more accurate than electromechanical meters. This type of meter has the following disadvantages: the fact that its useful life is between 13 and 15 years; there is uncertainty about its operation under severe climatic conditions and its cost greater than the electromechanical [13]. Fig. 2 shows some aspects and characteristics of conventional energy meters in relation to Smart Meters.
Over time, electronic meters have evolved into what is now known as smart energy meters. The Edison Electric Institute (EEI) defines Smart Meters as: “electronic metering devices used by utility companies to transmit information for charging the consumer and for operating electrical systems” [14] [15]. There is still no general definition of what features define a smart meter or smart metering system. For this paper, we use the definition by Mohassel, Moahammadi, Fung, and Raahemifar [16]. They are:
• Time-based pricing; • Providing consumption data for consumers and utility; • Net metering; • Failure and outage notification; • Remote command (turn on / off) operations; • Load limiting for Demand Response purposes; • Power quality monitoring including phase, voltage, and current, active and reactive power, power factor; • Energy theft detection; • Communication with other intelligent devices; • Improving environmental conditions by reducing emissions through efficient power consumption.
Looking at the market solutions, we have several meter manufacturers, where we can mention as examples: WEG, General Electric, Itron, Nansen, Siemens, Schneider Electric, among others. In general, these meters are modular, measure active and reactive energy in the four quadrants, active and reactive demand, in addition to items related to network quality. These meters are bidirectional, with the possibility of using multiple forms of communication (PLC, RF, Ethernet, Wifi, Zigbee, GSM / GPRS / CDMA). Also, these meters allow the programming of several charging models, mass memory, and the possibility of fraud detection. Optionally, some meters have tools for use in smart homes.
Fig. 3. Basic items utilized for the implementation of prototype Smart Meter.
Smart Meter Prototype
The implemented smart meter prototype proposed is based on non-intrusive, low cost and easy to find components. Based on the design problems presented by Depuru, Wang, and Devabhaktuni [12], we try to address issues related to the technologies used for measurement/charging, meter cost, and communication. Fig. 3 shows the diagram of the mentioned items, which during this section will be better explained.
The measurement and charging technologies involved with the proposed prototype were developed using the Cirrus Logic CS5463 IC, an integrated circuit specialized in measuring electrical parameters, together with the MRAA library – library for embedded Linux systems that easy I/O communication-, implements SPI communication, and allows code portability across multiple embedded systems. The tariff was based on a simplified version of Aneel’s resolution, No. 733 of 2016, which regulates the white tariff (Brazilian seasonal tariff). It was also sought that the prototype minimally could obey the resolution of Aneel nº502, which lists the minimum requirements for energy meters, but maintaining the low-cost prerogative.
Looking at market solutions, the meter features energy measurement, active and reactive demand, bidirectional communication, mass memory, and communication with the Internet via Wi-Fi. Besides, the existing pricing is based on consumption time (Time-based pricing). The final cost of the prototype was US $ 45.00. The basic characteristics of the prototype are:
• Operation: 127 / 220V; • Measurement of Voltage, Current, Frequency, Active, Reactive and Apparent Power and Power Factor; • Internet connection via Wi-Fi; • Ability to save data on the memory card; • Display with measurement information; • Non-intrusive, allowing easy installation of the prototype; • Implementation of a simplified version of the White Tariff; • Online panel with measurement information; • Open source code: (https://bitbucket.org/Mud_Owl/ic_mud_owl_v2).
The design and construction of the hardware/software used a bottom-up approach. It started with simplified hardware and software and, after several studies and tests, it evolved to the above characteristics.
Thus, the system architecture shown in Fig. 4 was developed. The sensors gather the information from the network and the meter (IC meter and development board) is responsible for allowing the visualization of the data, making the communication interfaces, and processing the electrical measurements and the tariff.
Fig. 4. Flowchart containing the architecture of prototype.
Hardware
To easy data collection, it was decided to use an integrated circuit dedicated to energy measurement applications, Cirrus Logic CS5463, responsible for obtaining the values of various electrical measurements. This made the work easier, as the measurement algorithms are in hardware. In addition to that, they were tested and had an accuracy established and guaranteed by the manufacturer. The CS5463 is an IC com- posed of two ADC converters – one for voltage and one for current, besides a calculation unit, which calculates several electrical quantities. This IC communicates with the development board using the SPI protocol. For the use of this IC (CS5463) and the modularization of the project, a printed circuit board was developed following the model of the technical sheet found on the Cirrus Logic website [17]. Fig. 5 shows the diagram of the developed circuit board. The JP1 and JP2 components form a socket, which easy the connection of the IC to the board. The TC and TP components represent the connections of the sensors (terminals), connected to the conditioning circuits (voltage dividers that reduce the input voltage to a maximum of 250mV RMS), passive filters, and the IC connections.
Fig. 5. Schematic diagram of the proposed prototype.
The other representations are connecting pins and pins for IC calibration. JP6 and JP7 components are connected to the pins corresponding to the SPI input of the embedded system. The hardware developed and used consists of the following items:
• Cirrus Logic CS5463 integrated circuit, two conditioning circuits for adjusting the sensor voltage to the IC input values, and interface connectors between the sensors and the board; • 28-pin SMD / DIP adapter; • Intel Edison with Arduino kit; • Base shield; • 16×2 RGB LCD; • Potential transformer (PT) 127 / 220V to 12 + 12V, as a voltage sensor; • Current transformer (CT) SCT-013-000, as a current sensor; • Connection jumpers.
Software
The software developed for the prototype implements the architecture shown above, and it focused on two parts:
• The first part consisted of the implementation of the measurement routines, which took into account the measurement and loading functions. For this, it was needed to use the SPI protocols, for the communication between Intel Edison and CS5463, the I2C protocol, for the communication with the display, and the MQTT protocol – for the WEB communication used to update the dashboard information.
• The second part consisted of implementing user views, where the dashboard was developed. The first part used the Python language in conjunction with several libraries, mainly the MRAA library, which controls the GPIO ports of the card and allows the portability of the software to various hardware on the market and the paho.mqtt library that implements the MQTT client used to send data to the dashboard.
In the flowchart (Fig. 6) on the right, all the necessary steps to measure an electrical quantity are detailed, where it is needed to perform: IC configuration, sending initialization commands and after that, it starts to receive the chip data, which will ultimately need to convert and apply the necessary scales.
In the flowchart (Fig. 6), on the left of the figure, the steps necessary to perform the consumption calculation are detailed according to the white tariff model – power measurement, energy consumption calculation, and application of the white tariff rules (questions related to the day of the week and times ).
The second part consisted of implementing the dashboard. To facilitate the design, a free template built-in Bootstrap [https://getbootstrap.com/] and Highcharts [https://www.highcharts.com/] – used to generate the graphics were used. The functioning of the dashboard consists of receiving the information from the MQTT protocol and presenting it to the user.
Experimental Results
As an initial test, to prove that the developed firmware is functional, it was decided to measure and analyze the error in the current and voltage measurements obtained in different electrical equipment. It was decided this way because current and voltage are the fundamental quantities and the other quantities use these values in the internal calculation of the IC.
To perform the tests, it was needed to perform the calibration steps described in the IC datasheet [17]. This is necessary to obtain the precision described by the manufacturer. Also, there was a need to adjust the conversion scales of the software, once the IC did not present the values directly, but in scale. The test performed was in accordance with the following methodology:
• The prototype smart meter and a set of multimeters configured as ammeter and voltmeter were connected;
• A set of electrical equipment was chosen, in this case: – Amazon Alexa (15 W); – Cellphone Charger (10 W); – Incandescent Lamp (25 W); – Electric Citrus Juicer (250 W); – Led Lamp (9 W); – Computer Monitor (15 W); – Notebook Power Adapter (45 W); – TV (120 W); – Fan ( 80 W).
• One device was turned on at a time and the data obtained from the prototype meter was collected, 5000 samples of each equipment were used (Voltage, Current, Active Power, Apparent Power, Reactive Power, Frequency and Power Factor) and the average was calculated to obtain the values presented in Table 2;
• The data obtained by the prototype were compared with the data obtained by the multimeters and a subsequent calculation of the agreement between the types of data was performed in Table 1.
Fig. 6. Diagram of the Developed Software.
Table 1. Comparison between multimeter and proposed smart meter.
.
Table 2. Proposed smart meter collected data
.
Discussion
By analyzing the table above, it is possible to infer an accuracy above 90% in all the test cases, demonstrating that the data are within an acceptable range. As it is an initial prototype and as there is no need to use test methodologies that are used in commercial products, standardized by INMETRO (Brazilian Metrology Institute), these values are acceptable for this research. The voltage data reached an accuracy close to that described in the datasheet (+/-0.1%), indicating a good fit. Current data achieved an accuracy above 90%, but there is room for improvement during the calibration step aiming at reaching a value close to that indicated in the datasheet. The main objective of this experiment was achieved, as it indicates a good working of the measurement algorithm. In future work, two interesting paths to be followed are: to improve the calibration step – especially in the current part – and carry out measurements at the site’s energy input to have a general value for the installation.
Conclusion
This article presented the scenario of smart grids in Brazil and in the World, contextualizing the importance of the development of the open source smart meter proposed prototype. Concerning the prototype, it was possible to implement several concepts of Smart Meters.
The goal of creating a low-cost prototype was achieved, as equipment costs were below US $50. Another interesting point is that through the implementation of AMI, and consequently the massification of smart meters, a new market will emerge that will be based on the information obtained by smart meters, where there will be many opportunities for the creation of innovative services.
Finally, smart meters can bring new economic and technological opportunities and, mainly, bring investments to modernize electrical systems, bringing more sustainability and awareness about the use of electric energy. For future work, we will extend the research with: first, collect more data about many electrical devices using a low- cost smart meter; second, training a CNN to identify connected electrical devices; third, create a recommendation system for smart home environments.
Acknowledgements This work was supported by funding from FAPESP (Grant 2017/26421-3).
REFERENCES
[1] Y. Wang, Q. Chen, T. Hong, and C. Kang, “Review of smart meter data analytics: Applications, methodologies, and challenges,” IEEE Transactions on Smart Grid, vol. 10, no. 3, pp. 3125–3148, 2018. [2] B. Yildiz, J. I. Bilbao, J. Dore, and A. B. Sproul, “Recent advances in the analysis of residential electricity consumption and applications of smart meter data,” Applied Energy, vol. 208, pp. 402–427, 2017. [3] M. R. Asghar, G. Dán, D. Miorandi, and I. Chlamtac, “Smart meter data privacy: A survey,” IEEE Communications Surveys & Tutorials, vol. 19, no. 4, pp. 2820–2835, 2017. [4] Y. Kabalci, “A survey on smart metering and smart grid communication,” Renewable and Sustainable Energy Reviews, vol. 57, pp. 302–318, 2016. [5] E. A. Bueno, W. Utubey, and R. R. Hostt, “Evaluating the effect of the white tariff on a distribution expansion project in brazil,” in 2013 IEEE PES Conference on Innovative Smart Grid Technologies (ISGT Latin America). IEEE, 2013, pp. 1–8. [6] D. Vieira, R. A. Shayani, and M. G. De Oliveira, “Net metering in brazil: Regulation, opportunities and challenges,” IEEE Latin America Transactions, vol. 14, no. 8, pp. 3687–3694, 2016. [7] M. P. Maceira, L. A. Terry, F. S. Costa, J. M. Damázio, and A. Melo, “Chain of optimization models for setting the energy dispatch and spot price in the brazilian system,” in Proceedings of the power system computation conference-PSCC, vol. 2, 2002, pp. 24–28. [8] Y. Yan, Y. Qian, H. Sharif, and D. Tipper, “A survey on smart grid communication infrastructures: Motivations, requirements and challenges,” IEEE communications surveys & tutorials, vol. 15, no. 1, pp. 5–20, 2012. [9] H. Farhangi, “The path of the smart grid,” IEEE power and energy magazine, vol. 8, no. 1, pp. 18–28, 2009. [10] P. Carvalho, “Smart metering deployment in brazil,” Energy Procedia, vol. 83, pp. 360–369, 2015. [11] S. M. Amin and B. F. Wollenberg, “Toward a smart grid: power delivery for the 21st century,” IEEE power and energy magazine, vol. 3, no. 5, pp. 34–41, 2005. [12] S. S. S. R. Depuru, L. Wang, V. Devabhaktuni, and N. Gudi, “Smart meters for power grid—challenges, issues, advantages and status,” in 2011 IEEE/PES Power Systems Conference and Exposition. IEEE, 2011, pp. 1–7. [13] K. G. Di Santo, E. Kanashiro, S. G. Di Santo, and M. A. Saidel, “A review on smart grids and experiences in brazil,” Renewable and Sustainable Energy Reviews, vol. 52, pp. 1072–1082, 2015. [14] V. C. Gungor, D. Sahin, T. Kocak, S. Ergut, C. Buccella, C. Cecati, and G. P. Hancke, “Smart grid technologies: Communica- tion technologies and standards,” IEEE transactions on Indus- trial informatics, vol. 7, no. 4, pp. 529–539, 2011. [15] E.-A.-U. An, “Smart meters and smart meter systems: A metering industry perspective,” Washington, DC, USA, Edison Elect. Inst., White Paper, 2011. [16] R. R. Mohassel, A. Fung, F. Mohammadi, and K. Raahemifar, “A survey on advanced metering infrastructure,” International Journal of Electrical Power & Energy Systems, vol. 63, pp. 473–484, 2014. [17] C. Logic, “C55463: Single phase, bi-directional power/energy ic,” Datasheet DS678F2, Apr, 2008
Authors: Rafael Givanildo, M. Sc. Denis Lima, M. Sc. Paulo Paris Prof. Dr. Emerson Pedrino, Computer Science Depart- ment, Federal University of Sao Carlos, SP., Brazil, email: emerson@dc.ufscar.br.
Source & Publisher Item Identifier: PRZEGLĄD ELEKTROTECHNICZNY, ISSN 0033-2097, R. 97 NR 9/2021. doi:10.15199/48.2021.09.16
Published by Electrotek Concepts, Inc., PQSoft Case Study: Industrial Facility IEEE Std. 519 Compliance Evaluation, Document ID: PQS1015, Date: October 15, 2010.
Abstract: This case study presents an industrial facility IEEE Std. 519 harmonic compliance evaluation. The analysis included frequency response and harmonic distortion simulations for a substation and a single industrial customer with a number of lower voltage power factor correction capacitor banks. The analysis included IEEE Std. 519 compliance calculations for various system contingencies. The mitigation alterative applied included a shunt passive harmonic filter which reduced voltage distortion levels below the specified limitations.
INTRODUCTION
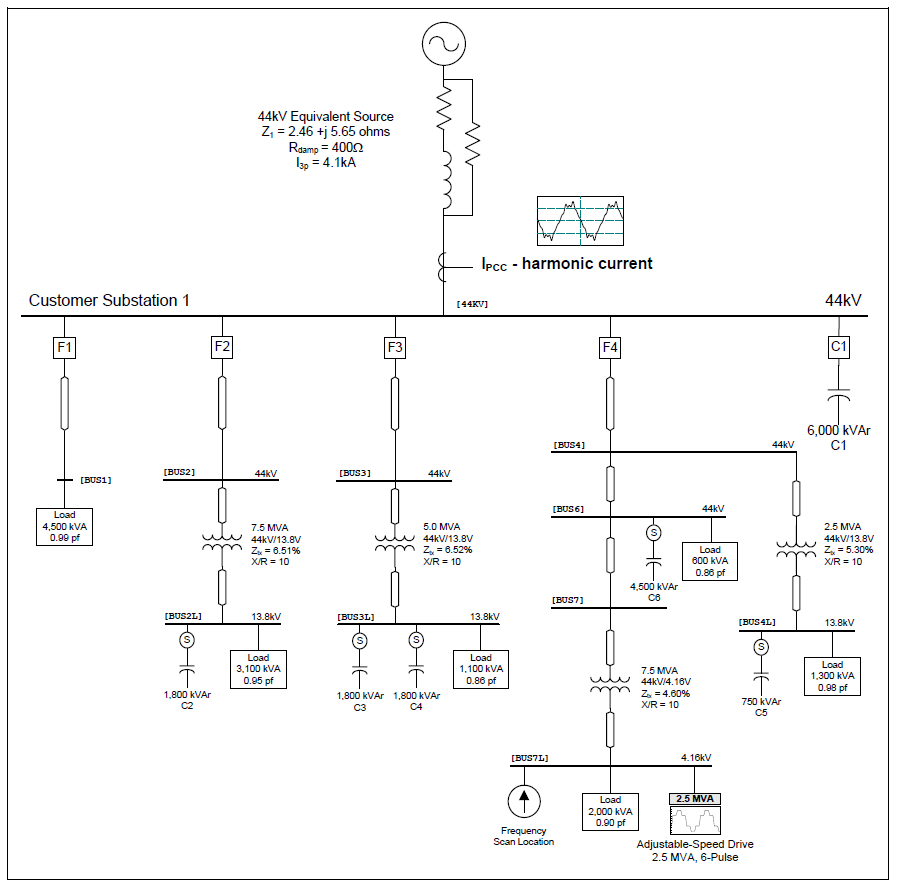
An industrial facility IEEE Std. 519 harmonic compliance case study was completed for the system shown in Figure 1. The 44 kV utility substation supplied a number of step-down transformers in a plastic extrusion facility. The facility included a number of utility and customer power factor correction capacitor banks and a 2.5 MVA, six-pulse adjustable-speed drive. The utility capacitor bank at the substation bus was rated 6,000 kVAr, 44 kV and there were also several 1,800 kVAr, 13.8 kV capacitor banks connected to various customer secondary buses.
The harmonic characteristics of the drive was determined from field measurements. The case study was completed using the SuperHarm® program. The accuracy of the simulation model was verified using three-phase fault currents and other steady-state quantities, such as steady-state voltage rise.
Figure 1 – Illustration of Oneline Diagram for Harmonic Compliance Evaluation
SIMULATION RESULTS
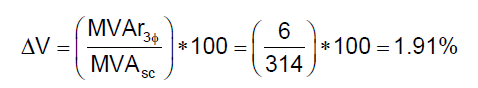
Fault currents at various points in the facility and the voltage rise at 44 kV substation bus with the 6,000 kVAr capacitor bank in-service were used to verify the accuracy of the harmonic simulation model. The simulated steady-state voltage rise at the substation bus with the 6,000 kVAr, 44 kV capacitor bank in service was approximately 1.8%. This value was validated using the following expression:
.
where: ΔV = steady-state voltage rise (per-unit) MVA3Φ = three-phase short circuit capacity (MVA = √3*44 kV*4.12kA≈314MVA) MVAr3Φ = three-phase capacitor bank rating (MVAr)
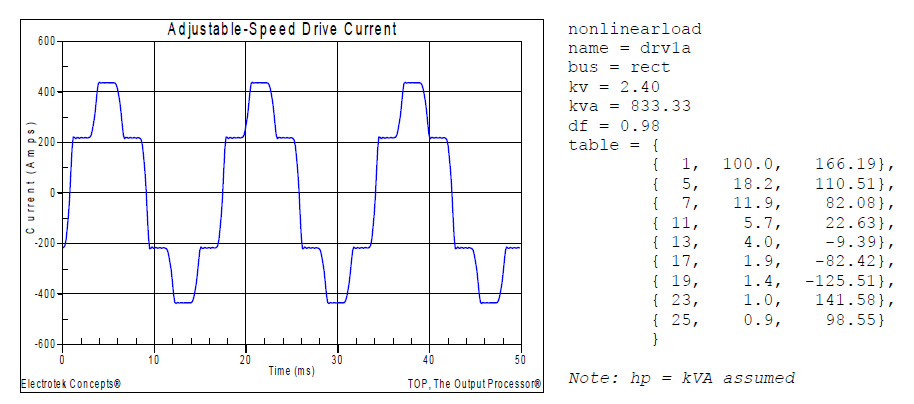
Figure 2 shows the simulated harmonic current characteristic for 2.5 MVA, 4.16 kV six-pulse adjustable speed drive. The current had a fundamental frequency value of 293 A, an rms value of 301 A, and a THD value of 23.1%. The highest harmonic current components were the 5th at 18.2% and the 7th at 11.9%. The waveform shown was created using an inverse DFT with 256 points per cycle.
Figure 2 – Customer Adjustable-Speed Drive Current Waveform and Spectrum
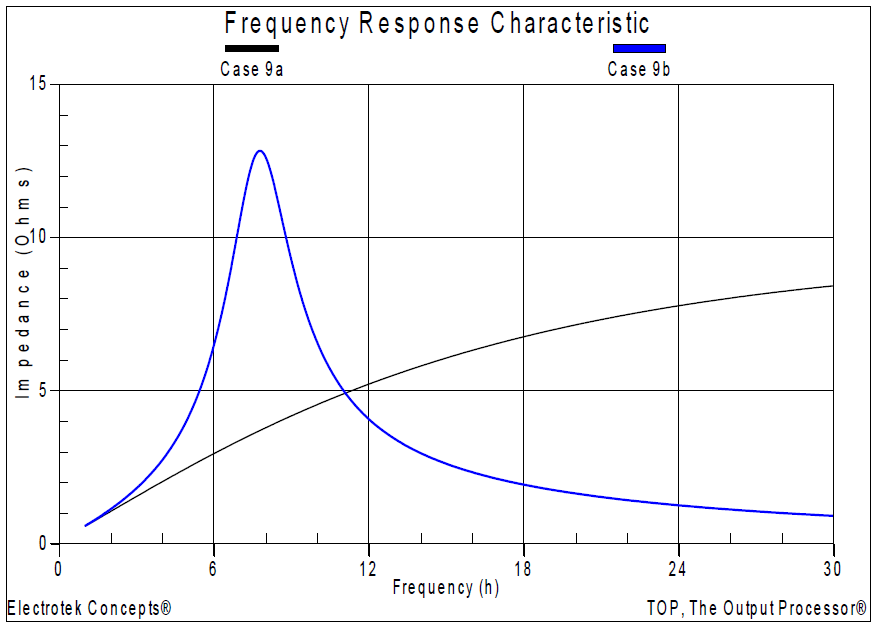
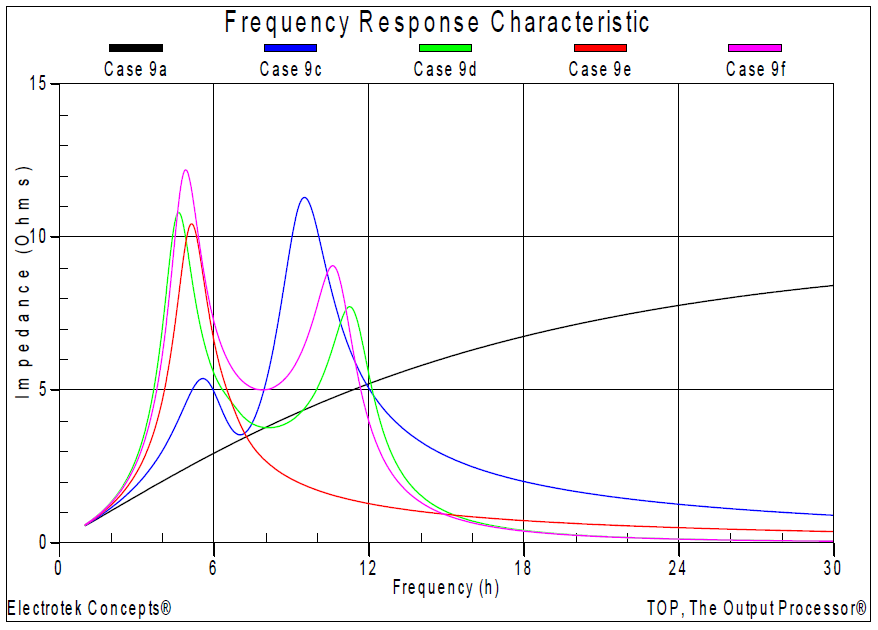
A thorough investigation of the effect of various substation and customer capacitor banks was completed using a batch solution capability that allowed multiple data cases to be completed consecutively. Different distinct frequency scan and harmonic distortion output files were created for each set of system conditions. The batch solution involved 64 different cases, representing all of the possible substation and customer capacitor bank switching conditions. The frequency scan and harmonic distortion results for each of the cases were reviewed to determine the number of cases where the IEEE Std. 519 total demand distortion (TDD) limits were exceeded. Twenty of the 64 cases exceeded the current distortion limits. Results from six of the 64 cases were used to summarize a number of the relevant observations. Figure 3 shows the impedance vs. frequency simulation result with the 6,000 kVAr, 44 kV substation capacitor bank (C1) in service (Case 9b). The frequency scan was placed at the 4.16 kV bus and the resulting impedance at the 44 kV bus was determined. The basecase result with no utility or customer capacitor banks in-service (Case 9a) was also shown on the graph so the two conditions can be easily compared. The simulated parallel resonance due to the addition of the shunt capacitor bank was 468 Hz (7.8th harmonic).
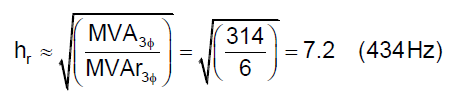
A simple expression was used to validate this result:
.
where: hr = parallel resonant frequency (x fundamental) MVA3Φ = three-phase short circuit capacity (MVA = √3*44kV*4.12kA≈314MVA) MVAr3Φ = three-phase capacitor bank rating (MVAr)
Figure 4 shows the impedance vs. frequency simulation results for various substation and customer capacitor bank configurations. The base case result with no utility or customer capacitor banks in-service was also shown for reference. The most significant harmonic resonance frequencies were the 5th and 9th.
Figure 3 – Illustration of Frequency Response with Substation Capacitor Bank In-Service
Figure 4 – Illustration of Frequency Response with Various Capacitor Banks In-Service
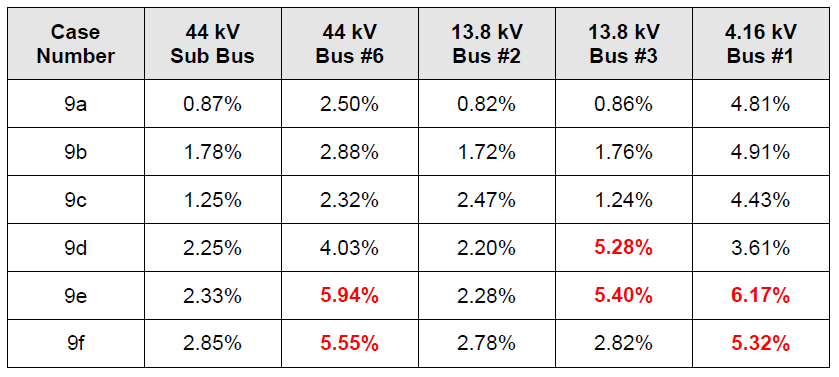
Table 1 summarizes the results for the six corresponding harmonic distortion simulations. The table includes the simulated voltage distortion (VTHD) levels at five buses for the six different operating conditions previously summarized in Figure 3 and Figure 4. The voltage distortion at several locations exceeded the IEEE Std. 519 limit of 5% for several cases.
Table 1 – Summary of the Simulated Voltage Distortion Results
.
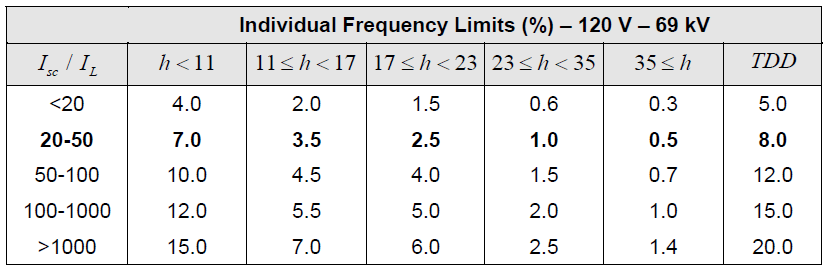
Table 2 shows the harmonic currents limits from IEEE Std. 519 that may be used for industrial customers. The ratio of the short-circuit MVA at the point of common coupling (PCC) to the average maximum demand load was approximately 20.8 (314 MVA / 15,100 kVA). That meant that the second row of the table was used to evaluate the harmonic currents at the PCC for the six different operating conditions.
Table 2 – IEEE Std. 519 Current Limits for Utility Customers
.
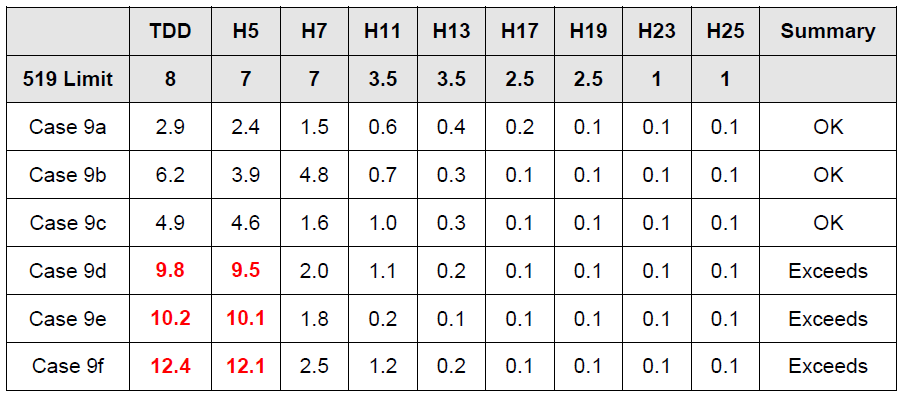
Table 3 summarizes the results of the harmonic current compliance analysis for the six simulated cases. Three of the cases shown in the table exceed the 5th harmonic and TDD current limits. The capacitor banks that were in-service for each simulation case included:
Case 9a: No Capacitor Banks (basecase condition) Case 9b: 6,000 kVAr C1 Case 9c: 6,000 kVAr C1, 1,800 kVAr C2 Case 9d: 6,000 kVAr C1, 1,800 kVAr C3, 4,500 kVAr C6 Case 9e: 1,800 kVAr C4, 4,500 kVAr C6 Case 9f: 6,000 kVAr C1, 4,500 kVAr C6
Table 3 – Summary of Harmonic Current Limit Compliance
.
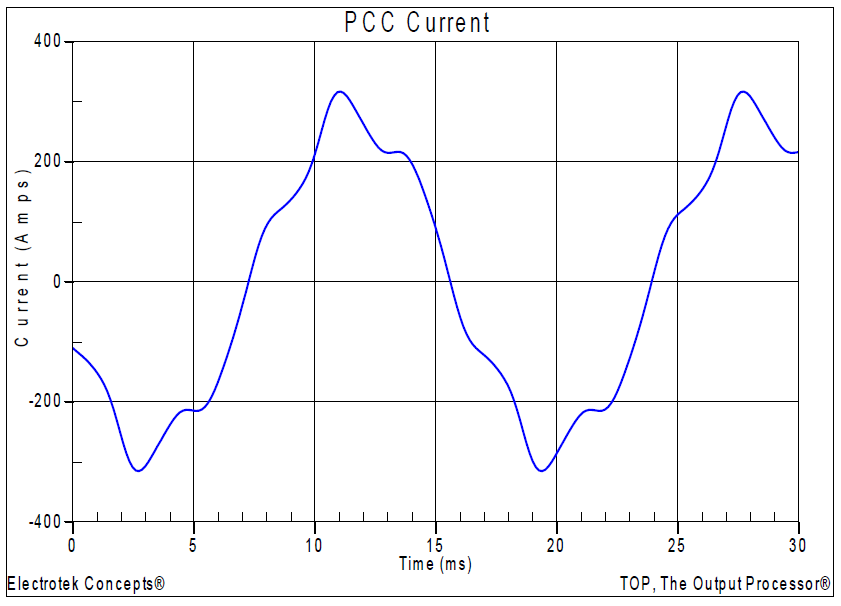
Figure 5 – Simulation Results for Worst Case Current Distortion
Figure 5 shows the corresponding simulated PCC current waveform (12.4% THD) for Case 9f. The waveform was created using an inverse DFT with 256 points per cycle.
The power conditioning solution alternative that was investigated during the study was adding a new passive shunt single-tuned harmonic filter on the 4.16 kV customer bus with the 2.5 MVA adjustable speed drive. Passive filters are made of inductive, capacitive, and resistive elements. They are relatively inexpensive compared with other means for eliminating harmonic distortion, but they have the disadvantage of potentially adverse interactions with the power system. They are employed either to shunt the harmonic currents off the line or to block their flow between parts of the system by tuning the elements to create a resonance at a selected harmonic frequency.
Filters are generally tuned slightly below the harmonic frequency of concern. This method allows for tolerances in the filter components and prevents the filter from acting as a direct short circuit for the offending harmonic current. It also minimizes the possibility of dangerous harmonic resonance should the system parameters change and cause the tuning frequency to shift slightly higher. The design involved adding a new 1,200 kVAr, 4.16 kV harmonic filter at the customer bus with the nonlinear load. The filter was tuned to the 4.7th harmonic, with an assumed X/R ratio of 20.
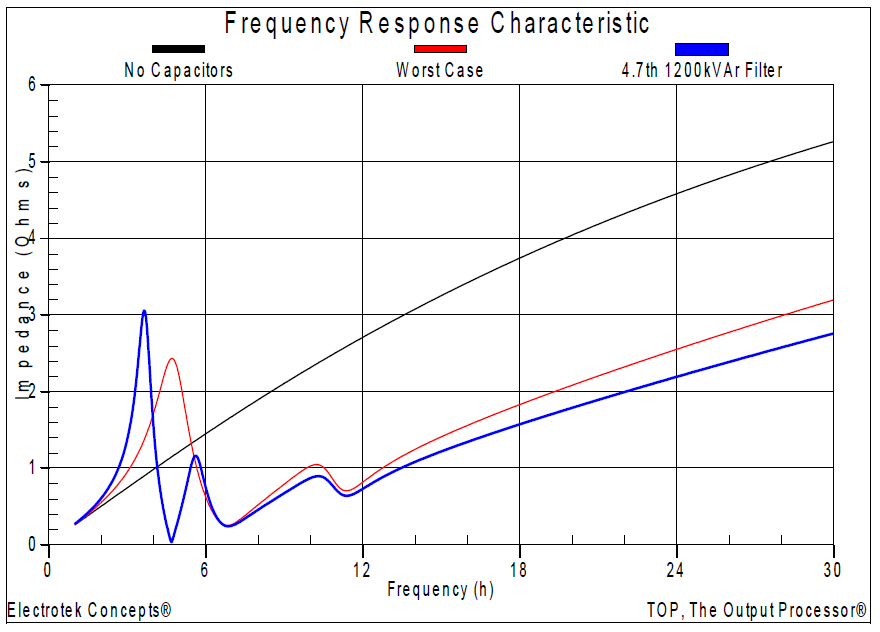
Figure 6 shows the impedance vs. frequency simulation result at the 4.16 kV bus with the 4.7th harmonic filter in-service. The previous worst-case frequency scan and the basecase with no utility or customer capacitor banks in-service was shown for reference. As can be observed in the figure, the frequency response characteristic shows a very low impedance at the filter tuning frequency.
Figure 6 – Illustration of Frequency Response with Feeder Harmonic Filter In-Service
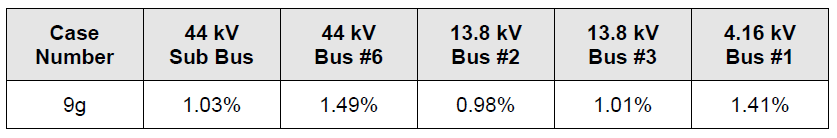
Table 4 summarizes the results for the corresponding harmonic distortion simulation. The table includes the simulated voltage distortion (VTHD) levels at the five buses for the harmonic filter mitigation case (Case 9g) previously shown in Figure 6. The resulting voltage distortion levels at all of the simulated buses were well below the IEEE Std. 519 limit of 5%.
Table 4 – Summary of the Simulated Voltage Distortion Results with Filter In-Service
.
Table 5 summarizes the results of the harmonic current compliance analysis for the harmonic filter mitigation simulation case (Case 9g). None of the values shown in the table exceed the 5th harmonic or TDD current limits. The capacitor and harmonic filter banks that were in-service for the simulation case included:
Case 9g: 6,000 kVAr C1, 4,500 kVAr C6, and 1,200 kVAr 4.7th Filter at 4.16 kV Bus
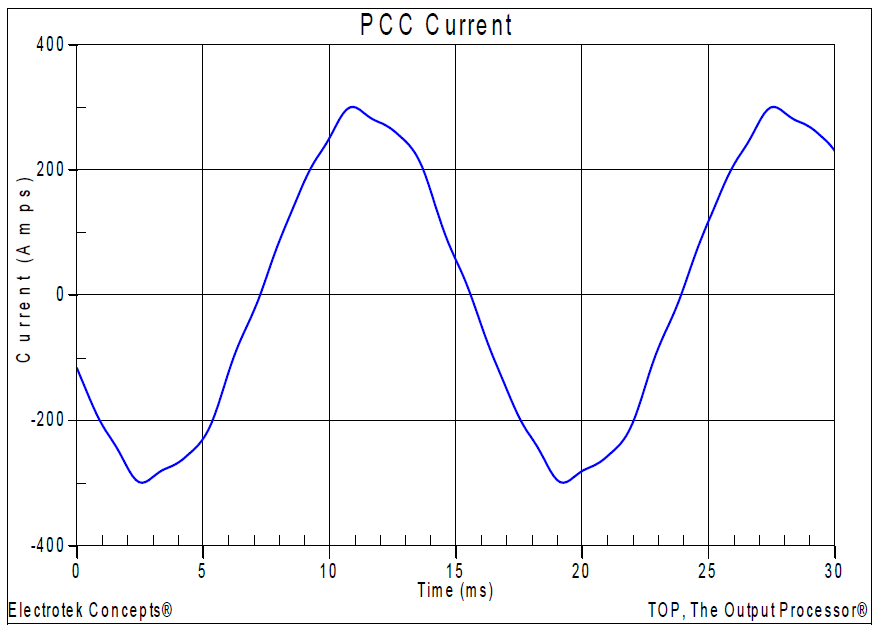
Figure 7 shows the corresponding simulated PCC current waveform (3.2% THD) for Case 9g. The waveform was created using an inverse DFT with 256 points per cycle.
Table 5 – Summary of Harmonic Current Limit Compliance with Filter In-Service
.
Figure 7 – Simulation Results with Harmonic Filter Mitigation
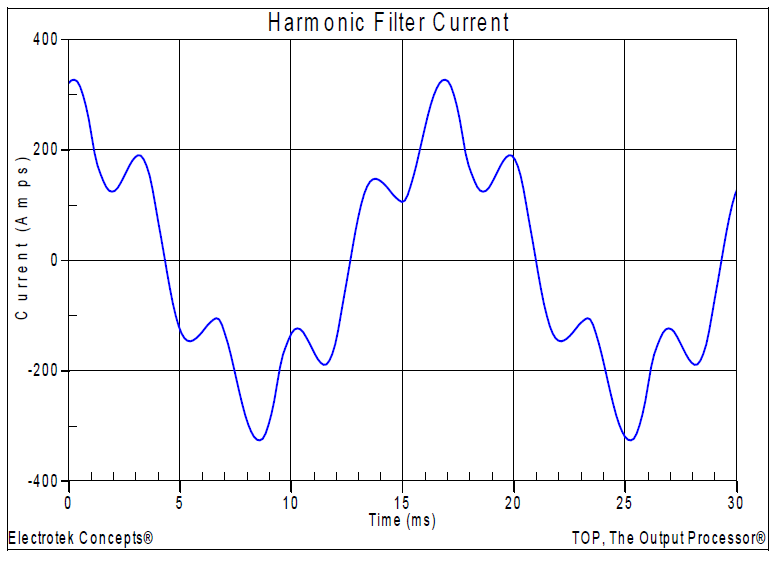
Figure 8 shows the resulting harmonic filter current for the simulation case. The current had a fundamental frequency value of 175 A, an rms value of 184 A, and a THD value of 32.4%. The highest harmonic current components were the 5th at 32.2% and the 7th at 2.08%. The waveform shown in Figure 8 was created using an inverse DFT with 256 points per cycle.
Passive harmonic filters should always be placed on a bus where the short-circuit impedance (XSC) can be expected to remain relatively constant. While the notch frequency is determined by the filter tuning, and will remain fixed, the new parallel resonance will move as the system short circuit impedance varies.
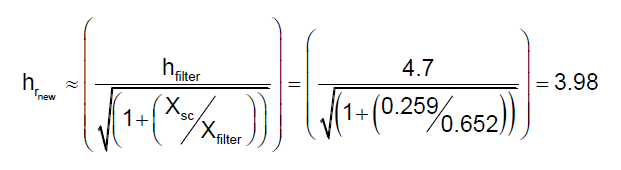
The resulting simulated new parallel resonant frequency with the harmonic filter in-service was approximately 3.7, which was verified using the following expression:
.
where: hrnew = resulting (new) parallel resonant frequency (x fundamental) hfilter = harmonic filter tuning frequency (x fundamental) XSC = system short circuit reactance
Figure 8 – Illustration of Harmonic Filter Current
The power conditioning mitigation alterative selected was to install a new 1,200 kVAr, 4.16 kV harmonic filter hank tuned to the 4.7th harmonic which, in turn, reduced the harmonic voltage distortion levels below the specified limits., as well as meeting the current distortion limits specified in IEEE Std. 519. Due to the excessive component duty requirements, the capacitor bank units that were used in the shunt harmonic filter design were rated at 4.8 kV for application on the 4.16 kV customer secondary bus.
SUMMARY
The case study summarized an industrial facility IEEE Std. 519 harmonic compliance evaluation. The analysis included frequency response and harmonic distortion simulations for a 44 kV substation and a single industrial customer with a number of lower voltage power factor correction capacitor banks. The case also included IEEE Std. 519 compliance calculations for various system contingencies. The mitigation alterative applied included a shunt passive harmonic filter which reduced voltage distortion levels below the specified limitations.
REFERENCES
1. IEEE Recommended Practice for Monitoring Electric Power Quality,” IEEE Std. 1159-1995, IEEE, October 1995, ISBN: 1-55937-549-3. 2. IEEE Recommended Practices and Requirements for Harmonic Control in Electrical Power Systems, IEEE Std. 519-1992, IEEE, ISBN: 1-5593-7239-7. 3. R.C. Dugan, M.F. McGranaghan, S. Santoso, H.W. Beaty, “Electrical Power Systems Quality,” McGraw-Hill Companies, Inc., November 2002, ISBN 0-07-138622-X.
Published by Parandhaman BALAMURUGAN1, Natarajan SENTHIL KUMAR1, Vellore Institute of Technology (1),Chennai, Tamilnadu, India
Abstract. Hardware implementation of Shunt Active Power Filter (SAPF) to regulate harmonics in the grid current is presented in this work. Dead-beat controller is employed to regulate the harmonics injected by SAPF using Spartan-6 FPGA processor. The effectiveness of the control strategy is tested under different operating conditions through MATLAB simulations and experimental approach to reduce the grid current harmonics and to meet the IEEE519:2014 recommendations for harmonic regulation guidelines, at the Point-of-Common-Coupling(PCC).
Streszczenie. Zaprezentowano bocznikowy filtr aktywny zaprojektowany do redukcji harmonicznych w sieci. Sterownik typu dead-beat jest zastosowany wstrzykiwania pra˛du z wykorzystaniem procesora Spartan-6 FPGA. Zbadano efektywnos´c´ sterownia w róz˙nych warunkach pracy przy spełnieniu rekomendacji IEEE519:2014. (Aktywny filtr bocznikowy wykorzystuja˛cy sterownik typu dead-beat do redukcji harmonicznych)
Keywords: Shunt active power filter, dead-beat control, harmonic compensation, PCC, THD, FPGA Słowa kluczowe: bocznikowy filtr aktywny, redukcja harmonicznych, sterownik dead-beat
Introduction
The load on the existing power system network keeps on changing in both magnitude and v-i characteristics. The dynamic nature of the load magnitude leads to fluctuations in the system voltage. These fluctuations in the voltage magnitude are characterized based on the voltage magnitude variation and its duration viz., sag, swell, under voltage, over voltage etc.
Now-a-days, the magnitudes of nonlinear loads have increased due to the advancements in the field of semiconductor technology and power converters. Due to this the electric power network is subjected to various issues like harmonics, distortion, increased losses, increased temperature rise in the connected equipment and transmission line. This results in reduced life time of the equipment, poor efficiency, frequent failure, malfunctioning of sensitive load equipment, life-saving equipment and various process in the industries etc. These nonlinear loads, draw non-sinusoidal current from the utility grid through transmission and distribution network. These non-sinusoidal currents flowing in the AC system develops a non-sinusoidal voltage drop across the transmission line reactance. The net voltage at the load terminals is sinusoidal voltage from the utility grid minus non-sinusoidal drop across the transmission line reactance. Thus, voltage distortion is introduced into the power system. This distorted voltage when applied to a linear load, it draws non-sinusoidal current from the supply. Hence the amount of harmonics injected into the power system is increased [1].
Several strategies have been formulated to limit the harmonic voltages/currents in the power system network so as to increase its reliability. Initially properly designed passive filters are installed in the system so as to limit the harmonic propagation in the power network at suitable locations. But due to development of sophisticated electronic devices and equipment which draws nonlinear current from the supply mains, the nature of harmonic currents is unpredictable. Hence the provision of previously installed passive filters can no longer work properly to limit the harmonics. Also, other problems associated with passive filters like increased size, cost, inflexible in operation, and resonance at harmonic frequencies limits the application of passive filters.
In order to provide flexibility in harmonic control and due to the development of high-speed computers/controllers and the development of fast switching power devices, control of harmonics with greater flexibility and dynamic control is made possible. Also, developments in the field of sensors and signal processing techniques, more versatile controllers evolved. Hence, active power filters are developed and applied in several applications where power rating ranges from few watts to several Megawatt [2] – [5].
In this paper, the necessity of harmonic filtering, its type and functionality in regulating harmonic levels in the power network is carried out. The performance of the controllers, its implementation and requirements are stated based on the realization in simulation environment. A prototype convincing the theoretical aspect was developed and tested in the laboratory environment. The importance of the work is vital in this time so as to move on to the new generation of control strategies with reduced sensors and signal conditioning circuits.
The organization of the paper is as follows: Section1 gives overview about the harmonic generation and compensation necessity pertaining to power system in various scale. the principle of current harmonic compensation using SAPF. The principle of harmonic extraction is discussed in section 2 giving the user, a guideline to select the compensation power under different operating environment. The theory of compensating current generation is discussed in section 3. MATLAB simulations and results were presented in section 4 and section 5 demonstrates the hardware implementation of the SAPF and its control with results. In section6, the results were analysed and discussed.
Principle of Harmonic Compensation
The principle of current compensation is shown in Fig.1. At PCC, Kirchhoff’s law yields is = iL + if . The current drawn by the nonlinear load is non-sinusoidal. The load current can be resolved using Fourier series to sum of infinite sinusoids whose frequencies are integer multiples of supply frequency. The instantaneous load current (iL) is the sum of instantaneous fundamental component (iL1) and instantaneous harmonic components(iLh). If the filter current is equal to the harmonic component of the load current, then the instantaneous source current (is) is equal to the instantaneous fundamental component of load current.
The compensation of iLh results in harmonic free source current at fixed power factor. If unity power factor is desired, then along with iLh, component corresponding to reactive power must also supplied by the compensator. The compensation strategies with pq-theory employed is constant instantaneous power control strategy ensuring unity power factor.
SAPF is used as shunt compensator to compensate for current harmonics. SAPF is installed at PCC in power network where the system parameters are accessible by both utility and the customer.
Fig. 1. Principle of harmonic compensation
The power circuit of a typical SAPF is shown in Fig.2. It consists of a voltage source converter (VSC) with capacitor powered DC link, interfacing filter (Lf ) and a filter controller. The filter controller plays a vital role in the working of VSC as APF. The filter controller senses the utility voltage and load current continuously. The data acquisition system in the filter controller processes the voltage and current signals to compute the harmonic currents that has to be generated by the VSC. Also, the controller regulates the DC link voltage constant throughout its operation. The computed currents are compared with the actual current output of the filter and passed on to the controller to generate the gating signals for the VSC in order to minimize the tracking error. The VSC upon gating by the filter controller generates the desired harmonic current which is filtered for switching frequency harmonics by a small passive filter provided between the output of VSC and PCC of the utility grid [6],[7]. Harmonics of any order can be compensated by appropriately selecting the compensating powers and generating the current reference. Several strategies are available in literature for the generation of harmonic current references from the distorted voltages and currents.
Fig. 2. VSC as shunt active power filter
The current tracking is effected by shunt active filter controller adopting suitable control strategy from literature [8] – [13]. The function of the controller is to minimize the tracking error by its controlling action and to generate appropriate gating signal for the VSC. Based on the error magnitude, the duty ratio of the gating signal is adjusted by the controller. The role of controller is hence vital in these applications.
Computation of Harmonics
Akagi. H [14] developed a new theory for computing instantaneous real and reactive powers in a power system (pq – theory). It is based on Clarke’s transformation of instantaneous voltages (v) and currents (i) in the power system. The transformation is aimed to convert a set of time varying space varying phasors in to two orthogonal components and a zero-sequence component like in symmetrical component transformation. The pq-theory is valid for all conditions like the system voltages balanced or unbalanced, distorted or undistorted, transient or in steady-state in three phase system with or without neutral conductor.
Without change in power, the Clarke’s transformation of instantaneous voltages and currents are governed by equation (1).
.
The instantaneous real power (p) and reactive power (q) is calculated in the transformed domain as in equation (2).
.
It is observed that the instantaneous powers in (2) comprises of two components namely average and oscillating components as represented in equation (3).
.
The components of power include both fundamental and harmonic powers. The average and oscillating components of power are separated from the computed power by a higher order Butterworth low-pass filter with a cut-off frequency around the supply frequency. The compensating currents for the SAPF are computed from equation (3) after separating the average and oscillating components. The currents are calculated as in equation (4).
.
The compensation currents calculated using equation (4) cannot be used directly and must be transformed back to the time domain using inverse Clarke’s transformation dictated by equation (5).
.
The currents computed using equation (5) is used as the reference current for the SAPF.
Simulation of shunt active power filter
The simulation model of SAPF is developed in MATLAB/ Simulink environment. The conditions chosen for simulations are balanced nonlinear load, balanced non-linear load with balanced linear load, unbalanced nonlinear load. The source voltage is assumed to be distortion free throughout the simulation. The complete simulation model of SAPF is shown in Fig. 3. The parameters used for the simulation are listed in Table 1.
Fig. 3. MATLAB/Simulink implementation of SAPF
Table1: Simulation Parameters of the system under study
.
The simulation results include waveforms of the source voltage, source current, injected filter currents, calculated reference currents, dc-link capacitor voltage and percentage harmonic distortion variation in source current are shown in Fig.4. The source voltage is measured with respect to neutral in Fig.4a. At time t=0, the filter remains in ‘OFF’ state. The capacitor in the dc link is charged through the anti-parallel diodes of VSC switches.
A large source current spike in Fig.4b is due to the capacitor charging. The source current drawn by the load is non-sinusoidal with peak current of 6.9 A and the THD of 22.75%. Initially the filter is ‘OFF’ and hence the injected current is zero. At t = 0.2s, the filter is turned ‘ON’ the capacitor voltage is regulated to set reference voltage of 700V, and the filter is injecting harmonic current in quadrature to the load current at PCC. As a result, the source current become sinusoidal with a peak of 7.49A with THD of 3.92% less than the limits specified by IEEE519:2014. The dc-link voltage is regulated by PI-controller whose output is measured as real power required to main the capacitor voltage constant. To emphasis the dynamic operating condition, an additional load is switched ‘ON’ at t = 0.4s and the corresponding source and injected filter currents are also shown in Fig.4b – 4c. Similarly, at t = 0.6s another single-phase diode bridge rectifier load is turned ‘ON’ creating unbalance. It is observed that the source current is still maintained by SAPF as balanced sinusoidal. The injected filter currents are shown in Fig.4d and the dc-link voltage in 4e. The compensation is achieved in less than half cycle period of supply voltage.
Fig. 5. Harmonic spectrum of source current (a) Before compensation (b) After compensation (c) After step load change (d) After unbalance
The harmonic spectrum of source current computed before and after compensation for different operating conditions is illustrated in Fig.5 . It signifies that the dominant lower order harmonics of 5th and 7th, 11th and 13th order harmonics in the source currents in Fig.5a are eliminated by SAPF. The spectrum of source current in Fig.5b – 5d signifies that these harmonics are suppressed due to the filtering action.
Hardware implementation of SAPF
The proposed control strategy for SAPF was implemented in hardware. The prototype is tested for reduced voltage and power level in the laboratory environment for validating the principle of harmonic compensation. The VSC employs Semikron IGBT Inverter module (SKM300GB126D), gated by IGBT SKHI10/12 driver. The pulses are isolated by means of on-board isolation transformer and has in-built short circuit and overvoltage protection.
Filter controller is implemented with Spartan6 FPGAXC6slx25t processor. Essential voltage and current sensing circuits with signal conditioning circuits were designed and implemented. FPGA processes the measured source voltages, source current, load current and filter current through its analog input port. The analog input is equipped with bipolar analog-to-digital converter (ADC) to translate the analog signal into digital word to the FPGA processor[15]- [17]. The processor computes the power drawn from the source by the nonlinear load in αβ0domain. The dc-link is provided with two split capacitors in series, which enables SAPF to compensate for both three-phase three wire or four wire loads with neutral point clamping. The DC link voltage is monitored using LV25P voltage sensor and is compared with the reference dc-link voltage in order to maintain the dc-link voltage constant. This enables compensation feasible by the SAPF. PI controller regulates the dc-link voltage of VSC constant around set value of 375V. The FPGA processor generates the reference currents according to equation (4). The experimental setup of the SAPF is shown in Fig.6. The detailed specifications of the experimental setup are provided in table 2.
Fig. 6. Experimental setup of SAPF
The measurements are taken with Fluke 435B power quality analyser and Agilent MSO7014B 4-channel MSO. The ac line voltages are sensed using potential transformers and current sensors with bipolar output are employed for current measurements. Tektronix current clamps are used for current measurements with Fluke and MSO. The performance of the SAPF was tested for the operating conditions like balanced nonlinear load, balanced nonlinear and linear load, and single phasing operation.
Table2: Parameters of SAPF hardware
.
0.1 Case 1: Balanced nonlinear load
In this case, a three-phase diode bridge rectifier feeding 2 kW resistive load is considered. The supply voltage in the lab environment has a THD of 5.5% at 110V RMS per phase with 3rd and 7th harmonics as significant. The diode bridge current is continuous and the load is shared among all three-phases at the source. The source current is non-sinusoidal with a THD of 25.1%. The dc-link voltage is maintained at 375V. The response of the SAPF, source voltage, source current, load current and filter currents before and after compensation were shown in Fig.7a – 7d measured with MSO. It is observed that the compensation is effective and hence the source current is sinusoidal and in-phase with the source voltage thereby attaining unity power factor operation at the source end. The dynamic response of dc-link voltage is shown in Fig.7e. it shows the variation in dc-link voltage when the filter is switched ‘ON’, for step increase in load and for step decrease in load. The dc voltage is PI regulated and hence the dynamic response will be much faster.
Fig. 7. Response of SAPF (a)Three phase source voltages
Fig. 7. Response of SAPF (b)Source voltage, source current, load current, filter current
Fig. 7. Response of SAPF (c) Source voltage and current in Phase A before compensation
Fig. 7. Response of SAPF (d) Source voltage and current in phase A after compensation
Fig. 7. Response of SAPF (e) Dynamic response of dc-link controller in SAPF
The measurements of current and voltage harmonics, power and power factor are carried out with Fluke 435B power quality analyser. The measurements of power analyser are shown in Fig.8a – 8h measuring the source voltage, current, power, power factor and harmonics. The load current shows an THD of 23.9% with 5th, 7th, 11th and 13th order harmonics as significant. After compensation, the net active is increased to 2.2kW at 0.99 power factor (lag) with significant reduction in THD to 3.5%.
Fig. 8. Case1: Performance of SAPF with balanced nonlinear loads, (a) – (d)
Fig. 8. Case1: Performance of SAPF with balanced nonlinear loads, (e) – (h)
0.2 Balanced nonlinear and linear loads
In this case, a three-phase 1hp induction motor is connected in parallel to the three-phase bridge rectifier load. The source current harmonics are now limited to 6.8% and the currents are sinusoidal as in Fig.9c. But the power factor at the source is reduced to 0.79 lag due to the induction motor. In this case, the SAPF is now forced to deliver the reactive power so as to improve the power factor at the source. The effect of diode bridge rectifier is partially offset by the induction motor load. The measurements from power analyser are shown in Fig.9a – 9h.
Fig. 9. Case 2: Performance of SAPF with balanced nonlinear and linear loads
0.3 Single-Phasing Operation
Single phasing refers to the condition of one phase open at the source/load end. With the nonlinear diode bridge, the single phasing initiated by opening the phase B. This results in three phase diode bridge to work as a single-phase bridge rectifier feeding a resistive load. The source current is still distortion free, but not balanced. The power exchange happens between the two phases leading to poor power factor at the source. The SAPF compensate for the unbalance and improves the power factor at the source end. The measurements of power analyser are shown in Fig.10a – 10h measuring the source voltage, current, power, power factor and harmonics.
Fig. 10. Case 3: Performance of SAPF under single phasing operation
The system acts as a two-phase network with neutral isolated, one of the two phases provide return path for the current and hence the current in both the phases are equal and 180 degree out of phase. The current in third phase is zero as shown in figure 10a. in this case, the THD is less than 5% (Fig.10e) but it introduces unbalance in the source current resulting in negative sequence components. The negative sequence must be suppressed in the source. Hence SAPF generates compensating currents that will make the three phase currents in the source to be balanced sinusoidal as in Fig.10b. The load is distributed in all three phases and hence source currents in the conducting phases are reduced to 1.5A/Ph from 2.3A/ph. The THD in source current is now 1.7% and power factor of 0.99 is achieved.
Conclusion
SAPF with deadbeat control was implemented and tested through simulation and experimental setup. The performance of SAPF is tested for different loading conditions on the grid. The results obtained through simulation are verified functionally with hardware prototype for the operating conditions considered in simulation. The experimental results proves the feasibility of the control in regulating the harmonics in grid current over wide range of load conditions. The objective of near unity power factor and grid current harmonics less than 5% were achieved. The results were presented both pictorial and with numerical values with suitable measurement arrangements with power analyzer. The controller is easier to implement and flexible to modify to achieve the desired performance.
REFERENCES
[1] Singh B.:Active power line conditioners for power quality improvement -A prospective, Journal of the Indian Institute of Science, 77 (1997) No. 6, 627–639 [2] Lin B. R., Member S., Wei, T. C. : A Novel NPC Inverter for Harmonics Elimination and Reactive Power Compensation, IEEE Transactions on Power Delivery, 19 (2004) No. 3, 1449–1456 [3] Luo A., Shuai Z., Zhu W., Shen Z. J., Member S.: Combined System for Harmonic Suppression and Reactive Power Compensation, IEEE Transactions on Industrial Electronics, 56(2009) No. 2, 418-428 [4] Marek Gala., Andrzej Jaderko.: Assessment of the impact of the micro wind turbine on the power quality in the distribution network. PRZEGLA˛D ELEKTROTECHNICZNY , (2019) No. 1, 33–36 [5] Moulahoum S., Houassine H., Kabache N.: Parallel active filter to eliminate harmonics generated by compact fluorescent lamps, 21st Mediterranean Conference on Control and Automation, MED 2013 – Conference Proceedings, 143–148 [6] Vodyakho O., Mi C. C.: Three-Level Inverter-Based Shunt Active Power Filter in Three-Phase Three-Wire and Four-Wire Systems, IEEE Transactions on Power Electronics, 24(2008) No. 5,1350–1363 [7] Lee, H. H. : Versatile shunt hybrid power filter to simultaneously compensate harmonic currents and reactive power, Journal of Electrical Engineering and Technology, 10(2015) No. 3, 1311–1318 [8] Salmeron P., Litran SP. : A control strategy for hybrid power filter to compensate four-wires three-phase systems, IEEE Transactions on Power Electronics, 25(2010) No. 7, 1923– 1931 [9] Bojoi R. I., Limongi L. R., Roiu D., Tenconi A.: Enhanced power quality control strategy for single-phase inverters in distributed generation systems, IEEE Transactions on Power Electronics, 26(2011) No. 3, 798–806 [10] Ricardo L., Ribeiro D. A., Azevedo C. C. De, Sousa, R. M. De.: A Robust Adaptive Control Strategy of Active Power Filters for Power-Factor Correction, Harmonic Compensation, and Balancing of Nonlinear Loads, IEEE Transactions on Power Electronics, 27 (2012) No. 2, 718–730 [11] Trinh Q.N., Lee H.H. : An Advanced Current Control Strategy for Three-Phase Shunt Active Power Filters, IEEE Transactions on Industrial Electronics, 60(2013) No. 12, 5400–5410 [12] Chen Q., Yuan R., Deng X., Guo P., Xiao Z. : Shunt active power filter with enhanced dynamic performance using novel control strategy, IET Power Electronics, 7(2014) No. 12, 420–428 [13] Hamad M. S., Masoud M. I., Member S., Ahmed K. H., Williams B. W.: A Shunt Active Power Filter for a Medium-Voltage 12-Pulse Current Source Converter Using Open Loop Control Compensation, IEEE Transactions on Industrial Electronics, 61(2014) No. 11, 5840–5850 [14] Akagi H.: New Trends in Active Filter for Power Conditioning, IEEE Transactions on Industry Applications, 32 (1996) No. 6, 1312-1322 [15] Rodr P., Candela J. I., Luna A., .: Current Harmonics Cancellation in Three-Phase Four-Wire Systems by Using a Four-Branch Star Filtering Topology, IEEE Transactions on Power Electronics, 24(2009) No. 8, 1939-1950 [16] Shah M. C., Chauhan S. K., Tekwani P. N., Tiwari R. R. : Analysis, design and digital implementation of a shunt active power filter with different schemes of reference current generation., IET Power Electronics, 7(2014) No. 3, 627-639 [17] Dash S. K., Panda G., Ray P. K., Pujari S. S.: Realization of active power filter based on indirect current control algorithm using Xilinx system generator for harmonic elimination, IEEE Transactions on Electrical Power and Energy Systems, 74 (2016), 420-428
Authors: (Ph.D.) Parandhaman Balamurugan, Assistant Professor (Sr. Gr.), Ph.D. Natarajan Senthilkumar, Associate Professor, School of Electrical Engineering, Vellore Institute of Technology, Chennai Campus, Vandalur – Kelambakkam Road, Tamil Nadu, India – 600 127 email: balamurugan.p@vit.ac.in; senthilkumar.nataraj@vit.ac.in
Source & Publisher Item Identifier: PRZEGLA˛D ELEKTROTECHNICZNY, ISSN 0033-2097, R. 95 NR 12/2019. doi:10.15199/48.2019.12.04
Published by Jose Mendi, EE Power – Technical Articles: Power Quality Monitoring Part 2: Design Considerations for a Standards-Compliant Power Quality Meter, May 18, 2023.
This article explains how to efficiently design a standards-compliant power quality measurement instrument using a ready-to-use platform that accelerates development. It discusses solutions for designing Class A and Class S meters, including a new Class S power quality measurement integrated solution that significantly reduces development time and costs for power quality monitoring products. Part 1 discussed the importance of standards-compliant power quality measurements to provide an understanding of the IEC power quality standard and its parameters.
Part 1 in this series discussed the importance of standards-compliant power quality measurements to provide an understanding of the IEC power quality standard and its parameters. Part 2 explains how to efficiently design a standards-compliant power quality measurement instrument using a ready-to-use platform that accelerates development.
Challenges to Implementing a Power Quality Solution
The basic components of an instrument designed for power quality measurement are shown in Figure 1. First, the current and voltage transducers must account for the operational range of the instrument and adapt the input signal to the dynamics of the analog-to-digital converter (ADC) input. Traditional transducers are the first source of uncertainty in the measurement; therefore, the correct selection is of great importance. Next, the signal goes to an ADC; its individual characteristics, such as offset, gain, and nonlinearity errors, create a second source of uncertainty. Selecting the correct ADC for this function is a demanding effort in designing a power-quality instrument. Finally, a series of signal processing algorithms must be produced to get electrical and power quality measurements from the input signals.
Figure 1. The main components of an instrument for power quality measurements. Image used courtesy of Bodo’s Power Systems [PDF]
Table 1. Accuracy Requirements for Current, Voltage, and Power Measurements Specified by IEC 61000-4-7 Standard
.
Voltage and Current Transducers
Depending on the location and application of the power quality instrument, the nominal supply voltage (UNOM), nominal current (INOM), and frequency vary. Independently of the nominal values that the instrument measures, the IEC 61000-4-7 standard requires power quality measurement instruments to reach the accuracies presented in Table 1; therefore, the transducers must be selected such that the instrument fulfills the accuracy requirements.
INOM: Nominal current range of the measurement instrument
UNOM: Nominal voltage range of the measurement instrument
UM, IM, and PM: Measured values
The IEC61000-4-71 standard recommends designing the input circuitry following these nominal voltages (UNOM) and nominal currents (INOM):
▸ For 50 Hz systems: 66 V, 115 V, 230 V, 400 V, 690 V
▸ For 60 Hz systems: 69 V, 120 V, 240 V, 277 V, 347 V, 480 V, 600 V
▸ 0.1 A, 0.2 A, 0.5 A, 1 A, 2 A, 5 A, 10 A, 20 A, 50 A, 100 A
Additionally, the transducers selected for measuring voltage and current must keep their characteristics and accuracy unchanged when a 1.2× UNOM and INOM are applied continuously. A signal four times the nominal voltage or 1 kV rms, whichever is less, applied for 1 second to the instrument must not lead to any damage. Likewise, a 10× INOM current for 1 second shall not produce any damage.
Analog-to-Digital Converter
Even though the IEC 61000-4-30 standard does not specify a minimum requirement for sampling rate, the ADC must have enough sampling rate to measure some oscillatory and fast power quality phenomena. An insufficient sampling rate could result in the misclassification of a power quality event or the failure to detect one. The IEC 61000-4-30 standard states that the instrument voltage and current sensors should be appropriate for up to 9 kHz. Thus, the sampling frequency of the ADC must be selected following the rules of signal analysis to perform a measurement of frequency components up to 9 kHz included. Figure 2 illustrates the consequences of when the sampling rate is not sufficient. The top left waveform contains 64 samples per 10 cycles (200 ms), and the top right waveform has 1024 samples per 10 cycles. As shown in Figure 2, the top left graph shows a voltage dip event, while the top right graph shows that the dip is transiently induced.
The IEC standard applies to single-phase and three-phase systems; therefore, the selected ADC must be able to sample the required number of voltage and current channels simultaneously. Having measurements for all the voltage and current channels on the instrument at the same time allows all parameters to be examined and immediately triggered when a power quality event occurs.
Digital Signal Processing
Even though selecting the transducers and ADC for power-quality measurements requires a comprehensive engineering effort, developing the algorithms for processing the raw ADC measurements is undoubtedly the task that demands most of the time and resources to make a power-quality instrument. To implement a standard compliant instrument, the right digital signal processing (DSP) hardware must be chosen, and the algorithms to calculate the power quality parameters from the waveform samples have to be developed and properly tested. The standard not only requires calculations but also different time-dependent aggregations with time accuracies less than ±1 seconds per 24-hour period for Class A and ±5 seconds per 24-hour period for Class S. These algorithms must perform harmonic analysis. Additionally, power quality parameters rely on fast Fourier transform (FFT) analysis (harmonics, inter harmonics, mains signaling voltage, unbalance), which is challenging to implement. The FFT analysis requires the waveforms to be sampled at 1024 samples per 200 ms (10 cycles) minimum. Performing resampling of the raw waveforms from the ADC to the required rate requires care to avoid harmonic distortion and aliasing.
Figure 2. ADC sampling rate effect on power quality measures. Image used courtesy of Bodo’s Power Systems [PDF]
Figure 3. Block diagram: relevant functions of a DSP power quality system. Image used courtesy of Bodo’s Power Systems [PDF]
After the algorithms are developed, the IEC standard requires a comprehensive list of more than 400 tests that the instrument must pass to be fully certified. Figure 3 shows a block diagram with the most relevant functions a DSP system needs for producing power quality measurements.
Analog Devices Power Quality Measurements Solutions
Multichannel Simultaneous Sampling ADCs for IEC 61000-4-30 Class A
Considering the accuracy, number of channels, and sampling rate requirements to develop a Class A PQ instrument, the AD777x and AD7606x family of products are recommended for the ADC conversion of the signal chain/system. Note that these solutions provide just the raw digitized data from the input signals. A DSP system must be developed to get certified PQ measurements.
AD777x Family Sigma-Delta ADC
The AD777x is an 8-channel, 24-bit simultaneous sampling ADC family of devices. Eight full sigma-delta (∑-Δ) ADCs are on-chip providing sampling rates of 16 kSPS/32 kSPS/128 kSPS. The AD777x provides a low input current to allow direct sensor connection. Each input channel has a programmable gain stage allowing gains of 1, 2, 4, and 8 to map lower amplitude sensor outputs into the full-scale ADC input range, maximizing the dynamic range of the signal chain. The AD777x accepts a VREF voltage from 1 V up to 3.6 V and an analog input range: 0 V to 2.5 V or ±1.25 V. The analog inputs can be configured to accept true differential, pseudo-differential, or single-ended signals to match different sensor output configurations. A sample rate converter is provided to allow fine resolution control over the AD7770, and it can be used in applications where the ODR resolution is required to maintain coherency with 0.01 Hz changes in the line frequency. The AD777x also provides a large signal input bandwidth of 5 kHz (AD7771 10 kHz). Data output and SPI communications interfaces are provided, although the SPI can also be configured to output the sigma-delta conversion data. The temperature range is from –40°C to +105°C, functional up to +125°C with a power supply of 3.3 V or ±1.65 V.
Figure 4 shows a 3-phase typical applications system diagram for the AD777x family of ADCs for a PQ instrument using current transformers as current transducers and resistor dividers for voltage.
AD7606x Family 16-/18-Bit ADC Data Acquisition System
The AD7606x provides a 16-/18-bit, simultaneous sampling, analog-to-digital data acquisition system (DAS) with eight channels. Each channel contains analog input clamp protection, a programmable gain amplifier (PGA), a low-pass filter, and a 16-/18-bit successive approximation register (SAR) ADC. The AD7606x also contains a flexible digital filter, low drift, 2.5 V precision reference and reference buffer to drive the ADC, and flexible parallel and serial interfaces.
The AD7606B operates from a single 5 V supply and accommodates ±10 V, ±5 V, and ±2.5 V true bipolar input ranges when sampling at throughput rates of 800 kSPS (AD7606B)/1 MSPS (AD7606C) for all channels. The input clamp protection tolerates different voltages with user-selectable analog input ranges (±20 V, ±12.5 V, ±10 V, ±5 V, and ±2.5 V). The AD7606x requires a single 5 V analog supply. The single-supply operation, on-chip filtering, and high input impedance eliminate the need for external driver op amps, which require bipolar supplies.
In software mode, the following advanced features are available:
• Additional oversampling (OS) options, up to OS × 256 • System gain, system offset, and system phase calibration per channel • Analog input open circuit detector • Diagnostic multiplexer • Monitoring functions: SPI invalid read/write, cyclic redundancy check (CRC), overvoltage and undervoltage events, busy stuck monitor, and reset detection.
Figure 4 shows a 3-phase typical applications system diagram for the AD7606x family of ADCs for a power quality instrument using current transformers as current transducers and resistor dividers for voltage.
Figure 4. A power quality 3-phase applications system diagram for the AD777X and AD7606x families of ADCs. Image used courtesy of Bodo’s Power Systems [PDF]
Analog Devices Precertified IEC Class S Power Quality Solution
The ADE9430, a highly accurate, fully integrated, polyphase energy metering IC combined with the ADSW-PQ-CLS software library running on a host microcontroller, is a complete solution that is IEC 61000-4-30 Class S standard compliant. This integration significantly reduces the development time and costs for PQ monitoring products. The ADE9430 + ADSW-PQ-CLS solution simplifies the implementation and certification of energy and PQ monitoring systems by providing a tight integration of acquisition and calculation engines. Figure 5 shows a 3-phase applications system diagram for the ADE9430 + ADSW-PQ-CLS solution for a power quality instrument using current transformers as current transducers and resistor dividers for voltage.
ADE9430 Class S Power Quality Analog Front End
With seven input channels, the ADE9430 can be used on a 3-phase system or up to three single-phase systems. It supports current transformers (CTs) or Rogowski coils with an external analog integrator for current measurements. It provides an integrated analog front end for power quality monitoring and energy measurement. The ADE9430 is pin-compatible with the ADE9000 and ADE9078 with equivalent analog and metrology performance. Its features include:
• Seven high-performance 24-bit sigma-delta ADCs • 101 dB SNR • Wide input voltage range: ±1 V, 707 mV rms, full-scale at gain = 1 • Differential inputs • Class 0.2 accuracy metrology • One cycle rms, line frequency, zero crossing, advanced metrology • Waveform buffer •Continuous resampled data: 1024 points per 10/12 line cycle • Advanced metrology covering 50 Hz and 60 Hz fundamental frequencies • Support of active energy standards: IEC 62053-21 and IEC 62053-22; EN 50470-3 OIML R46; and ANSI C12.20 • Support of reactive energy standards: IEC 62053-23, IEC 62053-24 • A high-speed communication port: 20 MHz serial port interface (SPI)
ADSW-PQ-CLS Software Library
The ADSW-PQ-CLS software library is designed specifically to be integrated with the ADE9430 to generate standard compliant IEC 61000-4-30 Class S PQ measurements. It implements all parameters defined in IEC 61000-4-30 for Class S instruments. Users can decide which PQ parameters to use. This library needs low CPU/ RAM resources and is core/OS agnostic (Arm® Cortex®-M minimum). Supported MCU architectures include Arm Cortex-M0, Cortex-MO+, Cortex-M1, Cortex-M3, and Cortex-M4. For distribution to end users, the library is provided as a CMSIS-PACK file (.pack) compatible with Keil Microvision, IAR Embedded Workbench version 8.x, or Analog Devices CrossCore® Embedded Studio. The license for the software library is included with the purchase of the ADE9430. A PC serial command line interface (CLI) example is provided to evaluate the library and its features. Figure 6 shows how PQ parameters are displayed by this CLI.
Figure 5. An ADE9430 and ADSW-PQ-CLS PQ 3-phase system diagram. Image used courtesy of Bodo’s Power Systems [PDF]Figure 6. ADSW-PQ-CLS software library serial CLI interface. Image used courtesy of Bodo’s Power Systems [PDF]
ADE9xxx Family Power Quality Features Summary
Table 2. Energy and Power Quality features of the ADE9xxx Family of Energy Metering ICs; Class S Value Indicates Feature Is Standards Compliant with IEC 61000-4-30 Class S
.
.
.
ADE9430 Evaluation Kit
The EVAL-ADE9430ARDZ enables quick evaluation and prototyping of energy and Class S power quality measurement systems with the ADE9430 and the ADSW-PQ-CLS Power Quality Library. The power quality library and application example are provided to simplify the implementation of larger systems. This kit provides a plug-and-play type of experience that is easy to use to test the power quality parameters of a 3-phase electrical system.
The kit has the following hardware features:
▸ Current transformer inputs
▸ High voltage/current inputs
▸ 240 V rms nominal (with potential divider)
▸ 80 A rms max (with provided CT sensors)
▸ 2.5 kV isolation
▸ On-board RTC to timestamp measurements
▸ Precertified for IEC 61000-4-30 Class S (requires the user to calibrate)
▸ ADSW-PQ-CLS library and example application running on Arm Cortex-M4 MCU
▸ Serial CLI to PC for configuration and logging of power quality parameters
Figure 7. shows the connections required to use the EVAL-ADE9430ARDZ with a PC.
The EVAL-ADE9430ARDZ consists of a PCB with four current and three voltages + neutral input connectors and on-board ADE9430, isolators, a real-time clock, a Cortex-M4 STM NUCLEO-413ZH development board with an example application of the ADSW-PQ-CLS library, and three current sensors.
Figure 7. A diagram of the EVAL-ADE9430ARDZ connected to a PC. Image used courtesy of Bodo’s Power Systems [PDF]
Designing Standards-Compliant Power Quality Meters Summary
The ADE9430 + ADSW-PQ-CLS solution has been certified to accurately measure power quality parameters following the requirements of the IEC 61000-4-30 Class S standard.
Designing a standards-compliant power quality meter is a challenging task. To reduce the time and engineering resources needed to produce an IEC 61000-4-30 Class S standard-compliant PQ measurement instrument, the ADE9430 + ADSW-PQ-CLS is a complete go-to solution that enables designers with a ready-to-use platform to accelerate development and solve for many critical design challenges.
References
1. “IEC 61000-4-30:2015: Electromagnetic Compatibility (EMC)-Part 4-30: Testing and Measurement Techniques-Power Quality Measurement Methods.” International Electrotechnical Commission, February 2015.
This article originally appeared in Bodo’s Power Systems [PDF] magazine
Author: Jose Mendia has a B.Sc. in electronics and computer science engineering and joined the Energy and Industrial System Group at Analog Devices in 2016. Currently, he is a senior engineer in product applications at the Edinburgh UK design center.
Published by João Reis, Department of Economics, Management, Industrial Engineering and Tourism, GOVCOPP, Aveiro University, Campus Universitário de Santiago, 3810-193, Aveiro, Portugal. Email: reis.joao@ua.pt
Abstract: In the last years, most European countries have developed strategies to implement the use of electric vehicles. This paper uses a qualitative case study research in the automotive industry to evaluate the efficiencies concerning the implementation of the first electric light truck produced for public services. The results indicate that electric light trucks in public services are more efficient, economically reliable and contribute to the reduction of carbon dioxide emissions. Moreover, the strategy of using these vehicles is suitable for nocturnal collection of urban waste, to the extent that it reduces the daily traffic and, at the same time, drastically reduces the noise caused by diesel engines during night hours, thus, improving the quality of life on residential areas. By investing on such strategy, European governments are giving a step further to accomplish the European Commission requirements, which is stimulated by the reduction of the carbon dioxide footprint.
Keywords: electric vehicles; electric light trucks; case study; renewable energies; carbon dioxide; efficiency; public services.
1. Introduction
Vehicles moved by renewable energies are urgently needed in Lisbon, Portugal, due to the requirements imposed by the European Commission to reduce the carbon dioxide emissions, but also to decrease the economic impact of regular activities, e.g., the collection of urban wastes. However, the implementation of electric vehicles is not straightforward, although electric vehicles are commercially available, they are still not welcomed by most users mainly because of battery limitations (Høyer, 2008). The high prices of electric vehicles (EVs) are attributed to their expensive green components, as the battery is typically the most expensive component, which almost takes up 30–40% of the entire production cost of these vehicles (Fu et al., 2018). Therefore, a study conducted by Delang and Cheng (2013) has revealed that citizens from China, one of the most developed economies, recognise the positive environmental, economic and social benefits that electric vehicles bring but the aforementioned citizens also prefer not to purchase these vehicles due to the high costs. According to several studies (Black, 2000; Delucchi and Lipman, 2001; Weinert et al., 2008) the price of electric cars is higher than the internal combustion engine vehicles (ICEVs), again due to the high cost of the batteries, large investment involved on the research and the small numbers of electric vehicles that are still produced. However, these limitations are not consensual. An example of this is the United States (USA), where Xie et al. (2018) claim that the promotion of these electric vehicles is considered an effective solution helping the country reducing its dependency on imported oil and also allows to improve its competitive position in the emerging era of the renewable energy market. The empirical evidence of such strategy is visible by the sales of Nissan Leaf and the plug-in hybrid Chevy Volt of General Motors, which were introduced in the US market (Fu et al., 2018).
The electric vehicles in public services are a relevant discussion theme, well-noticed by the increasing of sales and production, which has aroused the interest of the academic community. This interest is also verified by the increasing promotion of special issues on hot topics, such as, alternative fuel vehicles (AFVs) or electric vehicle batteries, in order to build and promote scientific breakthroughs. Some of these examples are from top tier journals, that have recently opened call for proposals: (1) the Journal of Transportation Research Part D, has opened recently a call for paper with the topic “Advances in Alternative Fuel Vehicles”; and/or the (2) the Journal of Energy Storage, with the special issue “Second Life of Electric Vehicle Batteries in Stationary Applications”.
Currently, all major foreign manufacturers and suppliers have located themselves in China during the last few years, alongside a large number of Chinese automotive manufacturers, and are already focusing their sourcing in particular on global markets (Proff, 2012). However, some manufacturers are changing this tendency, as an international corporation, responsible for the commercialisation of electric vehicles i.e. full electric-powered light trucks, started the production at the original equipment manufacturer (OEM) in Portugal. Currently, the Portuguese OEM is producing electric light trucks called eTruck, which will become relevant to the Portuguese economy, since that country is going to export these vehicles worldwide and allows to expand market shares despite the increasing Chinese competition. The corporation has recently started the project in six cities around the world, which are: Lisbon, London, Berlin, Amsterdam, New York and Tokyo. Lisbon municipality has acquired 10 units for public services purposes (e.g., collection of urban waste) before acquiring a larger volume of units. At this time, the eTruck is a pre-series production vehicle, which is expected to achieve the full production and availability to the markets in 2019–2020 to embrace sustainable and reliable transport solutions.
Motivated by the above, this study focuses on the urban waste collection in Lisbon, due to its exponential increase in tourism in the last years. Consequently, the municipality has been facing an accelerated growth of urban waste. By studying the pros and cons a question remains: Are the electric light-duty trucks a reliable alternative to public services?
This paper is structured as follows: first, the author has reviewed the literature by presenting the state of the art; second, the author describes the methodological approach; third, it discusses the results regarding the studied real-life phenomenon; finally, it provides conclusions, implications and suggestions for future research.
2. Literature review
This section addresses the theoretical background, which the author considers essential to understand the phenomenon.
2.1 The scope of electric vehicles
In the West, the ambiguous term electric vehicles (EVs) is commonly used and mostly associated with battery EVs (BEVs) (Chen and Midler, 2016). The EVs are classified into three major categories by their fuel consumption technology: hybrid electric vehicles (HEVs), plug-in hybrid electric vehicles (PHEVs) and battery electric vehicles (BEVs), while both PHEVs and BEVs are also referred to as plug-in electric vehicles (PEVs), since they are designed to be recharged by plugging into the power grid (Zhu et al., 2018). Hence, Hybrids (HEVs) are vehicles with an electric drive system and an internal combustion engine running on either petrol or diesel (Milowski et al., 2018), while PHEVs are vehicles equipped with at least two energy sources to propel them (Xu et al., 2018), usually by combining electric and conventional propulsion (Plötz et al., 2018) and BEVs are considered vehicles that operate on batteries that have a limited life as well as specific charging and discharging patterns (Pelletier et al., 2017). In short, the new generation electric vehicles (EVs) are likely to become increasingly popular for city travellers and are expected to feature prominently in ‘Smart Cities’ of the future (Milowski et al., 2018). Although there are other conceptualisations, Mahmoudi et al. (2014) corroborates the earlier definitions and argues in favour of a broader classification, accordingly the degree of electrification (Figure 1).
Figure 1. Degree of electrification
Mahmoudi et al. (2014) defines each degree as:
BEV, uses high capacity batteries and electric motor for propulsion
HEV uses mechanically a combination of electric motor (EM) in low speeds dedicated for in-city traffic and a conventional internal combustion engine (ICE) for use outside urban areas
REEV are range extended electric vehicles, which are vehicles in which the propulsion is driven only by an electric motor powered by high capacity batteries
FCEV (fuel cell electric vehicle) introduced to perform long distances because it uses a fuel cell system to power its on-board electric motor
SEV are solar electric vehicles, which are directly or complementarily powered by direct solar energy.
Similar to other research papers (e.g., Chen and Midler, 2016), the author of this paper ended up on focusing on the EVs, namely the BEVs. He did not consider other fuel sources, such as the fuel cell EVs (FCEVs), due to the low maturity of this technology and its demanding supporting infrastructure in terms of cost, when compared with BEVs. According to Bansal (2005), the EVs have a much longer history than most people realise, since this technology was mentioned soon after Joseph Henry introduced the first DC-powered motor in 1830 and the first known first electric car was a small model built by Professor Stratingh in the Dutch town of Groningen in 1935 (Bansal, 2005). Bansal (2005) also states that, the first EV was built by in 1834 by Thomas Davenport in the USA, but there were no rechargeable electric cells batteries at that time, the EV did not become a viable option until the Frenchmen Gaston Plante and Camile Faure respectively invented and improved the storage battery.
2.2 The strategic implementation of electric vehicles
In the last years the urban transport has raised specific issues and brought attention to political, social and environmental prejudice of pollution, noise and stress (Racicovschi et al., 2007; Schiffer and Walther, 2018). Racicovschi et al. (2007) stressed that, the European Union (EU) is encouraging scientific and technological research activities to develop clean and efficient transport, mainly by incorporating limits to greenhouse effect with efficient solutions as the EVs. In addition, some EU countries are encouraging a sustainable market for EVs, by combining high taxes on high emissions and zero tax for zero emissions vehicles (ZEVs). Due to this practice, Norway has the highest number of electric vehicles per capita in the world by achieving in January 40,000 electric vehicles in a country of 5 million inhabitants (Haugneland and Hauge, 2015).
Although emissions do result from fossil fuelled generation of electricity, these emissions are removed in both space and time from the point of operation of a EV (Santini, 2011). In Portugal, the Portuguese Association of Renewable Energies (APREN) argue that, from January to August 2018, renewable energy sources have played a leading role in the electricity production, contributing with 55.3% to the total electricity generated (37,451 Gigawatt hours).
The results from Figure 2 are mainly driven by the availability of renewable resources, such as aeolian and hydraulic energy. Although the coal (18.62%) and natural gas (17.72%) are still relevant, to our best understanding, the overall result is still positive, since the production of renewable energy surpasses half of the national production of energy.
Figure 2. Renewable and fossil energy sources (see online version for colours)
2.3 European regulation for carbon dioxide emissions (CO2)
Cities consume over two-thirds of the world’s energy and account for more than 70% of global CO2 emissions (Kuppusamy et al., 2017). A salient characteristic of EVs is their cleaner environmental impacts relative to conventional fuel vehicles, as they have either zero or much less tailpipe greenhouse gas (GHG)/CO2 emissions than conventional cars (Manjunath and Gross, 2017). As EVs have no combustion engine, there are no oil changes, tune-ups, or timing and there is no exhaustion (Bansal, 2005). The EU legislation sets mandatory emission reduction targets for new vehicles. According to the European Commission, cars are responsible for around 12% of total EU emissions of CO2, the main greenhouse gas, as 2021 targets represents a reduction of 40% compared with the 2007 fleet average of 158.7 grams of CO2 per kilometre (COM, 2014). On 8 November 2017, the European Commission presented a legislative proposal setting new CO2 emission standards for passenger cars and light commercial vehicles in the EU for the period after 2020, the proposal also includes a mechanism to incentivise the up-take of zero- and low-emission vehicles, in a technology-neutral way (COM, 2017). The objective of this proposal will contribute to the achievement of the EU’s commitments under the Paris agreement. According to the European Commission the CO2 greenhouse gas most commonly produced by human activities is responsible for 64% of man-made global warming, a part of the causes for rising emissions are due burning coal, oil and gas which produces carbon dioxide and nitrous oxide (EC, 2018). The prospect of reducing CO2 emissions has also raised the obligation of European governments to embark on substantial programs to achieve a cleaner mobility. In particular, the Portuguese government is following that trend, by investing on upstream renewable energy sources that allows recharging of existing public service electric vehicles downstream.
3. Methodology
This paper reports on the results of a case study carried out in a Portuguese OEM. The objective was to understand the pros and cons of the implementation of electric vehicles to achieve clean practices of waste collection. This case study research uses multiple sources of data collation for triangulation purposes. The sources of data collection consisted of semi-structured interviews, direct observation and documental analysis. The author decided about using multiple sources of data collection as a form of triangulation to prevent exclusive reliance on a single data collection method and thus, aid to neutralise any bias inherent to a particular data source (Given, 2008).
The study builds on 11 semi-structured interviews conducted with employees from the OEM that is operating in Portugal and seven semi-structured interviews with the drivers of the eTrucks. The researcher made use of his personal contacts network to identify the respondents who were best positioned to provide answers to the interview protocol. Convenient and snowball sampling was also used to select the respondents, as well as the recommendations and directions from the respondents of the first round of interviews. Prior to the interviews, the author obtained the participants’ consent, which included the consent for audio recording. The direct observation involved observations to enable a better understanding about the real life phenomenon, thus, these observations were recorded in a research diary, that had notes from random visits to the sites and informal discussions about the company strategy and the successful of such implementation. The institutional documents were generally produced by the company for communication or record-keeping purposes and were sources of exceptional data collection (Mills et al., 2010), because most of the records were available at the official website.
The data analysis was examined according to the technique of content analysis, which is frequently recommended by scholars when the case research is qualitative by nature (Mills et al., 2010). The author categorised the transcript into codes and categories in order to identify patterns and relations between variables with the help of a qualitative data analysis software (NVivo11). The reliability and validity of the case study was achieved by a well-designed interview protocol and improved by double-checking the transcripts with the participants in order to avoid misinterpretations.
4. Results and discussion
This section provides an empirical summary of the case study research, presenting the pros and cons of implementing electric light trucks in European capitals for an effective public service with reduced CO2 footprint.
4.1 Environmentally friendly policy
As an EV, the eTruck reduces the impact of exhaust and noise emissions on city centres, while it is also environmentally attractive when compared to diesel engines.
The environmental impact has been widely discussed in the academic literature, but no consensus has been reached yet. The papers of Zivin et al. (2014) and Yuksel and Michalek (2015) describe the impact of temperature on EVs’ efficiency, range and emissions, while McLaren et al. (2016) considers different charging scenarios and travel profiles of EVs and analyses their impact on the associated carbon emissions. However, there are a lot of questions that still remain open and one of them is “what happens at the end of the lifecycle of a battery and an electric motor?”, as the number of sold electric vehicles will increase the amount of electric motors and battery waste will increase too, leading to a greater impact on the environment (Racz et al., 2015).
On the other hand, current research shows that EVs may have a role in reducing air pollution and its consequences for health. The study “How clean are electric vehicles? Review of the environmental and health effects of electric mobility” conducted by Requia et al. (2018) provides a comprehensive review of the effects of EV adoption on air quality, greenhouse gas emissions, and human health. Requia et al. (2018) have resumed relevant published papers, from up to 4734 studies, mostly carried out in the USA and China, out of which 65 papers fulfilled the inclusion criteria, showed consistently reductions in greenhouse gas emissions and emissions of some criteria pollutants. The respondents of our case study also emphasised the eco-friendliness of the eTruck, which is expected to become one of the most important criteria to the Portuguese public administration acquisitions. The efficiency of electric light trucks fleet allows the possibility to balance the electricity usages rates and the electricity demand, since some of these vehicles are operating during the night hours. Moreover, the Portuguese government provides dedicated infrastructures of easy access to fast charging that reduces the eTruck downtime.
4.2 Economically reliable alternative to diesel engines
Frequently, the fuel used by electric trucks is cheaper, when compared with ICEVs (Delang and Cheng, 2013). However, it is dependent on the weather conditions and low temperatures (0°C or below), which can have negative impacts on the battery’s performance. This creates ineffectiveness and increases on-road energy consumption, which further limits the vehicle’s range (Kim et al., 2008). Due to the temperate climate of Portugal, the aforementioned limitations are not observed, and do not have a real impact on the use of electric vehicles.
The limitations of Lisbon are quite the same as other cities around the world (e.g., Hong Kong), due to its compact and dense streets, most of trips are short in distance; therefore, the short range of electric vehicles (mostly within the 100–200 km range) would not represent a problem to the needs of public services (Delang and Cheng, 2013). Consequently, electric light vehicles might be a reliable choice, since the other forms of EVs (e.g., hybrid electric vehicles), as motor vehicles, are more credible to long distances (Racicovschi et al., 2007).
The eTruck has a range of 100 kilometres and load capacity up to three and a half tons. This light-duty truck contains up to six high voltage lithium ion batteries of 13.8 kWh each. According to the respondents, the batteries are charged with regenerative braking and deceleration which reduces the battery consumption. In addition, reports and direct observation have showed that, in comparison to diesel engines, the Portuguese public administration will have 30% lower maintenance costs and potential fuel savings of 1000 euros per 10,000 km (estimated values).
The cons the author has recorded are associated to acquisitions costs because of the low production, since the eTruck is still being in pre-test. On the other hand, for the most sceptical respondents, the autonomy of these vehicles can always be optimised with the research and development (R&D) of more efficient batteries and green technologies. These findings are in line with the literature, as scholars argue that the relatively high costs of purchase and low durability of key components (e.g., batteries) are significant barriers to the wider use of electric vehicles (Delucchi and Lipman, 2001; Schiffer and Walther, 2018). Besides major environmental advantages, the EVs have not yet managed to penetrate massively into the car market and convinced possible users (Racicovschi et al., 2007), despite the limitations the Portuguese government is trying to push and accelerating the adoption of AFVs as ecological alternatives.
4.3 Improving the quality of life in capital cities
To improve the quality of life in Lisbon, the eTruck is identified by the respondents as the most suitable vehicle to collect urban residues. The eTruck mainly works during night hours and it can quietly travel the city without disturbing the local inhabitants. Despite the mentioned advantage, the respondents had also identified some constraints:
The eTruck cargo boxes are traditionally made of metal, and are the same as the combustion trucks, which are not zero-noise efficient; therefore, unless these boxes are adapted to keep a silent propulsion, the EV zero-noise advantage will be lost or reduced.
The eTruck also requires an independent front suspension to improve the driving quality, as well as a greater cushioning in the cabin. The eTruck drivers stated the manufacturer should take into account that the city of Lisbon has many areas where the road surface is in poor condition, and this affects the driver experience. While this truck is in pre-test and before going to production on large scale, these limitations should be taken in consideration.
Studies also refer that drivers of EVs experience range anxiety or worry about the limited driving range of these vehicles (Eberle and Von Helmolt, 2010). To avoid the driver range anxiety, the instrument panel of the eTruck only shows the percentage of charging of the batteries, whether if the drivers need to know how many kilometres are left, they have to access the central screen and select the vehicle information.
Besides the zero-noise, the issue of poor air quality is also a pressing problem in many urban areas as it directly affects the health of people and as a result the life expectancy of citizens (Quak et al., 2015). At long term, despite the mentioned constraints, the respondents agreed the electric light trucks will definitely contribute to a reduction of the poor air quality that is felt in Lisbon area, and consequently will have a positive impact on the environment.
4.4 Pros and cons of implementing electric light trucks at public services
This section addresses the motivations which are driving the implementation of electric light trucks at public services. Table 1 identifies the pros and cons, and discusses possible solutions to constraints that were scholarly or empirically identified.
Table 1. Pros and cons of light-duty trucks in public services
.
The novelty of these results brings back solutions to old EVs’ problems, which is the same to say that the eTruck already integrates solutions that addresses issues previously raised in the literature. One of the most relevant finds is related to the improvement of the quality of life, either by improving the breathable air quality or by the releasing of zero-noise emissions. On the other hand, the introduction of EVs improves the Portuguese public administration, since the EVs are cost-efficienct, but it might also incentivise private markets to follow the same ecological practices. However, the author of this paper has doubts regarding the governmental support for the private practices, as better strategies and implementation plans might be needed, similarly to a study conducted in the UK, that revealed ineffectual strategies regarding the EV uptake and infrastructure provision (Heidrich et al., 2017).
Briefly, the paper shows that the implementation of electric light trucks is suitable to improve the efficiency of public services, although there are still some gaps listed in this paper that needed to be solved, among others that were not investigated.
5. Conclusions
The Portuguese government has implemented a comprehensive strategy to push the use of zero-emissions vehicles in some public services. The results suggest that electric light trucks are cost-efficient, zero-noise and eco-friendly (zero-emissions). This study has both theoretical and managerial insights, as we look at the emergence of dominant electric trucks on public services and we provide the most relevant pros and cons of such implementation.
As this study is suitable to build a better understanding of a real-life phenomenon, it also points out some limitations: The ‘eTruck’ term is fictitious, since the author decided not to explicitly reveal the identity of the manufacturer and the respective participants. The reason that led us to undertake an agreement of confidentiality is due the respondents’ reluctance to discuss the disadvantages of the eTruck. A limitation that was mitigated with direct observations and documental analysis, which corroborated the results the author has found from the formal interviews. In the same vein, this case study research does not allow generalisation; however, the author believes the ongoing projects at the aforementioned capital cities might provide some additional and relevant contributions.
The author also suggests avenues for further research, as it would be interesting to carry out a similar study in other countries for corroboration purposes. Thus, an important research area is the development of a better understanding of the topic, since this research is limited to its exploratory nature. Besides yielding a better understanding about the state-of-the-art of new automobile trends, this paper aims at helping guide future policy and planning towards the introduction of electric vehicles in public services.
References
APREN (2018) Balanço da produção de eletricidade de Portugal continental (janeiro a agosto de 2018), http://www.apren.pt/pt/energias-renovaveis/producao (Accessed 23 September, 2018). Bansal, R. (2005) ‘Electric vehicles’, Electrical and Computer Engineering, Vol. 125, No. 55, pp.1–43. Black, W. (2000) ‘Socio-economic barriers to sustainable transport’, Journal of Transport Geography, Vol. 8, No. 2, pp.141–147. Chen, B. and Midler, C. (2016) ‘The electric vehicle landscape in China: between institutional and market forces’, International Journal of Automotive Technology and Management, Vol. 16, No. 3, pp.248–273. COM (2014) Regulation (EU) No 333/2014 of the European Parliament and of the council of 11 March 2014 to Define the Modalities for reaching the 2020 Target to Reduce CO2 Emissions from New Passenger Cars, European Commission Report. COM (2017) Proposal for a Regulation of EP and the Council Setting Emission Performance Standards for New Passenger Cars and for New Light Commercial Vehicles as Part of the Union’s Integrated Approach to Reduce CO2 Emissions from Light-Duty Vehicles and Amending Regulation (EC) No 715/2017, European Commission Report. Delang, C. and Cheng, W-T. (2013) ‘Hong Kong people’s attitudes towards electric cars’, International Journal of Electric and Hybrid Vehicles, Vol. 5, No. 1, pp.15–27. Delucchi, M. and Lipman, T. (2001) ‘An analysis of the retail and lifecycle cost of battery-powered electric vehicles’, Transportation Research Part D: Transport and Environment, Vol. 6, No. 6, pp.371–404. Eberle, U. and Von Helmolt, R. (2010) ‘Sustainable transportation based on electric vehicle concepts: a brief overview’, Energy & Environmental Science, Vol. 3, No. 6, pp.689–699. EC (2018) Causes of Climate Change, European Commission, https://ec.europa.eu/clima/change/causes_en (Accessed 23 September, 2018). Fu, J., Chen, X. and Hu, Q. (2018) ‘Subsidizing strategies in a sustainable supply chain’, Journal of the Operational Research Society, Vol. 69, No. 2, pp.283–295. Given, L. (2008) The SAGE Encyclopedia of Qualitative Research Methods, Sage Publications, Thousand Oaks, California. Haugneland, P. and Hauge, E. (2015) ‘Norwegian electric car user experiences 2014’, World Electric Vehicle Journal, Vol. 7, pp.1–9. Heidrich, O., Hill, G., Neaimeh, M., Huebner, Y., Blythe, P. and Dawson, R. (2017) ‘How do cities support electric vehicles and what difference does it make?’, Technological Forecasting and Social Change, Vol. 123, pp.17–23. Høyer, K. (2008) ‘The history of alternative fuels in transportation: the case of electric and hybrid cars’, Utilities Policy, Vol. 16, No. 2, pp.63–71. Kim, B., Tredeau, F. and Salameh, Z. (2008) ‘Performance evaluation of lithium polymer batteries for use in electric vehicles’, Paper presented at the Vehicle Power and Propulsion Conference, 3–5 September, Harbin, China, pp.1–5. Kuppusamy, S., Magazine, M. and Rao, U. (2017) ‘Electric vehicle adoption decisions in a fleet environment’, European Journal of Operational Research, Vol. 262, No. 1, pp.123–135. Mahmoudi, C., Flah, A. and Sbita, L. (2014) ‘An overview of electric Vehicle concept and power management strategies’, Cell, Vol. 216, No. 50, pp.911–920. Manjunath, A. and Gross, G. (2017) ‘Towards a meaningful metric for the quantification of GHG emissions of electric vehicles (EVs)’, Energy Policy, Vol. 102, pp.423–429. McLaren, J., Miller, J., O’Shaughnessy, E., Wood, E. and Shapiro, E. (2016) ‘CO2 emissions associated with electric vehicle charging: the impact of electricity generation mix, charging infrastructure availability and vehicle type’, The Electricity Journal, Vol. 29, No. 5, pp.72–88. Mills, A., Durepos, G. and Wiebe, E. (2010) Encyclopedia of Case Study Research, Sage Publications, California. Milowski, J., Bhattacharjee, K., Singh, H. and Ray, T. (2018) ‘Alternative passenger cars for the Australian market: a cost-benefit analysis’, Data and Decision Sciences in Action, Springer, Cham., pp.163–173. Pelletier, S., Jabali, O., Laporte, G. and Veneroni, M. (2017) ‘Battery degradation and behaviour for electric vehicles: review and numerical analyses of several models’, Transportation Research Part B, Vol. 103, pp.158–187. Plötz, P., Funke, S. and Jochem, P. (2018) ‘Empirical fuel consumption and CO2 emissions of plug-in hybrid electric vehicles’, Journal of Industrial Ecology, Vol. 22, No. 4, pp.773–784. Proff, H. (2012) ‘Managing the transition to electric mobility in Chinese automotive subsidiaries of MNCs’, International Journal of Automotive Technology and Management, Vol. 12, No. 4, pp.330–344. Quak, H., Nesterova, N. and Rooijen, T. (2015) ‘Possibilities and barriers for using electric-powered vehicles in city logistics practice’, Transportation Research Procedia, Vol. 12, pp.157–169. Racicovschi, V., Chefneux, M. and Danciu, G. (2007) ‘Romanian concerns in the field of electric vehicles’, International Journal of Electric and Hybrid Vehicles, Vol. 1, No. 1, pp.46–56. Racz, A., Muntean, I. and Stan, S. (2015) ‘A look into electric/hybrid cars from an ecological perspective’, Procedia Technology, Vol. 19, pp.438–443. Requia, W., Mohamed, M., Higgins, C., Arain, A. and Ferguson, M. (2018) ‘How clean are electric vehicles? Evidence based review of the effects of electric mobility on air pollutants greenhouse gas emissions and human health’, Atmospheric Environment, Vol. 187, pp.64–77. Santini, D. (2011) ‘Electric vehicle waves of history: lessons learned about market deployment of electric vehicles’, Electric Vehicles-The Benefits and Barriers, IntechOpen, pp.35–62, Retrived from: http://cdn.intechopen.com/pdfs/18663/InTechElectric_vehicle_waves_of_history_lessons_learned_about_market_deployment_of_electric_vehicles.pdf Schiffer, M. and Walther, G. (2018) ‘Strategic planning of electric logistics fleet networks: a robust location-routing approach’, Omega, Vol. 80, pp.31–42. Weinert, J., Ogden, J., Sperling, D. and Burke, A. (2008) ‘The future of electric two-wheelers and electric vehicles in China’, Energy Policy, Vol. 36, No. 7, pp.2544–2555. Xie, F., Liu, C., Li, S., Lin, Z. and Huang, Y. (2018) ‘Long-term strategic planning of inter-city fast charging infrastructure for battery electric vehicles’, Transportation Research Part E: Logistics and Transportation Review, Vol. 109, pp.261–276. Xu, F., Jiao, X., Wang, Y. and Jing, Y. (2018) ‘Battery-lifetime-conscious energy management strategy based on SP-SDP for commuter plug-in hybrid electric vehicles’, IEEJ Transactions on Electrical and Electronic Engineering, Vol. 13, No. 3, pp.472–479. Yuksel, T. and Michalek, J. (2015) ‘Effects of regional temperature on electric vehicle efficiency, range, and emissions in the United States’, Environmental science & technology, Vol. 49, No. 6, pp.3974–3980. Zhu, Z., Gao, Z., Zheng, J. and Du, H. (2018) ‘Charging station planning for plug-in electric vehicles’, Journal of Systems Science and Systems Engineering, Vol. 27, No. 1, pp.24–45. Zivin, J., Kotchen, M. and Mansur, E. (2014) ‘Spatial and temporal heterogeneity of marginal emissions: implications for electric cars and other electricity-shifting policies’, Journal of Economic Behavior & Organization, Vol. 107, pp.248–268.
Reference to this paper should be made as follows: Reis, J. (2019) ‘Implementing electric vehicles in public services: a case study research’, Int. J. Electric and Hybrid Vehicles, Vol. 11, No. 3, pp.205–216.
Biographical notes: João Reis is an Assistant Professor of Service Management (Aveiro University), Operations Management (ISLA-Santarém) and Supply Chain Management (Portuguese Military Academy). He received a PhD in Management and Industrial Engineering from Aveiro University. During the last 10 years, he has been conducting extensive scientific research in the service industry. He is a research fellow at the research unit on Governance, Competitiveness and Public Policy (GOVCOPP) in the fields of service science, industrial engineering and operations management. During his free time, he frequently performs humanitarian aid in Africa, Asia and around the South-eastern Europe.
Published by Jose Mendi, EE Power – Technical Articles: Power Quality Monitoring Part 1: The Importance of Standards-Compliant Power Quality Measurements, May 17, 2023.
This article discusses the importance of power quality (PQ) measurements in today’s electric infrastructure and reviews areas of application for PQ monitoring. It will cover the IEC standard for power quality and its parameters. Finally, it summarizes the key differences between Class A and Class S power quality meters. Part 2 will illustrate recommended solutions on how to design a standards-compliant power quality meter.
Power quality (PQ) has found a renewed interest due to changing power generation modes and consumption dynamics. The unprecedented growth in renewable sources at different voltage levels has increased the amount of PQ-related issues. Consumption patterns have also seen a wide transformation due to unsynchronized loads added at multiple entry points of the grid and voltage levels.
The Need for Power Quality Measurement in Today’s Electric Infrastructure
Some examples are electric vehicle (EV) chargers that can require hundreds of kilowatts and a great number of data centers and their related equipment, such as heating, ventilation, and air conditioning. In industrial applications, arc furnaces that run by variable frequency drives, switching transformers, etc., not only add a lot of unwanted harmonics to the grid but are responsible for voltage dips, swells, transient brownouts, and flicker
Figure 1. Power quality issues. Image used courtesy of Bodo’s Power Systems [PDF]
Power quality in the utility space refers to the quality of the voltage delivered to the consumer; a series of prescribed regulations for the magnitude, phase, and frequency determine this quality of service. However, by definition, it denotes both voltage and current. While the voltage is easily controlled by the generation side, the current is governed largely by consumer usage. The concept and implications of PQ issues are rather widespread depending on the end users.
The economic impact of bad PQ has been studied and surveyed extensively in the last few years; its effects are estimated to be in the region of billions of dollars worldwide.1 All these studies conclude that monitoring the quality of power has a direct impact on the economic results of many business sectors. Even though it is clear how bad PQ negatively affects the economics of business, monitoring it efficiently and effectively at scale is not an easy task. Monitoring PQ in a facility involves having highly trained personnel and expensive equipment installed on multiple points along the electric system for long or indefinite periods of time.
Power Quality Monitoring Applications
Power quality monitoring is often seen as a cost-saving strategy for some business sectors and a critical activity for others. Power quality issues can arise in a broad range of electric infrastructure, as illustrated in Figure 2. As we’ll discuss later, power quality monitoring is becoming increasingly critical in business sectors such as electric generation and distribution, EV charging, factories, and data centers.
Electricity Utility Companies, Electricity Transmission, and Distribution
Utility companies serve the consumers with distribution systems that include generating stations, which are power substations that supply electricity via transmission lines. The voltage supplied via these transmission lines is stepped down to lower levels by substation transformers, which inject certain harmonics or inter-harmonics into the system. Harmonic currents in distribution systems can cause harmonic distortion, low power factor, and additional losses as well as overheating in the electrical equipment2, leading to a reduction in the lifetime of equipment and increases in cooling costs. Nonlinear single-phase loads served by these substation transformers deform the current’s waveform. The unbalance of nonlinear loads leads to additional losses on power transformers, additional neutral loads, unexpected operation of low power circuit breakers, and incorrect measurement of electricity consumed.3 Figure 3 illustrates the effect of these linear loads.
Figure 2. The dynamics of generation and consumption can lead to power quality issues across electric infrastructure. Image used courtesy of Bodo’s Power Systems [PDF]
Electricity generation by wind and solar photovoltaic (PV) systems injected into the grid cause several power quality problems as well. On the wind generation side, wind intermittency creates harmonics and short-duration voltage variations.4 The inverters in PV solar systems create noise that can produce voltage transients, distorted harmonics, and radio frequency noise because of the high-speed switching commonly used to increase the efficiency of the energy harvested.
EV Chargers
EV chargers can face multiple power quality challenges, both in power sent to and from the grid (see Figure 4). From a power distribution company perspective, power electronics-based converters used in EV chargers inject harmonics and inter harmonics. Chargers with improperly designed power converters can inject direct currents (DC). Additionally, fast EV chargers introduce rapid voltage changes and voltage flicker into the grid. From the EV charger side, faults in transmission or distribution systems lead to voltage dips or interruptions of supply voltage to the charger. Reduction of voltage from the EV charger tolerance limits will lead to activation of undervoltage protection and disconnection from the grid (which leads to a very bad user experience).5
Figure 3. The impact of current harmonics generated by a nonlinear load. Image used courtesy of Bodo’s Power Systems [PDF]
Factories
Power quality problems caused by power supply variations and voltage disturbances cost approximately $119 billion (U.S.) per year for industrial facilities in the United States, as per an Electric Power Research Institute (EPRI) report.6 Additionally, 25 EU states suffer an equivalent of $160 billion (U.S.) in financial losses per year due to different PQ issues, according to the European Copper Institute.7 These figures are linked to subsequent downtime and production losses as well as the equivalent of intellectual productivity losses.8
Figure 4. Power quality issues for EV chargers. Image used courtesy of Bodo’s Power Systems [PDF]
Degradation of power quality is usually caused by intermittent loads and load variations from arc furnaces and industrial motors. Such disturbances give rise to surges, dips, harmonic distortions, interruptions, flicker, and signaling voltages.9 To detect and record these disturbances inside a factory installation, it is necessary to have power quality monitoring equipment at several points throughout the electric installation or, even better, have it at the load level. With the arrival of new Industry 4.0 technologies, power quality monitoring at the load can be addressed by industrial panel meters or submeters to have a comprehensive view of the quality of the power delivered to each load.
Data Centers
Presently, most business activities depend on data centers in one way or another to provide email, data storage, cloud services, etc. Data centers demand a high level of clean, reliable, and uninterrupted electricity supply. PQ monitoring excellence helps managers prevent costly outages and helps manage equipment maintenance, or replacement, required due to issues on the power supply units (PSU). The integration of uninterruptable power supply (UPS) systems into rack power distribution units (PDUs) represents another reason to add PQ monitoring to IT racks inside the data center. This integration can provide visibility to power issues at a power socket level.
UPS system failure, including UPS and batteries, is the primary cause of unplanned data center outages, according to a report made by Emerson Network Power.10 Around a third of all reported outages cost companies nearly $250,000.11 UPS systems are used on every data center to ensure clean and uninterrupted power. These systems isolate and mitigate most of the power problems from the utility side, but they do not protect against issues generated by the PSU of IT equipment itself. IT equipment PSUs are nonlinear loads that can introduce harmonic distortion in addition to other problems caused by equipment, such as those resulting in high-density cooling systems with variable frequency speed-controlled fans. Apart from these issues, PSUs also face interference that comes in multiple forms, such as voltage transients and surges, voltage swells, sags, and spikes, imbalance or fluctuations, frequency variation, and poor facility grounding.
Power Quality Standards Defined
Power quality standards specify measurable limits to the electricity magnitudes as to how far they can deviate from a nominal specified value. Different standards apply to different components of the electricity system. Specifically, the International Electrotechnical Commission (IEC) defines the methods for measurement and the interpretation of results of PQ parameters of alternating current (AC) power systems in the IEC 61000-4-30 standard. The PQ parameters are declared for fundamental frequencies of 50 Hz and 60 Hz. This standard also establishes two classes for measurement devices: Class A and Class S.
Figure 5. IEC power quality standards. Image used courtesy of Bodo’s Power Systems [PDF]
► Class A defines the highest level of accuracy and precision for the measurements of PQ parameters and is used for instruments requiring very precise measurements for contractual matters and dispute resolution. It is also applicable to the devices that need to verify standards compliance.
► Class S is used for power quality assessment, statistical analysis applications, and diagnostics of power quality problems with low uncertainty. The instrument in this class can report a limited subset of the parameters defined by the standard. The measurements made with Class S instruments can be done on several sites on a network, on complete locations, or even on single pieces of equipment.
It is important to note that the standard defines the measurement methods, establishes a guide for the interpretation of the results, and specifies the performance of the power quality meter. It does not give guidelines on the design of the instrument itself.
The IEC 61000-4-30 standard defines the following PQ parameters for Class A and Class S measurement devices.12
Power Frequency
• Magnitude of the supply voltage and current • Flicker • Supply voltage dips and swells • Voltage interruptions • Supply voltage unbalance • Voltage and current harmonics and interharmonics • Rapid voltage change • Underdeviation and overdeviation • Mains signaling voltage on the supply voltage
Figure 6. Classification of power quality parameters in a timescale. Image used courtesy of Bodo’s Power Systems [PDF]
Table 1. IEC 61000-4-30 Class A and Class S Key Differences.
.
Differences Between Class A and Class S Defined by the IEC 61000-4-30 Standard
Although Class A defines higher levels of accuracy and precision than Class S, the differences are beyond just levels of accuracy. Instruments must comply with requirements such as time synchronization, quality of probes, calibration period, temperature ranges, etc. Table 1 presents a list of requirements that instruments shall meet to be certified in one or the other class.
Power Quality Summary
Power quality issues are present across the whole electric infrastructure. Having equipment that monitors these PQ issues helps to improve performance, quality of service, and equipment lifetime while reducing economic losses. In Part 2, “How to Design a Standards Compliant Power Quality Meter,” we will introduce an integrated solution and a ready-to-use platform that can significantly accelerate development and reduce costs for developing PQ monitoring products.
References
1. Panuwat Teansri, Worapong Pairindra, Narongkorn Uthathip Pornrapeepat Bhasaputra, and Woraratana Pattaraprakorn. “The Costs of Power Quality Disturbances for Industries Related Fabricated Metal, Machines and Equipment in Thailand.” GMSARN International Journal, Vol. 6, 2012. 2. Sai Kiran Kumar Sivakoti, Y. Naveen Kumar, and D. Archana. “Power Quality Improvement In Distribution System Using DStatcom in Transmission Lines.” International Journal of Engineering Research and Applications (IJERA), Vol. 1, Issue 3. 3. Gabriel N. Popa, Angela Lagar, and Corina M. Diniş. “Some Power Quality Issues in Power Substation from Residential and Educational Buildings.” 10th International Symposium on Advanced Topics in Electrical Engineering (ATEE), IEEE, 2017. 4. Sulaiman A. Almohaimeed and Mamdouh Abdel-Akher. “Power Quality Issues and Mitigation for Electric Grids with Wind Power Penetration.” Applied Sciences, December 2020. 5. George G. Karady, Shahin H. Berisha, Tracy Blake, and Ray Hobbs. “Power Quality Problems at Electric Vehicle’s Charging Station.” SAE Transactions, 1994. 6. David Lineweber and Shawn McNulty. “The Cost of Power Disturbances to Industrial and Digital Economy Companies.” Electric Power Research Institute, Inc., June 2001. 7. Roman Targosz and Jonathan Manson. “Pan-European Power Quality Survey.” 9th International Conference on Electrical Power Quality and Utilisation, IEEE, 2007. 8. Subrat Sahoo. “Recent Trends and Advances in Power Quality.” Power Quality in Modern Power Systems, 2020. 9. A. El Mofty and K. Youssef. “Industrial Power Quality Problems.” 16th International Conference and Exhibition on Electricity Distribution, 2001. Part 1: Contributions. CIRED (IEE Conf. Publ No. 482), IEEE, June 2001. 10. Cost of Data Center Outages.” Ponemon Institute, January 2016. 11. Data Center Outages Are Common, Costly, and Preventable.” Uptime Institute. 12. IEC 61000-4-30:2015: Electromagnetic Compatibility (EMC)-Part 4-30: Testing and Measurement Techniques-Power Quality Measurement Methods.” International Electrotechnical Commission, February 2015.
This article originally appeared in Bodo’s Power Systems [PDF] magazine
Author: Jose Mendia has a B.Sc. in electronics and computer science engineering and joined the Energy and Industrial System Group at Analog Devices in 2016. Currently, he is a senior engineer in product applications at the Edinburgh UK design center.
Published by Dario Pevec *,† , Jurica Babic † and Vedran Podobnik †, Faculty of Electrical Engineering and Computing, University of Zagreb, Zagreb 10000, Croatia; jurica.babic@fer.hr (J.B.); vedran.podobnik@fer.hr (V.P.) * Correspondence: dario.pevec@fer.hr † These authors contributed equally to this work.
Abstract: Current trends are showing that the popularity of electric vehicles (EVs) has significantly increased over the last few years, causing changes not only in the transportation industry but generally in business and society. This paper covers one possible angle to the (r) evolution instigated by EVs, i.e., it provides the data science perspective review of the interdisciplinary area at the intersection of green transportation, energy informatics, and economics. Namely, the review summarizes data-driven research in EVs by identifying two main research streams: (i) socio–economic, and (ii) socio–technical. The socio–economic stream includes research in: (i) acceptance of green transportation in countries and among different populations, (ii) current trends in the EV market, and (iii) forecasting future sales for the green transportation. The socio–technical stream includes research in: (i) electric vehicle battery price and capacity and (ii) charging station management. This kind of study is especially important now when the question is no longer whether the transition from internal-combustion engine vehicles to clean-fuel vehicles is going to happen but how fast it will happen and what are going to be implications for society, governmental policies, and industry. Based on the presented literature review, the paper also outlines the most significant open questions and challenges that are yet to be solved: (i) scarcity of trustworthy (open) data, and (ii) designing a generalized methodology for charging station deployment.
Keywords: electric vehicles; green transportation; charging infrastructure; energy informatics; data science; big data
1. Introduction
In the last five years, electric vehicles (EVs) have gained increased popularity [1]. There are multiple reasons behind that fact. Firstly, technology is constantly advancing, and considering research and development trends today, wide acceptance of EVs is a step in the evolution of public and private transport. Secondly, the transportation sector is considered to be one of the main contributors to CO2 emissions, one of the crucial factors behind climate change [2]. Wider acceptance of EVs, and of green transportation in general, is one of the possible solutions to lower those emissions that are part of the greenhouse gases (GHG), as stated by Saber and Venayagamoorthy [3]. Finally, from the economics point of view, EVs are sustainable (i.e., when they are sourced through renewable sources, such as solar energy, wind energy, or biomass energy) and the price of electricity is by order of magnitude lower than the price of fossil fuels (Granovskii et al. [4]) which is an important factor for consumers.
Even with the current growing trend of the EV market share, there are several main obstacles for EVs to release their full potential: battery capacity, battery price, charging time, and availability of charging stations. Nowadays, EV batteries have limited range that they can cover while being fully charged, and as the range increases, so does the price of the battery, which based on our literature review (see Sections 4 and 4.1), is a major influence between potential EV owners. In 2014, the price for an average EV battery, i.e., 30 kWh, was around 12,000 USD and EVs powered by that kind of battery could travel approximately 100 km [5]. The forecast is that in the following years, due to technological advances, the price of batteries will significantly drop [6]. Apart from batteries, a particular focus is placed on charging infrastructure development, i.e., infrastructure used by EV owners to recharge their EVs. The main problem with charging stations is that their infrastructure is scarce, especially in underdeveloped countries [7] (e.g., Croatia has a small number of charging stations, and their placement and control is decentralized and unplanned). Also, before-mentioned factors (i.e., small battery capacity and underdeveloped charging infrastructure) together result in the phenomenon known as range anxiety. Neuber andWood [8] define range anxiety as fear of running out of electricity before reaching an available (i.e., unoccupied) charging station (CS). Despite the increase in the number of EVs on the road, range anxiety is still one of the key negative factors for the potential new EV owners [9].
There are many studies related to EVs. Since the technology related to EVs is relatively new, the majority of those studies are in the field of electrical engineering. The first research papers date to mid-1960s and they are mostly progress reports (Hender [10]) and discussions on recent developments in the field of EVs (e.g., development of EV batteries and engine by Rees et al. [11]). Up until the 90’s, the concept of EVs was not widely accepted and research centered around them was scarce and oriented towards electrical engineering. In early 90’s, the first papers from the field of Information and Communication Technology (ICT) started to appear (e.g., Golob et al. [12], which deals with the problem of forecasting the market penetration of electric and clean-fuel vehicles). Nowadays, there are ever-increasing numbers of EV-related papers from many fields, including:
• social studies (e.g., influence of sustainable transport on society and environment, such as Tanaka et al. [13]);
• economics (e.g., market penetration and economical changes due to increase in electric power consumption, such as [6]);
• informatics (e.g., computational algorithms for managing charging infrastructure, such as Pevec et al. [14], Babic et al. [15]);
• telecommunications (e.g., protocols for communicating with charging stations or for payment, such as Buamod et al. [16] and van Amstel et al. [17]);
• electrical engineering (e.g., development of low cost batteries, power electronics for the chargers, the motor driver, and improving existing technologies, such as Ruiz et al. [18] and Yilmaz et al. [19].)
This paper is a review which explores EVs from the aspect of three interdisciplinary studies—green transportation, energy informatics, and economics—as depicted in Figure 1. That perspective gives us a clear view of the current state and the future development of private transport. Even though green transportation is a generic term for zero-emission vehicles (e.g., cars, trains, and buses), within this work, we use the term green transportation to refer to battery electric vehicles (BEV) and plug-in hybrid electric vehicles (PHEV). Energy informatics is also a generic term that includes a broad field of research with a focus on information in energy systems. This paper only observes energy informatics studies that are strongly associated with EVs (e.g., charging of electric vehicles, the impact of EVs on a power grid). Economics is a highly relevant research domain since the EVs introduce great changes in the petrol industry and vehicle market. Previous three research fields will be observed from the data science point of view. Data science, according to the Van Der Aalst [20] can be defined as a combination of classical disciplines, i.e., statistics, data mining, databases, and distributed systems, for solving various challenges using domain-related datasets. The focus of this paper is an intersection of all four domains and to the best of our knowledge, this is the first review that aims to systematically provide such an overview of this interdisciplinary research field.
Figure 1. Thematic positioning of the paper: intersection of interdisciplinary fields.
Figure 2 gives an overview of entities relevant to the interdisciplinary research targeted by this paper, as well as presents relationships among them. An EV owner, who charges her/his EV on a charging station that is connected to a power grid and interacts with other people is in the domain of green transportation. The flow of information from the owner to the power grid can result in an energy efficiency increase, what is the key idea behind energy informatics that studies how to use information and communication technologies to tackle the energy domain challenges. Advanced operations using information flow (e.g., predicting utilization with the goal to optimally allocate charging stations) us characteristic for the data science field of research.
Figure 2. Interaction between entities in research area of interest.
The rest of the paper is organized as follows. Section 2 describes the methodology used to perform the review (e.g., keywords for querying several scientific databases, and filters applied). Section 3 describes methods through which EV-related data can be acquired as well as popular EV data sources, while Section 4 provides outlook of socio–economic factors of green transportation: EV market, together with different forecasts for future of EVs (e.g., market penetration, cost of EVs, or cost of EV batteries). The socio–technological aspect of green transportation is presented in Section 5. Section 6 proposes a research agenda by synthesizing open research questions, while Section 7 concludes this paper.
2. Review Methodology
We now explain the methodology used for the literature review. This review focuses on papers that were published between 2011 and 2018 since, as described in the Introduction Section, studies from earlier years are mainly focused on the electrical engineering aspect of the research area. The next filter is about the subject area: this paper focuses only on computer science and mathematics since the primary focus is placed on data science in the area of EVs and those two broad areas are employing data science relevant methodologies. Lastly, we only consider publications that are either conference papers or articles. The three scientific databases that were used are Scopus, the Elseviers’ database of peer-reviewed literature [21], and IEEE Xplore Digital Library [22].
The keyword that the search was based upon was applied to the title of a paper, the abstract, and keywords of the paper. The core search term was “electric vehicles”, which corresponds to our definition of green transportation (see Figure 1), and with all applied filters as described above, this search resulted with 5612 papers. Both search engines that were used have an option to search within results (i.e., within those 5612 papers), and since area of interest is intersection between four research areas (see Figure 1), search was further refined using three new keywords to cover the remaining three research areas: charging station, data, and market (see Figure 3). Note that the same paper can appear in multiple categories since e.g., one paper can have keywords data and charging station.
Figure 3. Hierarchy of keywords for related work search.
The “data” science part is covered with keywords: analysis (1140 results), prediction (370 results), and big data (81 results). Since the keyword analysis returned 1140 different results, that branch was further extended with keywords: descriptive, context, and behavior so we can differentiate studies that analyze the effect of surroundings (context analysis), and the effect of user behavior on EVs. This group of papers is especially interesting, since this group can cover more topics, including the ones mentioned before (i.e., charging stations and market).
The “market” part covers the area of economics. That branch of related papers is further extended with keywords: forecast and review with 129 and 479 papers with those keywords. Papers in this area are mainly focused on market penetration, battery prices, and the forecast of previously mentioned.
Lastly, the “charging stations” keyword covers the area of energy informatics, after further extending the search for keywords: deployment and location, in this branch of related papers, there were 182 and 264 papers respectively.
The detailed taxonomy of keywords used for the related work is depicted in Figure 3. Each child node is derived from the search results of the parent node (e.g., the keyword prediction returns 370 papers that are all between 1705 papers that were returned by search with the keyword data). After this step, relevant papers were hand-picked after reading their abstract and with regard to the number of citations and relevance for the area of interest.
All papers in this review that are published before 2011 are taken directly from the references of papers found with the previously described method, because of their high relevance and value for the respective research field. The final number of papers that were processed in this review is 96.
3. Role and Sources of Data in the Electric Vehicle Domain
Nowadays, data is one of the most important components in all fields of research which is not surprising as the amount of data generated is constantly growing [23,24]. For example, Kaggle is one of the most popular community-driven data science platforms, that provides numerous interesting datasets and organizes competitions in solving various data science problems [25]. The increase of the data that is being generated is especially significant in the field of transportation, since the transportation sector is responsible for one of its biggest evolutionary steps since the second industrial revolution—electrification of vehicles [26]. The increased flow of data greatly impacts the energy informatics field, as stated byWatson et al. [27,28]: the higher granularity of data the better information system can be developed for optimizing the energy consumption in highly complex systems. The data in this interdisciplinary research field can be obtained through different sources and with different methods. We now describe some of the most popular data sources and methods for data gathering that are used in EV-related studies.
Data repositories have a significant role in enforcing studies in this field since aggregated data they provide can help scientists to conduct the research without the need to perform data collection. Some of the most popular EV-related data repositories besides Kaggle include:
• Alternative fuels data center [29] which contains data about EV sales and charging stations for each state of USA; • Alternative fuel vehicle data [30] which also contains information about alternative fuel vehicles for USA; • EV volumes [31] that contains informations about world sales of EVs; and • data.gov [32] which is a search platform for various datasets.
The valuable data can also be collected through publicly available APIs (application programming interface). Frequently utilized APIs in this research field are:
• Nokia HERE API that is used for routing and calculating distances between geographical coordinates with many advanced parameters, similarly to Google Maps API and Open Street Map API; • Oplaadpalen API that provides information about charging stations around the world same as Open charge map; and • Vehicle API by edmunds that provides the data about vehicles (e.g., manufacturer or engine type).
Besides data repositories and APIs, surveys can also be valuable source of the data. For example, the National Household Travel Survey [33] is an organization that conducts various surveys and provides results via their Web page. If the regulated data is not available, researchers may opt to conduct surveys themselves.
The data can also be obtained through companies. The example of a third-party data provider is ElaadNL, one of the charging infrastructure providers in the Netherlands. It often collaborates with researchers providing them the data about their charging infrastructure transactions [34]. Another example is Renault that is also known to share their data with researches in order to analyze their vehicles’ potential [35].
Some researchers have developed their own methodology for data gathering. For example, the authors in [14,36] conceptualized data gathering of EV-related data by combining data provided by a company as well as several APIs. The other method is to use existing on-board sensors or to install new sensors for collecting and transmitting the data to the cloud for research purposes. Svendsen et al. [37] have developed previously described methodology to derive the EV driving patterns.
In contrast to the above-mentioned research examples, in which the data is available from the deployed system, researches of the energy systems of the future often use simulations to augment the existing data and to tackle interesting research challenges. For example, Babic et al. [38] have developed the agent-based simulation model which as a result provides the data about different business models (in article referred as parking policies) related to charging service. Studies by Ketter et al. [39,40] also employ simulation platforms to obtain data for solving various problems in the field of energy informatics.
One of the common divisions of the data is into primary and secondary data [41]. Primary data is the data collected with methods specifically developed for solving domain-specific problem (i.e., Table 1: Smart ED Platform and manual data collection methods), while secondary data is the data that is collected by someone other than the user (e.g., Table 1: data repositories, or the National Household Travel Survey).
All previously described data gathering methodologies are summarized in Table 1. Category ‘other’, means that the data is initially created to be private but can be shared with others for scientific reasons.
Table 1. Data gathering methodology with examples and tariff model for each data source.
.
4. EV Market: Data for Modelling Economic Factors
The EV market is an interesting field of research, because it does not only cover the sales number, but also innovations and current trends in the EV industry from the marketing perspective, (potential) EV owners motivations, constraints, and various forecasts (e.g., sales, battery capacity, etc.). Statistics about the number of EVs and prices are given through various reports on global and local scale.
The number of EVs is growing more and more each year, however the growth is not as steep as expected, as stated by Carty [55], United States, in 2009, invested over 2 billion dollars into development and subsidies for electric cars with goal to increase the number of EVs in US to at least 1 million until the end of 2015. Since at the end of 2016 the number of EVs in US was around 570,000 (Figure 4), one can conclude that the goal was not reached despite the forecasts. One of the main reasons behind that fact is range anxiety and the unfamiliarity of the potential EV owners with the electric vehicles, as we described in Section 4.1. More recent reports [56] suggest that in the 2017 and 2018 cumulative sales of BEVs and PHEVs was around 550,000 which almost doubles the number of EVs in the USA.
Figure 4. The number of electric vehicles (EVs) from 2010 to 2016 in the USA (annually and cumulative), derived from [6,57].
In contrast to well-established car manufacturers of internal combustion engines (ICVs), EV-only manufacturers such as Tesla, become well known in the last decade due to popularity of EVs [58], and they are partially responsible for speeding up the transition to EVs (i.e., competition with other car manufacturers was one of the factors for traditional ICE car manufacturer switching to EVs [59]).
Another fact that supports the claim that EVs are the future of private and public transportation is the end of ICE vehicles (i.e., removing ICE vehicles from the market). Great Britain and France set the year 2040 as the year when ICE vehicles will be removed from the market, and every vehicle that is sold will have electric motor [60–62]. Germany had a similar initiative; the plan was to ban ICE vehicles from the market by 2030, which was proven to be unrealistic and therefore declined [63]. Other countries that have the same initiatives to ban the ICE vehicles are either highly developed and environmentally friendly countries (e.g., Netherlands or Norway) or countries with great air pollution (e.g., India or China) [64].
Figure 5 depicts the popularity of EVs in the global market by the end of 2016. As it can be seen, despite Tesla’s advanced technology, due to the price of the competitors’ vehicles, it is not the most popular option. Instead, Nissan Leaf takes the first spot with nearly 40% market share, although, Tesla plans to change that with the introduction of their Model 3 with the best price-to-range ratio [58].
Figure 5. The global market share of the most popular EVs according to the survey [6].
4.1. EV Acceptance
To increase potential EV owner’s familiarity with electric vehicles, research based on the potential EV owner’s preferences (e.g., range, speed, and comfort) is crucial. The following paragraphs describe studies for parameters that have the highest influence on a decision to buy or not to buy an EV in five regions with the highest EV market penetration. Figure 6 depicts the main findings of those studies. The focus is on the potential EV owners and each circle represents the factor that influences the potential EV owners (i.e., the inner circle is positive, while outer is the most negative).
Figure 6. Factors that influence potential EV owners’ decision to buy EV.
Ko and Hahn 65 stated the importance of knowing the potential EV owner’s preferences about electric vehicles. They further research their preference through the questionnaire among 250 households at the end of June 2009 in Korea. They used six key attributes to asses the willingness to pay for an EV: battery price, holding tax, subsidies type, subsidies level, battery swappability, and availability of recharging infrastructure. As expected, potential EV owners are willing to pay more if EV has a swappable battery and if charging infrastructure is developed and easy to access, since that considerably lowers the range anxiety. The consumers also prefer lump-sum payment over the installment payment of subsidies. This research was of great importance for car manufacturers, governments, and the charging infrastructure providers, because it gives an insight into user preferences for adoption of EVs.
Wee et al. 66 looked into subsides and what effect they have on the EV adoption rate. Authors used rich data set from 50 U.S. states about semi-annual new EV registrations from 2010 to 2015 to develop subsidy-dependent models. Authors conclude that 1000 $ increase in the subsidies for the specific model in a specific state led to around 10% increase in that model registrations number.
Zhang et al. [67] presented a framework used to estimate the elasticity of the demand and supply of EVs. Authors took into consideration the price of EVs, their technology, and incentives (i.e., bus lane access, toll waiver, and charging station density). To test their framework, the data from the organization of actors in the transport sector in Norway was used. The data consists of BEV sales from 2011 to 2013. The authors confirmed their hypothesis that the price is a negative factor, while innovative car technology is a very significant positive factor. Incentives are also positive factors, except access to bus lanes, which in the case of personal consumers can be negative. There is also a significant difference between personal and business potential EV owners—business potential EV owners are less affected by price and technology. However, this work could be further improved by adding the estimated influence of other incentives (e.g., taxes, subsidizing the purchase of EVs) or different data, since Norway has a very specific EV market (i.e., around 25% of vehicles on the road are electric [6]). Authors also stated that higher density of charging stations has a high influence on potential EV owners; since 2013, battery technology has improved and range that EVs can cover has nearly doubled, which means that charging station density should not be critical, but instead smart allocation of charging stations is highly important.
As the studies before, research from Hidrue et al. [68] is based on the data from more than five years ago, collected using on-line survey with the purpose to asses the willingness to pay for electric vehicles. The data was collected in US for 2009. Attributes that were taken into consideration were: price, driving range, time to charge for 50 km driving range, acceleration, pollution, the fuel cost of a preferred gas vehicle. Attributes price and pollution are compared to a preferred gas vehicle. With statistical methods, authors found that driving distance, charging time, performance, and pollution (in that order) have a high impact on potential EV owners. The most important factor is saving (i.e., compared to gas vehicles, since the price of electricity is lower than the price of gas). Authors have explained that behavior with interest to save fuel since long drives consume more fuel. The survey also suggests that younger, educated, and people with a green lifestyle are more likely to buy a EV.
Hoen and Koetse [69] conducted similar research as previous authors. In the Netherlands survey was conducted among 15,221 households with one or more cars (2011). Attributes considered were: car type, price, monthly cost, driving range, recharge/refueling type, additional detour time to reach a fuel or charging station, number of available models, and policy measure. Results show that potential EV owners prefer more conventional technologies (i.e., gas-fueled cars), than alternative fueled vehicles. The main reasons behind that were limited driving range and long refueling time. The novelty of this work is the segmentation of participants into second-hand and new buyers, where second-hand buyers are more sensitive about price than new car buyers. This paper stated that low range and high refueling times are the main factors behind lower acceptance of EVs.
Tanaka et al. [13] explore differences between US and Japanese potential EV owners regarding alternative fueled vehicles. The dataset used was collected over an on-line survey, with around 4000 participants from each state. Attributes used in this model were: purchase price, fuel cost (compared to gas-fueled vehicles), driving range, emission reduction (compared to gas-fueled vehicles), alternative fuel availability (share from all refueling stations), and home plug-in construction fee. Results show that US citizens are more sensitive about price reduction and availability of refueling stations than Japanese, while they are similarly influenced by a driving range and emission reductions. This work also presents an interesting overview for 4 States in US: California, Texas, Michigan, and New York. California has around 50% higher willingness to pay for price reduction than the other three states. The authors concluded, that in the future, due to technology advancement, the share of the alternative-fueled vehicles on the market would be doubled.
Smith et al. [70] conducted similar research as the studies before, but in the year 2017. Using a survey platform, 440 households in Australia were questioned about their preferences in a vehicle choice. As much as 48% answered that electric vehicle is their first choice of vehicle. The most influential negative factor on the potential EV owners is not the low range (i.e., small battery capacity), instead, it is recharging infrastructure availability. As opposed to the previous studies that concentrate assumptions on the social-demographic factor, this research stated that far more important factors are the attitude towards the environment and the technology.
Between newer studies, the notable ones, beside the study by Smith et al. [70] is study by Wang et al. [71] and Anderson et al. [72]. Wang et al. [71] in their paper presents the incentives for the purchase of EVs that are currently active in China and develop a model for the forecast of EV acceptance based on the linear regression. The data used in this research is sales numbers from 41 pilot cities and from the 37 cities with no purchase restriction. For each scenario (i.e., 41 cities and 37 cities), linear regression was performed for BEVs and PHEVs with independent socio–economic variables (e.g., population size, income per capita). The only common factor that was proven to be extremely significant for all cases was the density of charging stations. Other notable factors that influence the decision to purchase the EV in this research are education level and license fee. Anderson et al. [72] applied survey methods to analyze EV owner’s preferences about the charging infrastructure. Authors concluded that more public chargers are needed and that slower chargers are acceptable on more visited locations, while fast chargers are needed on less frequently visited locations.
Previous studies are summarized in Table 2, with factors that were taken into consideration, and the factors that have proven to be the most influential for the (potential) EV owners.
Table 2. Comparison of important factors for purchasing electric vehicles.
.
4.2. EV Future Sales
When it comes to exploring future sales of EVs, most of the studies in this field use either agent-based modeling or conjoint analysis methods, very few studies use other methods.
Agent-based modelling is a computational method that observes interaction and evolution of complex objects (i.e., agents) [75]. Agents enable reproduction of complex social interactions, which other methods (e.g., game theory or other equation-based models) cannot as stated by Janssen [76]).
Agent-based modeling was used in by Yang et al. [77], Sullivan et al. [78], and Shafiei et al. [79]. All those studies define multiple agents: consumer population and car population. Studies [77,78] additionally define government and gas supplier agents, while in [77] charger and grid operators are also defined.
Besides the agent-based model, Yang et al. [77] define the system dynamics model that enables authors to analyze the impact of various parameters on the evolution of the defined EV ecosystem. On the case study of China, authors derived results for both models. Firstly according to the results of the system dynamics model, with time, ownership of EVs will grow, while expectedly, ownership of conventional vehicles will drop. Agent-based modeling is used to simulate EV adoption in three types of regions: developed, middle-developed, and underdeveloped. According to the simulation, by 2030, the market share of EVs in developed and middle-developed regions will be between 80% and 90%, while underdeveloped regions will have share of 30%.
Sullivan et al. [78] have used agent-based simulation for the forecast of PHEV adoption rates on the United States market. Complex model, although again without social interactions, provides accurate results for near-future prediction. Market penetration is predicted for 2015 and for 2020. For 2015 results show that sales of PHEVs could reach 2–3% while market penetration would be 1%, which is accurate for US market. The prediction for 2020 is that sales could reach 4–5% while fleet penetration would reach only 2%. This model also explores the role of subsidies, without them, the penetration on the market would be below 1%.
A similar study was conducted using the case study of Iceland by Shafiei et al. [79]. This model does not take into consideration complex dependencies between car manufacturers, energy grid, providers of charging infrastructure, or gas suppliers. Instead, this paper is more focused on the interaction between (potential) EV owners and factors that influence them: marketing, word of mouth, and indirect word of mouth. Predictions developed with this model vary from market share of 70% all to 100% by 2040, dependant on the price of gasoline and the price of EVs.
Another group of studies is about conjoint analysis (i.e., survey-based statistical technique) and choice-based modeling. studies in this field date all to the late 1990s (e.g., Segall [80]), those research results are not applicable today because of different levels of knowledge about EVs. Despite that, those studies have greatly influenced some of the notable studies today.
Glerum et al. [35] have research what influences sales of Renault EV in Switzerland. Their research is based on a survey conducted in 2011. The survey was structured in two phases: stated preferences (i.e., information about vehicles in the respondent’s households) and choice situation (i.e., three different cars similar to their own). To interpret survey results, the author used statistical models: logit and latent variable model. The framework itself is not generated towards annual forecasting, but instead for forecasting market share when certain parameters are changed (e.g., price of EVs, monthly cost, subsidies, etc.). Similar work that does not focus on annual growth rates to 1981, and uses survey where participants ranked 16 cars. Beggs et al. [81] also used logistic model to interpret results.
Using the data from the same year as previous authors, Lebeau et al. [47] analyzed the adoption of BEVs and PHEVs in Belgium based on conjoint choice modeling. The novelty of this research is in the fact that authors modeled the future choice as the weighted function of car utilities (e.g., speed, acceleration, airbags, etc.). The forecast is that the number of PHEVs will be higher than the number of BEVs in the near future (i.e., the prediction was made up to 2030). The baseline is the penetration in the time research was conducted, which was around 4.85% for both PHEVs and BEVs. Prediction for 2020 is 13% while for 2030 it is 45%.
Another work that introduces novelty is studied by Jensen et al. [46]. The authors of this paper created the survey with participants before and after driving the EV. The survey was conducted in Norway, Denmark, and Netherlands since they represent the most developed countries in Europe (EV wise). With basic model assumptions (i.e., assuming EV technology will only improve, which would lower the EV price) model resulted in the prediction of 40% market share for 2020. The problem with this model is the assumption, new technologies do not mean necessarily lower prices. Also, the prediction is consistent with the penetration today, which for Norway is around 30%.
Between notable studies are two papers from 2012, Higgins et al. [44] and Eggers [45]. The first one was conducted based on the survey in Australia. It combines methods of choice modeling, multi-criteria analysis, and Bass diffusion model. The framework is used to analyze adoption patterns in consideration of factors that are important for the potential EV owners. The developed framework estimates the penetration of 45% by 2030. This research also gives insight into the adoption of EVs based on monthly income. The second research is based on the data from Germany, and same as the first research uses a combined method for prediction, choice and diffusion modeling. Predictions from that model are that penetration EVs and PHEVs will be around 55%, which is not the case. The model would have more reliable results if it included human interaction factor [82].
Table 3. Comparison of studies on forecasting future sales of electric vehicles (EVs).
.
There are two distinguished studies that use none of the methods used above. The first one is a paper by Becker et al. [84], in which the author used simple Bass diffusion that is typically used to describe the process of how new products get adopted. The result is the most interesting part of that research, dated to 2009. It forecast the number of EVs on the US market to approximately 600,000 by 2016, which is accurate according to the global EV outlook for the year 2016 [6]. The reason behind that accuracy is that authors did not only model potential EV owner’s behavior, but oil prices, internal combustion car cost, and other parameters. The article goes further in time, and predicts the 64% of sales and 24% of the fleet (i.e., around 2.8 million) will be EVs by 2030. Other work is Zhang et al. [83]. This research uses multivariate and univariate time-series models for forecast based on the 60-month sales data in China, from January 2011, to December 2015. This work besides the forecast of EV market growth presents the comparison of the two before mentioned models (similar to Du andWitt [85] in the domain of tourism demand). Since the univariate model is used for short term forecast, in contrast to multivariate model (Chayama and Hirata [86]), that methodology is applied in this research too. For the short term forecast (i.e., end of 2017, around 350,000 EVs should be sold). For long term forecast (i.e., 2020) more than 1 million EVs should be sold. Besides from the economic point of view, research from Li et al. [87] forecast the number of EVs with the goal to balance the demand for electricity supply.
The majority of studies in this research area are from developed countries that are focusing their research and development on renewable energy sources. Since the EV industry is not yet fully developed, the market penetration forecast is mainly for the long future (i.e., 15+ years). More details about the main findings are summarized in the Table 3.
5. EV Infrastructure: Data for Modelling Technical Factors
The previous section dealt with challenges in EV market penetration and acceptance (see first three actors in Figure 2). This section summarizes the studies with the main focus on charging infrastructure, vehicle-to-grid technologies, and users’ driving patterns concerning charging and energy balancing.
5.1. Batteries
Batteries are the crucial part of electric vehicles and they are directly connected with EV acceptance rate, as described in previous paragraphs (e.g., range anxiety, charging infrastructure, price, etc.). There are many studies relevant to EV battery, although, not many in the field of data science. The most information about battery capacities and prices are available through global reports and price lists. However, there are some studies about the second use potential of EV batteries like Nauber et al. [88] and [89]. Both works are motivated with restrictions for market penetration growth due to battery cost. The first work is oriented towards defining second-use for retired EV lithium-ion batteries which could partially recover the cost of the battery. Authors concluded that using retired EV batteries as uninterruptible power supply, instead of lead-acid batteries, is more effective and would result in payback through seven years. With various factors in mind (e.g., price of new battery or price of repurposing), authors calculated that the price of the repurposed battery would range from 38–132 $/kWh. The second paper is earlier work of the same authors where they introduce their plan to research the second-use of EV batteries.
Ahmadian et al. [90] reviewed the various studies on battery degradation models and compared them with each other. Ahmadian et al. concluded that degradation of batteries is primarily caused by two factors: (i) time degradation and (ii) cycle degradation. Time degradation is dependant on temperature and the age of the battery, while cycle degradation is dependant on the number of charging cycles and the depth of discharge. The main contribution in research by Ahmadian et al. is a conceptual framework that enables the use of batteries degradation models for smart grid studies.
From the market perspective, the best situation of current trends is given in the report [6]. Figure 7 depicts the prices of battery in from 2010 to 2015. As can be seen, the prices stagnate from 2013 to 2015, those prices are relevant even today. Prices stay the same because of physical restrictions (e.g., materials used and dimensions) and because of the lack of mass battery production. Tesla plans to change that with its Gigafactory that would mass-produce the batteries [91]. To produce battery with higher capacity, one of the options is to build a larger battery. The problem with large batteries is safety, the larger the battery is, the greater the chances are that it will break. Ruiz et al. [18] extensively reviewed the standards for safety testing of batteries.
The rest of the studies that do not belong in the electrical engineering field are closely related to the prediction of the state of charge (SOC) and prediction of available range in the future based on various factors and past development.
Figure 7. Battery prices, derived form [6,92].
5.2. Charging Stations
Charging stations are in this state of development, underdeveloped [93,94]. They are an important factor in the acceptance of EVs as a primary transport solution, since the problem of range anxiety is closely dependent on the number of charging stations [9]. Charging stations can be categorized based on the speed of charging and ownership. Based on the charging speed chargers are divided into four types. Level-1 charging is a synonym for charging a car via the household outlet of 120 volts. Level-2 charging chargers at the 240 volts and provides five times faster charging than Level-1. Level-3 and Level-4 charging is also known as fast-charging since it provides energy for approximately 125 miles per hour, depending on a type of vehicle. Based on the ownership, the charging stations can be divided as private chargers and public chargers. Private chargers are considered those that are installed in someone’s home or as private ownership of someone (e.g., private firm parking). Public chargers are available to anyone, and they are the main focus of the majority of researchers, since, data related to public charging stations are more accessible than for private chargers [95]. The future of charging stations is in the wireless chargers that can be placed under the road and ensure charging even while driving [96].
5.2.1. Deployment
Charging station deployment is one of the most challenging tasks, since it is not enough to simply place charging station somewhere, it is important to strategically place charging station on the right location. This subsection will provide survey of studies and their methods towards achieving that goal. Most of them can be divided into two categories, weather they use real-world data or simulation data, majority of studies in this field are either optimization problems or simulation, as can be seen in Table 4.
Table 4. Categorization of studies about charging station (CS) deployment based on data and methodology.
.
He et al. [104] proposed a mathematical framework for the macroscopic deployment of charging stations taking into account the equilibrium between demand and supply of energy. User’s desire to choose a destination was formulated based on: time, price, and availability of chargers. Supply-side was formulated as the price of providing electricity. This paper focuses on a large scale charging station (CS) deployment and this framework is able to answer only how many CSs should be deployed in a certain region—specific location of CS cannot be determined.
Ip et al. [52] implements a two-step approach to decide optimal location for new CS. Although research methodology is similar to the one authors of the previous paper used, this one provides a more accurate location for CS. The first step is to determine pieces of roads that are utilized the most and to divide them into x–y grid. The second step is to cluster those squares in the grid based on the intensity of road utilization and to apply an optimization algorithm to decide the most suitable cluster for CS deployment. This method uses the data generated by various sensors on the road (assuming there are sensors) and the limitation of this study is that collecting the data needed for calculations is impossible out of specifically developed areas. However, this work proposes the framework that itself is general and can be applied whenever there is a need for deciding the optimal location for something (e.g., train station or restaurant).
Frade et al. [105] on the case study of Lisbon, Portugal, implements an optimization model (i.e., maximize coverage) for CS deployment taking into account coverage of a single charging station between 400 and 600 m walking distance and the demand for CS. To estimate the number of EVs, regression was used with parameters: the size of household, building type, age, education, and employment. With those parameters, an accurate model for the number of cars can be derived, but the number of EVs was further estimated with information about EV penetration. The demand for charging stations was calculated independently for day and night time, since those two time intervals have completely different patterns. This work, however, does not account for increasing EV penetration, and for factors that influence utilization of charging stations (e.g., places of interest), therefore, charging stations could be underutilized.
Chen et al. [100] deals with the charging station deployment problem from the perspective of car parking. Firstly, based on the data from Washington state, parking space and duration were determined. This information was used to build a regression model for zone-level parking demands and trip-level parking demands. The last step is using mixed linear integer programming to chose the optimal place for charging stations based on minimization of price and distance between zones that have great parking demand. This model has proven to be fast and reliable, but it does not include data only on electric cars—for parking location and duration. The location of existing charging stations has great influence on EV owner parking behavior. As opposed to previous studies, this one besides mathematical programming uses regression for forecasting demand for zone and trip level parking, which is valuable information for different fields of research.
Xi et al. [106] have developed a model for deploying charging stations in a way that maximizes their use by private EV owners. The model does not use real-world data concerning charging stations, EVs, or driving patterns, instead, based on the number of population and households, authors have estimated the number of cars, and with the 1% EV penetration—number of EVs. The trip data was artificially generated by Mid-Ohio Regional Planning Commission. Using the integer programming optimization technique, the authors calculated an optimal number of charging stations in each traffic analysis zone. Another finding of this study is that a combination of level 1 (i.e., 1.4 kWh) and 2 (i.e., 4 kWh) chargers is the most efficient, but with not enough funds, only level 1 chargers should be deployed.
Yan et al. [53] tested their optimization method on the case study based on the 30-day taxi trace with 315 taxis and 4638 landmarks in Rome. Optimization methods goal is to maximize the flow of vehicles, with constraints to budget, charging availability, EV battery capacity, and energy consumption. With their algorithm, under different budget scenarios authors calculated the optimal number of charging stations at each landmark. This work has a simplified environment, where authors assumed that the cost of deploying charging stations is the same for all charging stations, and that cars and drivers are homogeneous, which is not the case in reality. There are many social factors that influence the driving patterns, charging stations are only one of many.
The following studies, while also using optimization methods, base their optimization techniques on genetic and greedy algorithms.
Research by Hess et al. [101] aims to decide the optimal location of a charging station based on the genetic optimization algorithm. The only data that is used in this research is the map of Vienna, parameters of electric cars, and the location of gas stations – this research as initial location of charging stations assumes the location of gas stations. The optimization function used is to minimize the whole trip time of an electric vehicle owner. This research extended the well-known traffic simulation tool SUMO with electric vehicle behavior. This work could be further improved by taking into account positions of current charging stations instead of gas stations.
Mehar and Senouci [102] are proposing a genetic algorithm that takes into consideration area traffic density, land cost, infrastructure cost, investment cost, transportation cost toward the CS, charging station capacity and, energy grid capability. To optimize the placement of charging stations, authors propose to minimize two objective functions: minimize the objective cost and minimize the transportation cost. The algorithm was tested on a simulation that describes the traffic in Cologne (Germany) from 6 a.m. to 8 a.m., since that time window is considered to be peak hour. The algorithm is fast but lacks some context information. It does not take into consideration the proximity of charging stations to public transport, or shops. Even if traffic is dense in a certain area, the population of cars in that area does not have to be comprised of EVs (i.e., authors assumed EV rate).
As opposed to previous studies, research by Sadeghi et al. [103] has a goal to optimally place fast chargers in the urban area. Fast chargers have the capability to fully charge EV battery in 20–30 min [110]. The approach is based on genetic optimization algorithm, with no EV related dataset. Authors have defined six test scenarios: minimize all cost, ignore land cost, ignore the cost for EV owners, ignore the electric grid loss, no electricity charge to CS owners, private sector invest in CSes. Authors decided to set the minimal distance between charging stations to 3 km, and considering previous scenarios they proposed optimal positioning of fast-charging stations. This work is greatly significant considering the amount of research about deploying fast-charging stations. Xie et al. [107] are also dealing with the challenge of fast charger deployment. They tackled the challenge in three phases: (i) 2015–2019, (ii) 2020–2024, and (iii) 2025–2029. Authors developed optimization-based model that serves as a decision support system for policymakers for where, when, and how many fast chargers should be deployed.
A study by Vaziveh et al. [99] is using real-world data collected through the cell phone data over the Boston area, and with that, whole trip of a user was known. The goal of that research was to minimize the aggregate distance all drivers have to drive, from the end of their intended trip to the nearest charging station. Methods used to achieve previously described goal were: greedy and genetic algorithm. With those heuristic algorithms, near-optimal locations of charging stations can be found. Although the algorithm used in this paper includes the parameter charging station coverage, which limits the number of charging stations, it does not include the cost of new charging stations, or contextual information if a user really needs to charge on the end of the trip, which makes this model currently not reliable. While this work uses a genetic algorithm with the same goal as the previous two studies, this one builds the model with real-world data.
The next three studies are based on machine learning techniques. First, two uses only clustering, enhancing it with mathematics. The second research uses out-of-the-box machine learning algorithms to forecast utilization of charging stations and decide where another one could be deployed. Naturally, both studies use real-world data.
Andrenacci et al. [97], used the demand-side approach to decide the best placement for new CSes. Data used in this work is real traffic flow (i.e., GPS data) from 6% of privately owned cars in Rome. The assumption is that all of those are electric (i.e., switch to electric transportation). All destinations that ended in Rome’s urban area are further clustered in sub-areas where charging infrastructure is associated with the center of a cluster. The next step is to mathematically calculate the demand for energy, the sum of all energy spent to arrive at the goal, and that is the number of CSs needed in that area. This method has high-quality data, and valuable division of Rome urban area into sub-areas. However, the number of CSes is not reliable, since the assumption is that all vehicles are electric (i.e., full conversion to electric transportation) and that all vehicles can satisfy their energy needs without queuing. This work does not provide an exact location where CS should be deployed, rather the number of CSs in a specific sub-area.
Momtazpour et al. [98] used a synthetic dataset because of the lack of real-world data. Authors take into consideration the duration of charging and decided to place chargers in locations that people visit for an extended period of time. The region of Portland was divided into three clusters: high electricity load-low charging need-low stay duration, low electricity load-high charging need-high stay duration, and low electricity load-low charging need-low stay duration. Based on the cluster description, the second cluster is ideal for deployment of charging stations: it can handle electricity load since it is low, there is a need for more chargers, and people stay there for an extended period of time. This work included places of interest in their research and the energy load making it significant and highly valuable.
Pevec et al. [36] has developed a real-world, data-driven, generic framework for extending EV charging infrastructure. The data used in that framework is from ELaadNL, one of the biggest charging infrastructure providers in the Netherlands. The data consist of all transactions for four consecutive years (i.e., 2013–2016). The first part of the framework clusters existing charging stations in clusters based on the distance between them with the hierarchical clustering method. After charging stations have been clustered into zones, in each zone utilization of charging stations was calculated and used as the dependent variable in the machine learning algorithm. The framework uses machine learning algorithm XGBoost to predict utilization when certain parameters are changed. Parameters taken into consideration were: places of interest, EV penetration, time of day, number of charging stations in the defined zone, number of competitors charging stations, and is it weekend or weekday, since it has a drastic effect on charging pattern. The third part of the framework based on the optimization function provided decides the best zone to place another charging station. The precision of the framework is (i.e., the place where another charging station should be deployed) is dependant on the distance that clusters are based on.
The last category in research in this field is simulation-based research. Those research do not use real-world data, only some information to tune the simulation. All the relevant data is generated by simulation itself.
Sweda and Klabjan [108] have developed and described an agent-based decision support system for the placement of charging stations. Although, they use real-world data for prices and sales numbers of electric vehicles, most of the parameters are artificially tuned (e.g., driving patterns, state of charge, etc.) with randomness. This study manages to implement social interactions between car owners and with that it is possible to simulate the decision to buy EV and increase the EV population in the system. Another feature of the model is to compare sales of alternative fuelled cars with a dependency to fossil fuel prices. This work is based on the area of Chicagoland. The model is tested against two different proposed charging station placements. When comparing results with the current state in that area, improvement can be noticed. The major downside of this approach is that it does not offer a possible location for CS, it analyses the placement provided to it. An updated version of the research is provided in a full report by Sweda and Klabjan [109].
Authors Lu and Hua [51] developed a location-sizing model for the charging station. The goal is to optimize the location and the size (i.e., number of plugs) of a charging station, based on the demand. Their model is based on queuing theory and it is a continuation of earlier work by Capar et al. [111].
As we mentioned before, range anxiety is one of the greatest challenges left to overcome in order to raise EV acceptance, and it is closely related to the development of charging station infrastructure. Even though the capacity of the EV battery is nominally enough for intra-city traversal, the familiarity with the existing gas station infrastructure greatly influences potential EV owners in the decision not to buy an EV. Pevec et al. assessed the range preferences of potential EV owners considering the settlement hierarchy based on the settlement population [112]. As for the inter-city traversal, most of the EVs do not have sufficient battery capacity and this is the prime example of the range anxiety. One of the solutions considered by the researchers is the deployment of charging stations along the highway near existing gas stations, since they have necessary infrastructure [113,114].
Another major challenge in the field of the charging station deployment is the capacity of electric power distribution networks capacity. As mentioned in Section 4 the number of EVs is expected to grow, and that could cause major issues since the demand for electricity could be higher than the supply. Wange et al. [115], Abdalrahman and Zhuang [116], and Masoum et al. [117] took an approach to the charging station development considering previous limitations, i.e., ensuring reduced power loss of distribution systems.
In this Section the problem of charging station infrastructure development was investigated, and one of the conclusions is that the behavior of EV owners is extremely important for strategical planning of the charging infrastructure. Therefore, the next Section will explore user charging behavior.
5.2.2. User Charging Behavior
Section 4 explored the behavior of potential EV owners, and assumed the behavior of the EV owners based on the behavior of the owners of traditional fossil-fueled vehicles. This section explores the user behavior in more detail, since it is not only important for the charging infrastructure providers and the EV manufacturers, it is also important for the power grid management.
Qian et al. described [118] four different scenarios of user charging patterns with the goal of modeling the load demand of the energy grid. The first presented scenario was uncontrolled domestic charging which is characterized with no incentive for owners to charge off the peak hours. The second scenario is uncontrolled off-peak domestic charging where incentives to charge the EV in off-peak hours have been introduced. Smart domestic charging is defined as charging accordingly to the real-time electricity rate to decrease the cost for EV owners and to decrease the load on the energy grid. The last scenario is presented as uncontrolled public charging throughout the day where a certain share of EVs charge at the working place on the public chargers. Besides describing the charging patterns of the EV owners, this research compares that behavior with the load of energy grid.
Koroleva et al. [119] have introduced their research in progress about exploring the demand response of EV owners in response to the price of the electricity. Factors that authors considered in their model are range anxiety, uncertainty about the travel, risk attitude, and social influence. The model uses a simulated EV environment to observe the driving and charging behavior of EV owners. In the future authors plan to implement the mobile application that would use that model to visually describe patterns when certain factors change.
To determine a load on the energy grid, researchers Taylor et al. [120], in the scope of a larger project, have developed a framework that is based on the data acquired by the National Household Travel Survey [121]. Based on the traveled distance, the battery state of charge is estimated and assuming that PHEV owner charges the vehicle to the full capacity, load on the energy grid can be calculated. An interesting observation in this work is about the traveled distances and the times of home departures/arrivals. The longer the traveling time is, the earlier is the time of departure. The energy grid is under heavier load around 5 PM which correspondent with the times of PHEV owners arriving at home from work—this leads to the conclusion that PHEV owners are likely to charge their vehicle when they arrive to home.
Like the previous study, Kelly et al. [122] are basing their research on the data provided by the National Household Travel Survey and also describes users charging behavior at home based on different parameters. The peak in energy grid load is highest around 8 p.m., and noticeably higher on weekdays than on the weekends. Load on the energy grid caused by EV charging is never zero, since at all times cars are charging. After analyzing the impact of battery capacity on the load, authors concluded that increased battery capacity does not only increase the magnitude of the load on the energy grid, but also shifts it in time (i.e., the peak will occur later than with the batteries with smaller capacity). From the demographic aspect, the authors concluded that the households with the highest income generate peaks in the energy grid load 41% higher than the households with lower income and the households with lower income have earlier peaks. Regardless of the driver sex, based on the sample provided by NHTS, the older population generate a peak in the load earlier than the younger people.
Dealing with the same problem as previous studies (i.e., energy grid integration), Shao and Rahman [123] also derived conclusions about the EV owners charging behaviors. Using the same data (i.e., NHTS) that indicates that cars are parked for more than 90% of the time and that arrivals to home from work are in different times of the day, authors calculated (again based on the distance traveled and battery state of charge) that the peak occurs at 6 p.m. with one hour variance.
As opposed to the previous research, the next studies do not describe patterns of EV owners charging and driving behavior as a consequence of solving a different problem, but as a problem on its own.
Develder et al. [48] conducted research that is based on determining EV owners’ charging patterns. Two different real-world datasets were used, each one belonging to the different EV charging infrastructure providers (ElaadNL and iMove). Based on clustering the arrival and departure times of EV to the charging station, charging session has been classified as park to charge when charging times are scattered through the day and the duration of charging session is not much longer than the time needed to charge the EV, charging near home sessions are characterized with departure times in the morning, and with the arrivals in the evening. Lastly, charging sessions have been also classified as charging near work where departure times are in the evening and the arrival times are in the morning. Besides this conclusion, with simple statistics, authors also concluded the pattern differences between weekdays and weekends. The contribution of this work is not only in the previously stated conclusions, but in the fact that previously stated conclusions were drawn for two infrastructure providers and compared between them.
Frenkie and Krems [124] investigated the EV owner driving and charging behavior using the data collected from travel and charging diaries from EV owners provided by EV and private charging station. The dataset contains only information from Monday to Friday, since weekends have atypical patterns. The average distance per user for a day is 38 km, while the maximum distance traveled without recharging is 124.9 km. The charging patterns are different than in most studies, since this study uses private charging stations that are available to the EV owners, and they can charge their car when needed, not when the opportunity arrives. On average, users charged 3.1 times per week, while the charging event occurred when the remaining capacity is around 30% or below 15%, which is also when the car system notifies the owner about the state of charge.
Bingham et al. [54] used the data collected from the Smart ED platform (i.e., platform for collecting the data from pure electric driven two-seat passenger car). Based on the data it was calculated that battery consumption is equivalent to 1.275% of the battery state of charge, which leads to the conclusion that, on average, the EV in this case study can travel 78.4 km on full battery (i.e., from 71 km to 88 km). Authors concluded that reducing the amount of accelerating and decelerating, a significant amount of energy can be saved, which would extend the driving distance of EV.
Pevec et al. [14] have reported as a part of their contributions the statistics which depicts EV owners charging behavior on the case of Netherlands, based on the dataset provided by one of the charging infrastructure providers in the Netherlands (i.e., ElaadNL). This research describes utilization of EV charging stations through different time intervals (i.e., hourly, daily, and yearly), on the hourly basis there are two peaks in the utilization levels, around 8 a.m. and 5 p.m., which corresponds with the time of EV owners arrival to work and to home from work, also, the utilization of parking spaces follow that pattern with the drop in utilization right before the peaks in the charging stations utilization-EV owners and on the road, thus parking space is unoccupied. On the daily basis, authors concluded that there is no difference in utilization patterns on weekdays, but the weekdays greatly differ from weekends where utilization has only one peak midday. On the yearly basis, utilization has a significant drop during the summer, when people usually go on a vacation. Besides the user charging behavior, this research also describes utilization from the charging station perspective (e.g., is charger located near home, or near the workplace, how specific chargers are utilized, etc.). Figure 8 depicts a comparison of charging station and parking spot utilization per hour of the day where previously described behaviors can be observed.
Figure 8. Comparison of hourly charging station and parking spot utilization, taken from [14].
Babic et al. [43,125] in their research have modeled the willingness to pay for charging service. The model used three control variables: charging speed, referent electricity price, and state of charge. Based on the randomize values for control variables, users answered the survey (deployed via Qualitrics) with the price they are willing to pay for the charging service (i.e., answers were collected using Mechanical Turk, crowd-sourcing platform). After collecting the data, multiple linear regression model was developed with the goal to analyze the influence of certain variable and the combination of variables on the willingness to pay for charging service. As a continuation of this research, Dorcec et al. [126] extended this methodology with the information about the time-of-the-day when EV is being charged. This research, as well as previous research, confirmed the hypothesis that referent price and state of charge have a great role in EV owners willing to pay for a charging service.
One of the most common conclusions in this research area is about user charging times, i.e., when are they charging their car, and for how long, which is important for managing the electricity demand and supply. Besides the demand and supply, this information can also be used for smart charging station placement [14]. More interesting observations related to user charging behavior are represented in Table 5.
Table 5. EV owners’ charging behavior and patterns.
.
5.3. Vehicle-To-Grid
Vehicle-to-grid (V2G) is a concept of a process in which electric vehicles provide power to the energy grid while parked and connected to a charger, since most of the time, the car is parked and thus, battery unused (Clement et al. [127]). With this method, owners of EVs can return some of the cost, since providing electricity to the grid would be compensated (e.g., free charging, money) (see Figure 2—bidirectional energy exchange between EV-CS and CS-energy grid). A simple scenario of V2G technology is as follows when there is a high demand for electricity, electric vehicles that are parked and connected to the charger would discharge and when overall energy consumption is low, they would charge. The vast majority of work in this area is focused on the implementation of V2G technology. However, some researchers are focused on scheduling and the impact of the realization of that technology.
He et al. [128] have developed an optimization framework for scheduling EV charging and discharging times. First, they solve the problem of minimization of the cost on a global scale. This approach has proven to be inefficient, since, it assumes that the arrival times and load during the day is known in advance. The second problem was defined on a local scale (i.e., EVs that perform charging and discharging in one parking lot). This approach is applicable on a larger scale, and is resilient to dynamic EV arrival. The authors tested their framework on a case study involving the data Toronto on 21 August 2009. The simulation results indicated that the local scheduling can achieve results close to those on a global scale.
Wang et al. [74] have defined V2G EV as an electric vehicle that has low driving time and high parking time, which ideally describes personal vehicles. The goal of this study was to analyze the impact of EV charging on energy grid load. Authors propose three models: uncontrolled charging where user randomly charges EV, controlled charging by tariff structure (charge during off-peak hours), and controlled charging/discharging (charge during off-peak, discharge during on-peak hours). The first model as expected has proven to be the worst during peak hours, while the second and third models improved the load of the power grid during peak hours. The third model was able to efficiently exchange energy with the power grid and further flatten the load curve.
Soares et al. [129] utilize Particle Swarm Optimization (population-based stochastic optimization, similar to the genetic algorithm, Kennedy [130]) to tackle the problem of energy management with a high number of V2G capable EVs. This paper introduces a method that is for the order of magnitude faster than standard non-linear programming, and can find an optimal solution in a matter of seconds, which is of great importance for the day-ahead planning.
In this area of research, there are some studies that focus on energy grid load balancing with agent-based modeling: Kahlen et al. [131], Vytelingum et al. [132], Kamboj et al. [133], Valogianni et al. [134], and Ramchurn et al. [135]. All those studies have defined their own models with agents (e.g., car, electricity provider) with different behavior (e.g., electricity storage provider has a goal to maximize the cost, EV owners charge randomly).
More extensive research on vehicle-to-grid EV integration is provided in research by Mwasilu et al. [136].
Currently, vehicle-to-grid technologies are tested in Netherlands with the collaboration with Stedin, GE, Renault, and ELaadNL [137], and in USA, PG&E are converting company-owned Prius to V2G PHEVs at Google campus, while Xcel Energy is converting six Ford Escape Hybrids into V2G capable vehicles as described by Fang et al. [138].
6. Discussion
Throughout the paper, EV-related studies from fields of green transportation, energy informatics, and economics are reviewed and summarized in a systematic way by using the data science perspective (see Section 2), as explained in Figure 1. The described research area is gaining an increase in popularity with the growing trend of EVs on the market [6]. Up until now, the data science approaches, methods, and tools in the domain of EVs were present only in a small number of studies, since the research focus was mainly on the electrical engineering aspect (i.e., the number of EVs was not large enough for implementing solutions based on the data science and there was no enough data). However, the situation is changing what can be noted from a growing number of EV-related data science research papers. Consequently, data science is becoming a highly relevant approach for green transportation, energy informatics, and EV-related economics studies. Researchers are actively cooperating with the industry since there is no conventional way to gather the EV-related data and the private, i.e., company-owned, data is the most used source in various studies (e.g., [48,139]). Following paragraphs will consolidate main scientific observations for research problems covered in the paper: EV acceptance, EV market penetration, charging station deployment, and EV owner charging behavior.
Based on the insights in Section 4, EV acceptance is usually tackled with conjoint analysis with different factors considered, e.g., range anxiety, education, age, and income. The most important factors in EV adoption are proven to be government incentives and high availability of charging stations which consequentially lowers range anxiety. Negative influence on the EV adoption rate is mostly long recharging times and low range with a fully charged battery. The second part of Section 4 deals with the research problem of predicting EV future sales. Researchers in the sales forecast field mostly use analysis based on the historical data and well established statistical approaches or simulations that mimic potential owners’ adoption rate and other complex EV environment interactions. Some of the studies analyzed in this paper, i.e., those that are dated before 2015, have accurate predictions for the near future and very optimistic predictions for the period of the next 10 years (i.e., growth around 30–40%).
Section 5 deals with the charging station deployment and user charging behavior, which has proven to be valuable information for deciding the location for new charging stations. Both research problems employ similar methods to tackle their respective challenges: data analysis, machine learning, mathematical programming, and simulations, with the emphasis on the latter two. Majority of studies about EV owners charging patterns have similar conclusions: EV owners are most likely to charge their car when they arrive to work and to home from work, i.e., peaks in the charging station utilization are around 8 a.m. and 5 p.m. Besides the charging station deployment, charging behavior is an important aspect in research related to energy grid load demand optimization. The next observed challenge, the one dealing with the deployment of charging stations, is nowadays the most important since it directly impacts EV adoption and consequentially the development of EVs. While being extremely important, the EV charging infrastructure is generally underdeveloped due to short existence. Lack of data in this research area is the reason why researches are mainly employing methods of mathematical programming and simulations. For now there is no generally applicable method for deployment of charging stations, since, to the best of the author’s knowledge, the existing studies are specific and cover either specific area, i.e., due to simulation restrictions, or specific case, e.g., macro/micro deployment or deployment along the highways. Finally, one of the greatest challenges in this domain is the adaptation of existing energy infrastructure to accommodate the EV charging needs. This challenge is being tackled by the smart charging research, partially discussed in the Section 5.3. In order to offload the energy grid, it is important to determine in which time intervals the electric vehicle should be a charge, should it be used as energy storage during the peak load times, and how to manage the EV battery to satisfy both the owner’s needs and the energy grid.
7. Conclusions
This paper is a data science perspective review of the multi-disciplinary research area centered around electric vehicles. The review was systematically performed using specific keywords, as explained in Section 2, which ensured a detailed overview of data-driven research performed in the field of EVs in the period from 2011 to 2018.
Based on the presented review, we conclude that data science should be today widely used to solve various EV-related challenges. The EV-related data is nowadays generated from numerous sources such as road sensors, vehicles, and EV charging stations. Furthermore, industry more and more provides researchers with otherwise private data and catalyzes the development of high-quality data-driven research. Of course, both researchers and industry need to be careful about what and how data can be shared and analyzed not to compromise data and end-user privacy, where data (pseudo-)anonymization methods will play an important role. However, it is not only that a data-driven approach is nowadays possible for the EV-related research, but such an approach is sometimes necessary and very often it generates beneficial added value. There are various emerging research problems that cannot be tackled using traditional methods, such as mathematical programming. An example is the smart charging station management, i.e., deploying, removing, and re-allocating charging stations. There are numerous research initiatives that aim to solve this problem by not using real-world data that requires setting many assumptions, making them less accurate and consequentially lowering their applicability in real-world scenarios.
Based on the analysis in the paper, we identified two most important unsolved challenges in the research field of EVs, when observed from the perspective of data science: data acquisition and methodology for charging station deployment.
Sources of EV-related data nowadays exist, but are still scarce. The most common way of acquiring the data is either through the cooperation with private companies or through proprietary devices developed for the research purpose, what presents a major obstacle for producing high-quality data science research in the EV area even though the amount of data being generated from EVs and charging stations is growing every day.
The importance of the generalized methodology for charging station deployment is already elaborated in this paper. A potential solution lies in using open access to charging station data, which will enable designing and fine-tuning of advanced machine learning algorithms, and other data science approaches, for charging station deployment. In their future work, the authors plan to propose the data-driven computational framework for charging station deployment.
Author Contributions: Conceptualization of this research was performed by J.B., V.P. and D.P. Methodology, as well as the investigation was done by D.P. D.P. prepared the initial draft of the paper, while J.B. and V.P. performed reviewing and editing. Visualization and analysis was preformed by D.P., while J.B. and V.P. supervised the work and acquired funding.
Funding: This research received no external funding.
Acknowledgments: The authors acknowledge the support of the Croatian Science Foundation under the grant DOK-2015-10-1777. This research has also been partly supported by the European Regional Development Fund under grants KK.01.1.1.01.0009 (DATACROSS), KK.01.2.1.01.0020 (RASCO-FER-SMART-EV) and KK.01.2.1.01.0077 (bigEVdata). Conflicts of Interest: The authors declare no conflict of interest.
References
1. International Energy Agency. Global EV Outlook 2018; International Energy Agency: Paris, France, 2018. [Google Scholar]
2. Babcock, L.R., Jr. A combined pollution index for measurement of total air pollution. J. Air Pollut. Control Assoc.1970, 20, 653–659. [Google Scholar] [CrossRef]
3. Saber, A.Y.; Venayagamoorthy, G.K. Plug-in vehicles and renewable energy sources for cost and emission reductions. IEEE Trans. Ind. Electron.2011, 58, 1229–1238. [Google Scholar] [CrossRef]
4. Granovskii, M.; Dincer, I.; Rosen, M.A. Economic and environmental comparison of conventional, hybrid, electric and hydrogen fuel cell vehicles. J. Power Sources2006, 159, 1186–1193. [Google Scholar] [CrossRef]
5. Nykvist, B.; Nilsson, M. Rapidly falling costs of battery packs for electric vehicles. Nat. Clim. Chang.2015, 5, 329–332. [Google Scholar] [CrossRef]
6. International Energy Agency. Global EV Outlook 2016; International Energy Agency: Paris, France, 2016. [Google Scholar]
8. Neubauer, J.; Wood, E. The impact of range anxiety and home, workplace, and public charging infrastructure on simulated battery electric vehicle lifetime utility. J. Power Sources2014, 257, 12–20. [Google Scholar] [CrossRef]
9. Rauh, N.; Franke, T.; Krems, J.F. Understanding the impact of electric vehicle driving experience on range anxiety. Hum. Factors2015, 57, 177–187. [Google Scholar] [CrossRef]
10. Hender, B. Recent developments in battery electric vehicles. Proc. Inst. Electr. Eng.1965, 112, 2297–2308. [Google Scholar] [CrossRef]
11. Jeremy, K.; McKellen, P.; Williams, K.; Rees, M.; Pearson, G.; Bird, B.; Harlen, R.; Brown, J.; Winn, R.; Hender, B. Discussion on Recent Developments in Battery Electric Vehicles. Proc. Inst. Electr. Eng. Lond.1966, 113, 1809. [Google Scholar]
12. Golob, T.F.; Kitamura, R.; Bradley, M.; Bunch, D.S. Predicting the market penetration of electric and clean-fuel vehicles. Sci. Total Environ.1993, 134, 371–381. [Google Scholar] [CrossRef]
13. Tanaka, M.; Ida, T.; Murakami, K.; Friedman, L. Consumers’ willingness to pay for alternative fuel vehicles: A comparative discrete choice analysis between the US and Japan. Transp. Res. Part A Policy Pract.2014, 70, 194–209. [Google Scholar] [CrossRef]
14. Pevec, D.; Kayser, M.; Babic, J.; Carvalho, A.; Ghiassi-Farrokhfal, Y.; Podobnik, V. A Computational Framework for Managing Electric Vehicle Charging Infrastructure. In Proceedings of the 9th international Exergy, Energy and Environment Symposium, Split, Hrvatska, 14–17 May 2017. [Google Scholar]
15. Babic, J.; Carvalho, A.; Ketter, W.; Podobnik, V. Extending parking lots with electricity trading agent functionalities. In Proceedings of the Workshop on Agent-Mediated Electronic Commerce and Trading Agent Design and Analysis (AMEC/TADA 2015)@ AAMAS, Istanbul, Turkey, 4 May 2015. [Google Scholar]
16. Buamod, I.; Abdelmoghith, E.; Mouftah, H.T. A review of OSI-based charging standards and eMobility open protocols. In Proceedings of the 2015 6th International Conference on the Network of the Future (NOF), Montreal, QC, Canada, 30 September–2 October 2015; pp. 1–7. [Google Scholar]
18. Ruiz, V.; Pfrang, A.; Kriston, A.; Omar, N.; Van den Bossche, P.; Boon-Brett, L. A review of international abuse testing standards and regulations for lithium ion batteries in electric and hybrid electric vehicles. Renew. Sustain. Energy Rev.2017, 81, 1427–1452. [Google Scholar] [CrossRef]
19. Yilmaz, M.; Krein, P.T. Review of battery charger topologies, charging power levels, and infrastructure for plug-in electric and hybrid vehicles. IEEE Trans. Power Electron.2012, 28, 2151–2169. [Google Scholar] [CrossRef]
20. Van Der Aalst, W. Data science in action. In Process Mining; Springer: New York, NY, USA, 2016; pp. 3–23. [Google Scholar]
24. Bichler, M.; Heinzl, A.; van der Aalst, W.M. Business Analytics and Data Science: Once Again? Bus. Inf. Syst. Eng.2017, 59, 77–79. [Google Scholar] [CrossRef]
25. Your Home for Data Science. Available online: https://www.kaggle.com/ (accessed on 23 December 2018).
26. Russell Hensley, S.K.; Pinner, D. Electrifying cars: How three industries will evolve. Mckinsey Q.2009, 3, 87–96. [Google Scholar]
27. Watson, R.T.; Boudreau, M.C.; Chen, A.J. Information systems and environmentally sustainable development: Energy informatics and new directions for the IS community. MIS Q.2010, 34, 23–38. [Google Scholar] [CrossRef]
28. Watson, R.T.; Howells, J.; Boudreau, M.C. Energy Informatics: Initial thoughts on data and process management. In Green Business Process Management; Springer: New York, NY, USA, 2012; pp. 147–159. [Google Scholar]
30. U.S. Energy Information Administration-EIA-Independent Statistics and Analysis. Available online: https://www.eia.gov/ (accessed on 23 December 2018).
35. Glerum, A.; Stankovikj, L.; Thémans, M.; Bierlaire, M. Forecasting the demand for electric vehicles: Accounting for attitudes and perceptions. Transp. Sci.2013, 48, 483–499. [Google Scholar] [CrossRef]
36. Pevec, D.; Kayser, M.; Babic, J.; Carvalho, A.; Ghiassi-Farrokhfal, Y.; Podobnik, V. A Data-driven Framework for Extending Electric Vehicle Charging Infrastructure. In Proceedings of the Winter Conference on Business Analytics, Snowbird, UT, USA, 2–4 March 2017. [Google Scholar]
37. Svendsen, M.; Winther-Jensen, M.; Pedersen, A.B.; Andersen, P.B.; Sørensen, T.M. Electric vehicle data acquisition system. In Proceedings of the 2014 IEEE International Electric Vehicle Conference (IEVC), Florence, Italy, 17–19 December 2014; pp. 1–7. [Google Scholar]
38. Babic, J.; Carvalho, A.; Ketter, W.; Podobnik, V. Evaluating Policies for Parking Lots Handling Electric Vehicles. IEEE Access2018, 6, 944–961. [Google Scholar] [CrossRef]
39. Ketter, W.; Collins, J.; Reddy, P. Power TAC: A competitive economic simulation of the smart grid. Energy Econ.2013, 39, 262–270. [Google Scholar] [CrossRef]
40. Ketter, W.; Peters, M.; Collins, J.; Gupta, A. A Multiagent Competitive Gaming Platform to Address Societal Challenges. MIS Q.2016, 40, 447–460. [Google Scholar] [CrossRef]
41. Hox, J.; Boeije, H. Data collection, primary versus secondary. Encycl. Soc. Meas.2005, 1, 593. [Google Scholar]
42. Babic, J.; Carvalho, A.; Ketter, W.; Podobnik, V. Modeling Smart Parking Lots through a Discrete-Event Simulation. In Proceedings of the 2016 Winter Conference on Business Intelligence (WCBI), Sandy, UT, USA, 3–5 Mar 2016. [Google Scholar]
43. Babic, J.; Carvalho, A.; Ketter, W.; Podobnik, V. Estimating Profitability of EV-enabled Parking Lots: A Simulation-based Approach. In Proceedings of the Workshop on Information Technology and Systems (WITS), Dublin, Ireland, 15–16 December 2016. [Google Scholar]
44. Higgins, A.; Paevere, P.; Gardner, J.; Quezada, G. Combining choice modelling and multi-criteria analysis for technology diffusion: An application to the uptake of electric vehicles. Technol. Forecast. Soc. Chang.2012, 79, 1399–1412. [Google Scholar] [CrossRef]
45. Eggers, F.; Eggers, F. Where have all the flowers gone? Forecasting green trends in the automobile industry with a choice-based conjoint adoption model. Technol. Forecast. Soc. Chang.2011, 78, 51–62. [Google Scholar] [CrossRef]
46. Jensen, A.F.; Cherchi, E.; Mabit, S.L.; Ortúzar, J.D. Predicting the potential market for electric vehicles. Transp. Sci.2016, 51, 427–440. [Google Scholar] [CrossRef]
47. Lebeau, K.; Van Mierlo, J.; Lebeau, P.; Mairesse, O.; Macharis, C. The market potential for plug-in hybrid and battery electric vehicles in Flanders: A choice-based conjoint analysis. Transp. Res. Part D Transp. Environ.2012, 17, 592–597. [Google Scholar] [CrossRef]
48. Develder, C.; Sadeghianpourhamami, N.; Strobbe, M.; Refa, N. Quantifying flexibility in EV charging as DR potential: Analysis of two real-world data sets. In Proceedings of the 2016 IEEE International Conference on Smart Grid Communications (SmartGridComm), Sydney, Australia, 6–9 November 2016; pp. 600–605. [Google Scholar]
49. Bikcora, C.; Refa, N.; Verheijen, L.; Weiland, S. Prediction of availability and charging rate at charging stations for electric vehicles. In Proceedings of the 2016 International Conference on Probabilistic Methods Applied to Power Systems (PMAPS), Beijing, China, 16–20 October 2016; pp. 1–6. [Google Scholar]
50. Babic, J.; Carvalho, A.; Ketter, W.; Podobnik, V. On the Profitability of the Smart Parking Lots. In Proceedings of the 2015 Winter Conference on Business Intelligence (WCBI), Snowbird, UT, USA, 12–14 March 2015. [Google Scholar]
51. Lu, F.; Hua, G. A location-sizing model for electric vehicle charging station deployment based on queuing theory. In Proceedings of the 2015 International Conference on Logistics, Informatics and Service Sciences (LISS), Barcelona, Spain, 27–29 July 2015; pp. 1–5. [Google Scholar]
52. Ip, A.; Fong, S.; Liu, E. Optimization for allocating BEV recharging stations in urban areas by using hierarchical clustering. In Proceedings of the 2010 6th International Conference on Advanced Information Management and Service (IMS), Seoul, Korea, 30 November–2 December 2010; pp. 460–465. [Google Scholar]
53. Yan, L.; Shen, H.; Li, S.; Huang, Y. Electrical Vehicle Charging Station Deployment based on Real World Vehicle Trace. In Proceedings of the International Conference on Internet of Vehicles, Nadi, Fiji, 7–10 December 2016. [Google Scholar]
54. Bingham, C.; Walsh, C.; Carroll, S. Impact of driving characteristics on electric vehicle energy consumption and range. IET Intell. Transp. Syst.2012, 6, 29–35. [Google Scholar] [CrossRef]
56. Gohlke, D.; Zhou, Y. Assessment of Light-Duty Plug-In Electric Vehicles in the United States, 2010–2018; Technical Report; Argonne National Lab. (ANL): Argonne, IL, USA, 2019. [Google Scholar]
65. Ko, W.; Hahn, T.K. Analysis of consumer preferences for electric vehicles. IEEE Trans. Smart Grid2013, 4, 437–442. [Google Scholar] [CrossRef]
66. Wee, S.; Coffman, M.; La Croix, S. Do electric vehicle incentives matter? Evidence from the 50 US states. Res. Policy2018, 47, 1601–1610. [Google Scholar] [CrossRef]
67. Zhang, Y.; Qian, Z.S.; Sprei, F.; Li, B. The impact of car specifications, prices and incentives for battery electric vehicles in Norway: Choices of heterogeneous consumers. Transp. Res. Part C Emerg. Technol.2016, 69, 386–401. [Google Scholar] [CrossRef]
68. Hidrue, M.K.; Parsons, G.R.; Kempton, W.; Gardner, M.P. Willingness to pay for electric vehicles and their attributes. Resour. Energy Econ.2011, 33, 686–705. [Google Scholar] [CrossRef][Green Version]
69. Hoen, A.; Koetse, M.J. A choice experiment on alternative fuel vehicle preferences of private car owners in the Netherlands. Transp. Res. Part A Policy Pract.2014, 61, 199–215. [Google Scholar] [CrossRef]
70. Smith, B.; Olaru, D.; Jabeen, F.; Greaves, S. Electric vehicles adoption: Environmental enthusiast bias in discrete choice models. Transp. Res. Part D Transp. Environ.2017, 51, 290–303. [Google Scholar] [CrossRef]
71. Wang, N.; Pan, H.; Zheng, W. Assessment of the incentives on electric vehicle promotion in China. Transp. Res. Part A Policy Pract.2017, 101, 177–189. [Google Scholar] [CrossRef]
72. Anderson, J.E.; Lehne, M.; Hardinghaus, M. What electric vehicle users want: Real-world preferences for public charging infrastructure. Int. J. Sustain. Transp.2018, 12, 341–352. [Google Scholar] [CrossRef]
73. Dorcec, L.; Pevec, D.; Vdovic, H.; Babic, J.; Podobnik, V. How do people value electric vehicle charging service? A gamified survey approach. J. Clean. Prod.2019, 210, 887–897. [Google Scholar] [CrossRef]
74. Wang, S.; Zhang, N.; Li, Z.; Shahidehpour, M. Modeling and impact analysis of large scale V2G electric vehicles on the power grid. In Proceedings of the Innovative Smart Grid Technologies-Asia (ISGT Asia), Tianjin, China, 21–24 May 2012; pp. 1–6. [Google Scholar]
75. Helbing, D. Agent-based modeling. In Social Self-Organization; Springer: New York, NY, USA, 2012; pp. 25–70. [Google Scholar]
77. Yang, W.; Zhou, H.; Liu, J.; Dai, S.; Ma, Z.; Liu, Y. Market evolution modeling for electric vehicles based on system dynamics and multi-agents. In Proceedings of the 2015 International Symposium on Smart Electric Distribution Systems and Technologies (EDST), Vienna, Austria, 8–11 September 2015; pp. 133–138. [Google Scholar]
78. Sullivan, J.L.; Salmeen, I.; Simon, C. PHEV Marketplace Penetration: An Agent Based Simulation; Technical Report for Transportation Research Institute: Ann Arbor, MI, USA, July 2009. [Google Scholar]
79. Shafiei, E.; Thorkelsson, H.; Ásgeirsson, E.I.; Davidsdottir, B.; Raberto, M.; Stefansson, H. An agent-based modeling approach to predict the evolution of market share of electric vehicles: A case study from Iceland. Technol. Forecast. Soc. Chang.2012, 79, 1638–1653. [Google Scholar] [CrossRef]
80. Segal, R. Forecasting the market for electric vehicles in California using conjoint analysis. Energy J.1995, 16, 89–111. [Google Scholar] [CrossRef]
81. Beggs, S.; Cardell, S.; Hausman, J. Assessing the potential demand for electric cars. J. Econom.1981, 17, 1–19. [Google Scholar] [CrossRef]
82. Pentland, A.; Liu, A. Modeling and prediction of human behavior. Neural Comput.1999, 11, 229–242. [Google Scholar] [CrossRef]
83. Zhang, Y.; Zhong, M.; Geng, N.; Jiang, Y. Forecasting electric vehicles sales with univariate and multivariate time series models: The case of China. PLoS ONE2017, 12, e0176729. [Google Scholar] [CrossRef]
84. Becker, T.A.; Sidhu, I.; Tenderich, B. Electric Vehicles in the United States: A New Model with Forecasts to 2030; Center for Entrepreneurship and Technology, University of California, Berkeley: Berkeley, CA, USA, 2009; Volume 24. [Google Scholar]
85. Du Preez, J.; Witt, S.F. Univariate versus multivariate time series forecasting: An application to international tourism demand. Int. J. Forecast.2003, 19, 435–451. [Google Scholar] [CrossRef]
86. Chayama, M.; Hirata, Y. When univariate model-free time series prediction is better than multivariate. Phys. Lett. A2016, 380, 2359–2365. [Google Scholar] [CrossRef][Green Version]
87. Li, F.; Dou, C.; Xu, S. Optimal Scheduling Strategy of Distribution Network Based on Electric Vehicle Forecasting. Electronics2019, 8, 816. [Google Scholar] [CrossRef]
88. Neubauer, J.S.; Pesaran, A.; Williams, B.; Ferry, M.; Eyer, J. A Techno-Economic Analysis of PEV Battery Second Use: Repurposed-Battery Selling Price and Commercial and Industrial End-User Value; Technical Report for SAE International: Troy, MI, USA, April 2012. [Google Scholar]
89. Neubauer, J.; Pesaran, A.A. NREL’s PHEV/EV Li-Ion Battery Secondary-Use Project; National Renewable Energy Laboratory: Lakewood, CO, USA, 2010. [Google Scholar]
90. Ahmadian, A.; Sedghi, M.; Elkamel, A.; Fowler, M.; Golkar, M.A. Plug-in electric vehicle batteries degradation modeling for smart grid studies: Review, assessment and conceptual framework. Renew. Sustain. Energy Rev.2018, 81, 2609–2624. [Google Scholar] [CrossRef]
92. Boyd, S. Batteries and Electrification R and D Overview; Department of Energy: Washington, DC, USA, 2018. [Google Scholar]
93. Dharmakeerthi, C.; Mithulananthan, N.; Saha, T. Planning of electric vehicle charging infrastructure. In Proceedings of the Power and Energy Society General Meeting (PES), Vancouver, BC, Canada, 21–25 July 2013; pp. 1–5. [Google Scholar]
94. Nilsson, M.; Habibovic, A. Identifying EV drivers needs for information communication technology to ease the EV charging process. In Proceedings of the Adjunct 5th International Conference on Automotive User Interfaces and Interactive Vehicular Applications (AutoUI) 2013, Eindhoven, The Netherlands, 28–30 October 2013; pp. 13–16. [Google Scholar]
96. Miller, J.M.; Onar, O.C.; White, C.; Campbell, S.; Coomer, C.; Seiber, L.; Sepe, R.; Steyerl, A. Demonstrating dynamic wireless charging of an electric vehicle: The benefit of electrochemical capacitor smoothing. IEEE Power Electron. Mag.2014, 1, 12–24. [Google Scholar] [CrossRef]
97. Andrenacci, N.; Ragona, R.; Valenti, G. A demand-side approach to the optimal deployment of electric vehicle charging stations in metropolitan areas. Appl. Energy2016, 182, 39–46. [Google Scholar] [CrossRef]
98. Momtazpour, M.; Butler, P.; Hossain, M.S.; Bozchalui, M.C.; Ramakrishnan, N.; Sharma, R. Coordinated clustering algorithms to support charging infrastructure design for electric vehicles. In Proceedings of the ACM SIGKDD International Workshop on Urban Computing, Beijing, China, 12 August 2012; pp. 126–133. [Google Scholar]
99. Vazifeh, M.M.; Zhang, H.; Santi, P.; Ratti, C. Optimizing the deployment of electric vehicle charging stations using pervasive mobility data. arXiv2015, arXiv:1511.00615. [Google Scholar] [CrossRef]
100. Chen, T.D.; Kockelman, K.M.; Khan, M. The electric vehicle charging station location problem: A parking-based assignment method for Seattle. In Proceedings of the Transportation Research Board 92nd Annual Meeting, Washington, DC, USA, 13–17 January 2013; Volume 340. [Google Scholar]
101. , A.; Malandrino, F.; Reinhardt, M.B.; Casetti, C.; Hummel, K.A.; Barceló-Ordinas, J.M. Optimal deployment of charging stations for electric vehicular networks. In Proceedings of the First Workshop on Urban Networking, Nice, France, 10 December 2012; pp. 1–6. [Google Scholar]
102. Mehar, S.; Senouci, S.M. An optimization location scheme for electric charging stations. In Proceedings of the 2013 International Conference on Smart Communications in Network Technologies (SaCoNeT), Paris, France, 17–19 June 2013; Volume 1, pp. 1–5. [Google Scholar]
103. Sadeghi-Barzani, P.; Rajabi-Ghahnavieh, A.; Kazemi-Karegar, H. Optimal fast charging station placing and sizing. Appl. Energy2014, 125, 289–299. [Google Scholar] [CrossRef]
104. He, F.; Wu, D.; Yin, Y.; Guan, Y. Optimal deployment of public charging stations for plug-in hybrid electric vehicles. Transp. Res. Part B Methodol.2013, 47, 87–101. [Google Scholar] [CrossRef]
105. Frade, I.; Ribeiro, A.; Gonçalves, G.; Antunes, A. Optimal location of charging stations for electric vehicles in a neighborhood in Lisbon, Portugal. Transp. Res. Rec.2011, 2252, 91–98. [Google Scholar] [CrossRef]
106. Xi, X.; Sioshansi, R.; Marano, V. Simulation–optimization model for location of a public electric vehicle charging infrastructure. Transp. Res. Part D Transp. Environ.2013, 22, 60–69. [Google Scholar] [CrossRef]
107. Xie, F.; Liu, C.; Li, S.; Lin, Z.; Huang, Y. Long-term strategic planning of inter-city fast charging infrastructure for battery electric vehicles. Transp. Res. Part E Logist. Transp. Rev.2018, 109, 261–276. [Google Scholar] [CrossRef]
108. Sweda, T.; Klabjan, D. An agent-based decision support system for electric vehicle charging infrastructure deployment. In Proceedings of the Vehicle Power and Propulsion Conference (VPPC), Chicago, IL, USA, 6–9 September 2011; pp. 1–5. [Google Scholar]
109. Sweda, T.M.; Klabjan, D. Agent-Based Information System for Electric Vehicle Charging Infrastructure Deployment. J. Infrastruct. Syst.2014, 21, 04014043. [Google Scholar] [CrossRef]
110. Botsford, C.; Szczepanek, A. Fast charging vs. slow charging: Pros and cons for the new age of electric vehicles. In Proceedings of the International Battery Hybrid Fuel Cell Electric Vehicle Symposium, Stavanger, Norway, 13–16 May 2009. [Google Scholar]
111. Capar, I.; Kuby, M.; Leon, V.J.; Tsai, Y.J. An arc cover–path-cover formulation and strategic analysis of alternative-fuel station locations. Eur. J. Oper. Res.2013, 227, 142–151. [Google Scholar] [CrossRef]
112. Pevec, D.; Babic, J.; Carvalho, A.; Ghiassi-Farrokhfal, Y.; Ketter, W.; Podobnik, V. Electric Vehicle Range Anxiety: An Obstacle for the Personal Transportation (R) evolution? In Proceedings of the 2019 4th International Conference on Smart and Sustainable Technologies (SpliTech), Split, Croatia, 18–21 June 2019; pp. 1–8. [Google Scholar]
113. Sathaye, N.; Kelley, S. An approach for the optimal planning of electric vehicle infrastructure for highway corridors. Transp. Res. Part E Logist. Transp. Rev.2013, 59, 15–33. [Google Scholar] [CrossRef]
114. Jia, L.; Hu, Z.; Song, Y.; Zhan, K.; Ding, H. Planning of electric vehicle charging stations in highway network. Autom. Electr. Power Syst.2015, 39, 82–89. [Google Scholar]
116. Abdalrahman, A.; Zhuang, W. A survey on PEV charging infrastructure: Impact assessment and planning. Energies2017, 10, 1650. [Google Scholar] [CrossRef]
117. Masoum, A.S.; Deilami, S.; Moses, P.; Masoum, M.; Abu-Siada, A. Smart load management of plug-in electric vehicles in distribution and residential networks with charging stations for peak shaving and loss minimisation considering voltage regulation. IET Gener. Transm. Distrib.2011, 5, 877–888. [Google Scholar] [CrossRef]
118. Qian, K.; Zhou, C.; Allan, M.; Yuan, Y. Modeling of load demand due to EV battery charging in distribution systems. IEEE Trans. Power Syst.2011, 26, 802–810. [Google Scholar] [CrossRef]
119. Koroleva, K.; Kahlen, M.; Ketter, W.; Rook, L.; Lanz, F. Tamagocar: Using a simulation app to explore price elasticity of demand for electricity of electric vehicle users. In Proceedings of the Thirty Fifth International Conference on Information Systems, Auckland, New Zealand, 14–17 December 2014; pp. 1–8. [Google Scholar]
120. Taylor, J.; Maitra, A.; Alexander, M.; Brooks, D.; Duvall, M. Evaluation of the impact of plug-in electric vehicle loading on distribution system operations. In Proceedings of the Power & Energy Society General Meeting (PES’09), Calgary, AB, Canada, 26–30 July 2009; pp. 1–6. [Google Scholar]
121. Vyas, A.; Santini, D. Use of national surveys for estimating’full’PHEV potential for oil use reduction. In Proceedings of the PLUG-IN 2008 Conference, San Jose, CA, USA, 21–24 July 2008. [Google Scholar]
122. Kelly, J.C.; MacDonald, J.S.; Keoleian, G.A. Time-dependent plug-in hybrid electric vehicle charging based on national driving patterns and demographics. Appl. Energy2012, 94, 395–405. [Google Scholar] [CrossRef]
123. Shao, S.; Pipattanasomporn, M.; Rahman, S. Grid integration of electric vehicles and demand response with customer choice. IEEE Trans. Smart Grid2012, 3, 543–550. [Google Scholar] [CrossRef]
124. Franke, T.; Krems, J.F. Understanding charging behaviour of electric vehicle users. Transp. Res. Part F Traffic Psychol. Behav.2013, 21, 75–89. [Google Scholar] [CrossRef]
125. Babic, J.; Carvalho, A.; Ketter, W.; Podobnik, V. Modelling electric vehicle owners’ willingness to pay for a charging service. In Proceedings of the Erasmus Energy Forum, Rotterdam, The Netherlands, 18–19 May 2016; pp. 1–8. [Google Scholar]
126. Dorcec, L.; Pevec, D.; Vdovic, H.; Babic, J.; Podobnik, V. Exploring Willingness to Pay for Electric Vehicle Charging with Gamified Survey. In Proceedings of the 3rd International Conference on Smart and Sustainable Technologies (SpliTech 2018), Split, Croatia, 26–29 June 2018. [Google Scholar]
127. Clement-Nyns, K.; Haesen, E.; Driesen, J. The impact of vehicle-to-grid on the distribution grid. Electr. Power Syst. Res.2011, 81, 185–192. [Google Scholar] [CrossRef]
128. He, Y.; Venkatesh, B.; Guan, L. Optimal scheduling for charging and discharging of electric vehicles. IEEE Trans. Smart Grid2012, 3, 1095–1105. [Google Scholar] [CrossRef]
130. Kennedy, J. Particle swarm optimization. In Encyclopedia of Machine Learning; Springer: New York, NY, USA, 2011; pp. 760–766. [Google Scholar]
131. Kahlen, M.; Ketter, W. Aggregating Electric Cars to Sustainable Virtual Power Plants: The Value of Flexibility in Future Electricity Markets. In Proceedings of the AAAI, Austin, TX, USA, 25–30 January 2015; pp. 665–671. [Google Scholar]
132. Vytelingum, P.; Voice, T.D.; Ramchurn, S.D.; Rogers, A.; Jennings, N.R. Agent-based micro-storage management for the smart grid. In Proceedings of the 9th International Conference on Autonomous Agents and Multiagent Systems: Volume 1. International Foundation for Autonomous Agents and Multiagent Systems, Toronto, ON, Canada, 10–14 May 2010; pp. 39–46. [Google Scholar]
134. Valogianni, K.; Ketter, W.; Collins, J.; Zhdanov, D. Effective Management of Electric Vehicle Storage Using Smart Charging. In Proceedings of the AAAI, Québec City, QC, Canada, 27–31 July 2014; pp. 472–478. [Google Scholar]
135. Ramchurn, S.D.; Vytelingum, P.; Rogers, A.; Jennings, N. Agent-based control for decentralised demand side management in the smart grid. In Proceedings of the 10th International Conference on Autonomous Agents and Multiagent Systems-Volume 1. International Foundation for Autonomous Agents and Multiagent Systems, Taipei, Taiwan, 2–6 May 2011; pp. 5–12. [Google Scholar]
136. Mwasilu, F.; Justo, J.J.; Kim, E.K.; Do, T.D.; Jung, J.W. Electric vehicles and smart grid interaction: A review on vehicle to grid and renewable energy sources integration. Renew. Sustain. Energy Rev.2014, 34, 501–516. [Google Scholar] [CrossRef]
138. Fang, X.; Misra, S.; Xue, G.; Yang, D. Smart grid—The new and improved power grid: A survey. IEEE Commun. Surv. Tutor.2012, 14, 944–980. [Google Scholar] [CrossRef]
139. Pevec, D.; Babic, J.; Kayser, M.A.; Carvalho, A.; Ghiassi-Farrokhfal, Y.; Podobnik, V. A Data-Driven Statistical Approach for Extending Electric Vehicle Charging Infrastructure. Int. J. Energy Res.2018, 2018, 3102–3120. [Google Scholar] [CrossRef]
Source & Publisher Item Identifier: Electronics 2019, 8(10), 1190; https://doi.org/10.3390/electronics8101190 Received: 2 September 2019 / Revised: 28 September 2019 / Accepted: 13 October 2019 / Published: 18 October 2019 (This article belongs to the Special Issue Electric Vehicles in Smart Grids). URL: https://www.mdpi.com/2079-9292/8/10/1190