Published by Ahmad Rizal SULTAN, Mohd Wazir bin MUSTAFA, Technology University of Malaysia, Faculty of Electrical Engineering
Abstract. The type of generator grounding method and the system configuration determine the choice of ground fault protection. Ground fault generator stator can cause serious damage to the generator. Therefore, the total area of the generator stator windings must be protected against hazardous condition. Because the conventional methods are unable to separate ground faults close to the neutral point of view, there should be a method to protect entire stator winding. The paper discusses ways to discern ground faults for the generator stator. Some suggestions are proposed that can help in ensuring the generator stator ground fault more accurate.
Streszczenie. Stojan wirnika generatora powinien być szczególnie chroniony przed zagrożeniami. Konwencjonalne metody nie są w stanie oddzielić błąd uziemienia w pobliżu punktu neutralnego. W artykule opisano metody zabezpieczeń stojana generatora przed błędami uziemienia (Zabezpieczenia stojana generatora przed błędami uziemienia)
Keywords: Generator Stator, Ground Fault Protection
Słowa kluczowe: stojan generator, uziemienie, zabezpieczenia
Introduction
Synchronous generators are essential part of the power system. Disruption of the generator stator windings, especially in operation, can stop the generator. The process must be greatly detrimental to the generator companies, as this could result to the termination of plant operations, which means less revenue, as well as very high cost of repairing the damaged generator. Due to the importance of the generator stator winding, a protection system that protects the stator from the ground fault (GF) is a necessity.
The general kinds of the generator fault are the GF [1]. For a single line to ground fault near the neutral, the generated voltage available to drive current to the fault is small. The result is a fault with a low current and also a low neutral voltage displacement. At the most extreme, if the GF happens at a neutral point of its own, where no fault current or voltage displacement.
The importance of detecting GF close to the neutral point of the generator is not dependent on the need to trip because of the fault current magnitude, since it may be negligible and will not, in general, cause immediate damage. If a second ground fault occurs, severe damage may be sustained by the machine because this may result in a short – circuit current not limited by the grounding impedance. This condition may be aggravated if the first GF happens close to, or at the neutral terminal of the generator, because all ground relays operating from the neutral point voltage or current will become inoperative. Furthermore, if the second GF occurs in the same winding, the generator differential relay may also become inoperable since this situation can be categorized as an internal winding fault [2].
This paper reviews the various methods used to discern the GF on the generator stator. The most commonly used protections to discern the occurrences of GF on the generator are overcurrent, overvoltage and undervoltage relay. However, due to the development of protection systems, the protection scheme that utilizes disturbance in the ground, especially for a generator today can be categorized into four main sections, namely the conventional method of stator GF protection, third harmonic protection method, injection protection method and numerical protection method.
Ground Fault Protection of a Generator Stator
An overcurrent / overvoltage generator GF protection should be normally straight forward, safe and reliable. However, it has two insufficiencies. First, it will not detect ground faults close to the generator neutral, and second; it is not self-monitoring. This depends on the open circuit where the platform relay, primary or secondary winding of a current transformer or high resistance cannot be detected before a fault occurs. While grounding faults occur in the systems, every parallel generator has the same voltage, and traditional stator winding grounding fault protections with zero sequence voltage cannot detect which generator was faulted [3, 4].
a. Conventional Method of Stator GF Protection
The overvoltage relay (59G) can detect faults approximately 90 – 95% part of stator winding. These protections are illustrated in Figure 1.

There is a linear correlation between the voltage identify by the 59G relay and the GF position in the stator winding. For GFs close the neutral (N), the voltage will be detected by the 59G relay. The maximal voltage happens in a GF at the generator terminals (T), where maximum line-to-neutral voltage happens across the neutral grounding transformer. Commonly, the last 5-10% of the winding is not protected by the 59G. GF at the bottom 10% of the stator winding of the generator may not be sensed by the conventional method of stator GF protection (overvoltage or overcurrent relays).
b. Third Harmonic Protection Method
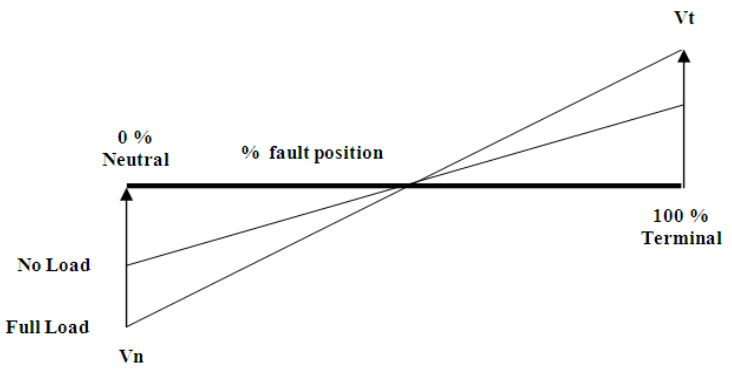
Generally, the output voltage of the generator is not a pure sinusoidal, but distorted by harmonic components. The whole harmonic components generated can be found in triple harmonics as the third harmonic, 9th, 15th and so on. The triple components can be found in all phases and have a large and the same phase angle, which may cause the common point during this phase triple components not to add up to zero for each phase. Therefore, the components appear as triple amount of zero sequences. The third harmonic voltage (THV) is commonly greater than most others triples. Under normal conditions, the characteristics of THV in the stator windings are shown in Figure 2.
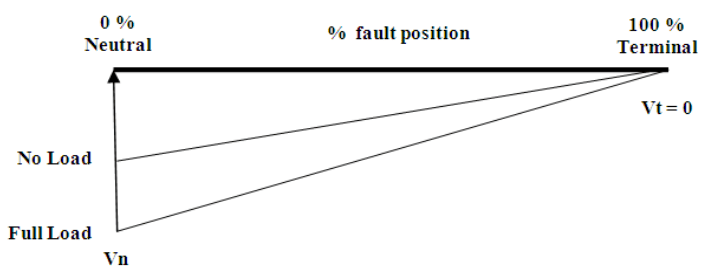
When the GF occurs close to neutral at the generator, the THV at the terminal point will be equivalent to the total third harmonic generator yield. While the voltage of harmonics is in the neutral point, the sum reaches down to zero. The model of THV during GF at a neutral point is shown in Figure 3.

The opposite occurs when a GF develops in terminal point on the generator. The THV in the terminals will drop to zero, while the THV in neutral point increases to a total of all the THV of the generator produced. These characteristics are shown in Figure 4.
Based on the above characteristics, when a GF occurs close to the terminal point, the THV at the neutral will decrease, while the terminal will be enlarged. Similarly, the opposite occurs when it crashes near the terminal point.
The following sections describe the five stators of GF protection using the principle of THV method.
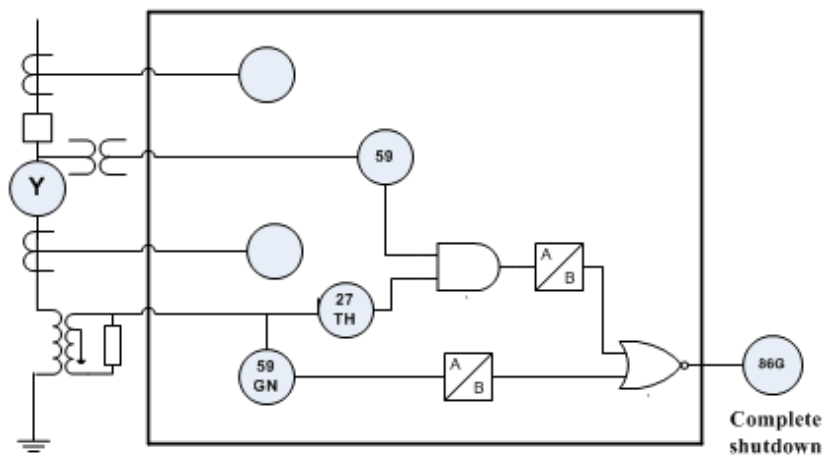
b.1 Third-Harmonic Neutral Undervoltage Relay [4]
This protection method is the combination of the conventional (59G & 27TH) and third harmonic neutral voltage (see Figure 5). The third harmonic was measured across the generator neutral grounding resistor. The basic concept of the scheme is that, when the generator stator GF happens close to the generator neutral, the THV reaches to zero. If the third harmonic generator is a sufficiently neutral voltage as long as normal condition, to avert false operation of the relay from energizing, then such generators are candidates for 100% schemes using third-harmonic neutral detection.
The third harmonic undervoltage relay can detect an absence of THV at the generator neutral resulting from a GF close to the neutral. The 27TH and 59G relays must be filtered to prevent fundamental or third harmonic voltages respectively from affecting the operation. The 27TH relay should, if not self-protected, include circuitry to protect its coil from sustained overvoltage. This scheme offers the advantage of not requiring any additional high-voltage equipment, other than those needed for conventional ground-fault detection schemes for single stator generators.
The scheme can also be used for cross-compound and split-winding machines by adding a second VT and third harmonic relay to monitor the voltage at the neutral of the ungrounded stator winding. The scheme provides protection when the main breaker is open, provided that the terminal voltage is above the pickup of the supervisory relay 59.
Supervision is required during the start-up and shutdown either by using a breaker contact or an undervoltage relay so that the relay is disabled when the generator is off-line. Some generators provide very low levels of THV when the generators are lightly loaded. In order to improve the security of this scheme, an underpower relay (device 32) can be used to control the undervoltage relay of third harmonic neutral. The disadvantage with this scheme is the absence of 100% coverage until a relay 59 picks up.
b.2 Voltage Relay of Third Harmonic at The Generator Terminal [2]
This protection method is supplied by a wye-grounded broken-delta transformer, which can be wye-wye for digital relay. This scheme is shown in Figure 6. Upon the occurrence of a generator neutral ground, the THV available at the line generator terminals becomes elevated. The accompanying overvoltage is used to operate a relay used for this application and must be set so that it will be unresponsive to the maximum THV appearing at this point during normal system operation.
An advantage in this scheme is that it will also detect GF in the bus or in the delta winding when the generator de-connector is open. However, it also has shortcomings due to the need for a three-phase VT on the machine terminals.
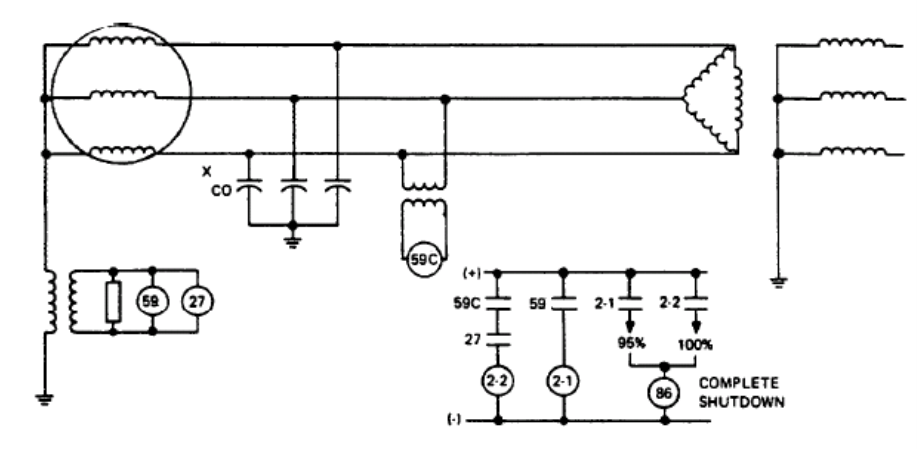
b.3 Third Harmonic Voltage Comparator Relay
This method distinguishes the third harmonic in the terminal and a neutral at the generator. This scheme, shown in Figure 7, utilizes the fact that the third harmonic residual voltage in terminals of a machine increase, while the THV at the neutral decreases, for a fault nearby the neutral. The comparison of the third harmonic residual voltage to the neutral third harmonic content may be nearly constant under all load conditions in many un-faulted machines.

Small changes in this ratio may require the reduced sensitivity parameters. The coincidence between the functions of the equipment 59GN and 59D may exist. The settings for both relay should be determined during field testing in conjunction with commissioning. The third harmonic differentials relay 59D detects GFs close to the neutral as well as at the terminal. Relay 59GN, which is used to measure the fundamental frequency neutral voltage, can detect a fault in the upper section of the winding as well as overlapping much of the winding covered by 59D. The (comparator) relay sensitivity is least for a fault in the middle of the windings. At some point in the winding, the difference between the neutral and terminal THVs is equal to the relay setting. Double GFs tend to reduce the sensitivity for the differential relay, and multi-winding machines to offer application difficulties that require careful consideration.
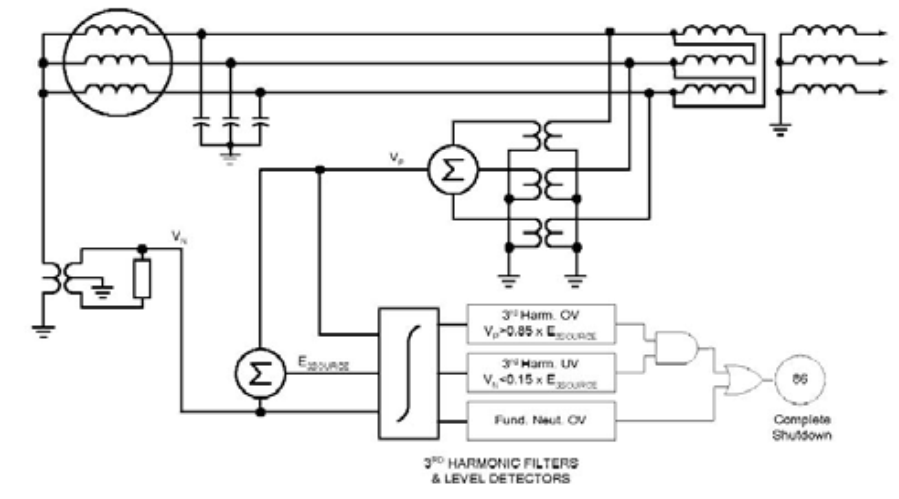
b.4 Adaptive third harmonic level detector
The two voltages are applied to derive the third harmonic source voltage at the generator by using the vector combination of the signals (see Figure 8). The THV in the neutral and that of the residual voltage in terminal are continuously compared with the derived source voltage to detect a grounding the first 15% of the windings close to the neutral. The detection scheme then indicates a fault in its zone of coverage if the THV at the neutral is less than 15% of the source voltage and if one-third of the residual third harmonic at the terminals exceed 85%. Ideally, in comparison, the two are equivalent, but in practice, it has been verified that the two are indeed different in a number of ways according to the MW and MVAR typical generator installations.
This approach, in effect, utilizes adaptive undervoltage and overvoltage level detectors, where the setting level adapts to the level available relaying a signal, i.e., the magnitude of source voltage. It is imperative that the detectors will be blocked when the third harmonic source voltage is less than some minimum values, below which the voltage signals are considered unreliable for relaying. A level of 0.75% of nominal phase to neutral voltage on the generator is considered safe.
b.5 A Recent Third Harmonic Protection Method
In the protection method, the scheme of THV phasor at the terminals or in the generator neutral are periodically evaluated and stored. Every currently estimated third harmonic magnitude is identified with the saved magnitude before the time of approximately one second. If the difference between magnitudes being compared is greater than the fixed, the verge magnitude as the trigger signal is produced. To date, the application of an existent algorithm using the microcontroller in the system, and preparatory tests using synthesized by voltage signals of GF have been confirmed effective.
Other new methods of fault protection in assuming the differential phase angle of delta THV [8] does not contribute to the THV neutral of the generator, and the generator GF of a stator is equivalent to the terminal, and can be used to discern the GF of the stator of generators.
c. Sub-harmonic Injection Protection Method
The sub-harmonic injection scheme has two main methods, 12.5 Hz and 20 Hz. The signal source of 12.5 Hz is in series with neutral grounding resistance, and the 20 Hz signal source is parallel with the neutral grounding resistance [8]. While a GF happens, the current increases due to the less resistant faulty path, and thus will be detected. The main advantage of the sub-harmonic 64- 100% relays is that, they are quite sensible, regardless of the machine reactive loading.
The scheme of sub-harmonic injection is another main method for unit-connected generator using third-harmonic. The following will explain the principle of stator GF protection by using subharmonic injection method.
c.1 Neutral or Residual Sub-harmonic Voltage Injection (comparator injection and measurement voltages)
This scheme, using a voltage injection at the neutral or residually in the broken-delta VT secondary, can detect GFs anywhere in the part of stator winding, including the neutral point. Full GF protection is available, even when the generator is starting up and during turning gear if the injected voltage source does not originate from the generator. Certain schemes inject a coded signal into a sub-harmonic frequency that can be synchronized to the frequency of a system. When compared with other injection schemes, this coding improves the security within the relay system without sacrificing dependability. For proper relay performance, the scheme is dependent on a reliable subharmonic source.
The use of sub-harmonic frequencies may offer improved sensitivities in relation to the higher-level impedance path of the generator capacitances at these frequencies. Such frequencies are not normally present at the generator’s neutral. This comes with a disadvantage of the economic penalty associated with providing and maintaining a reliable sub-harmonic source and injection equipment.
The major advantage of neutral injection schemes is that they provide 100 GF protections independent of the 95% GF protection schemes [2].
c.2 Neutral sub-harmonic voltage injection (measurement of voltage and current)
This scheme is shown in Figure 9. This scheme uses the sub-harmonic current injection at the generator neutral that can detect the GF’s entire generator stator winding, including the delta windings in a generator step-up transformer (GSU). Full GF protection can be provided without the field being energized, such as during the initial start-up of the generator and turning gear with the independent sub-harmonic voltage supply. Certain schemes inject a coded signal into a sub-harmonic frequency that can be synchronized to the frequency on the system such as for a 50 Hz system used a 12.5 Hz. This coding improves the security within the relay system without sacrificing dependability.
The scheme uses voltage and current measurements as the secondary circuit of grounding transformer of the generator. The voltage and current measurements are derived from the injected signal as they are placed across the generator grounding transformer secondary. In this manner, the reflected impedance of delta winding of the GSU and the generator are measured. If a GF is not present anywhere in the generator zone, the impedance measured is the natural capacitive coupling to be ground of the entire generator zone. If a GF develops, the impedance becomes less than natural capacitive coupling values, and alarm and/or trip set points will be applied.
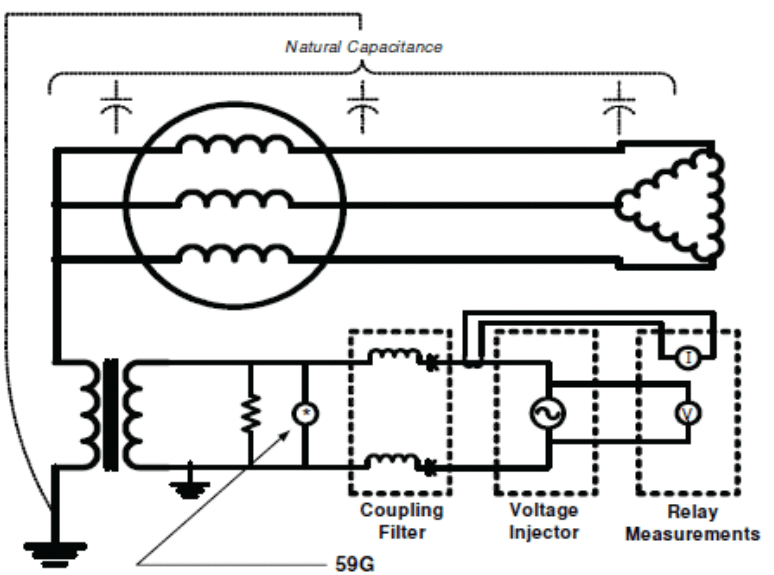
The major advantage of neutral sub-harmonic injection schemes is that they provide 100 % GF protection even when the generator is not in service and during start-up prior to application within the field [2].
c.3 A Recent Compensated Injection Scheme
In the protection scheme, an additional reactor that connects the compound with the resistance load in the distribution of transformers secondary side is applied to compensate the leakage capacitance from the stator windings of the generator to be grounded. The injection signal frequency is tuned to adapt to the variation of the capacitance caused by temperature varying, insulation aging, etc. Thus, the influence of the capacitance is cleared and high-impedance of GF protection for the entire generator stator winding is taken directly as adjustment measurement the grounding fault resistance and comparison of the session threshold [7].
d. Numerical Protection Method
d.1 Using wavelet transforms.
The THV at a generator neutral and terminals will vary simultaneously when a ground fault occurring in the generator stator, even if it is grounded with a high resistance. Therefore, the signals which be measured by the protective device contain significant transient components. They have much more fault information than the steady component. As wavelets are well suited for the analysis of the non-stationary signals, one will have the ability to extract important information from the noised signals. This information can be used to discern the GF [9].
The scheme (Figure 10) considers the overall produced voltage in the machine, and the use of Wavelet Multi Resolution Analysis (MRA). MRA is an ideal method to the analysis of the transients of the power system [10] and the protection of generators [11]. THV terminal and neutral signals are analyzed using of Wavelet MRA to discern GFs. In this scheme, maximum polarities coefficients are compared to other discrimination grounds transient faults. In this method, the maximum coefficient decreases for the increase in fault impedance. The scheme offers inherent discrimination of sudden load imbalance [12].

Problem of Stator Ground Fault Protection
The most important thing to consider in the use of various stator GF protections is the type of the stator winding of generators, which has an expressive effect upon the efficiency of the GF protection and units of supply, thus should be considered in evaluating the performance of the protection system and analysis for optimization [13]. The generator active load affects the extent of the supply voltage protection element, and is satisfied with the THV [14].
Conclusion
Implementation of GF protection, especially for the 100% coverage scheme, depends on the generator’s neutral, based on the type of stator winding and generator connection. To get the best performance, the characteristics of stator GF protection must be evaluated with pre-fault conditions, fault conditions and various load condition.
REFERENCES
[1] Gilany, M, Malik OP, Generator Stator Winding Protection with 100% Enhanced Sensitivity, Electrical Power and Energy Systems, 2002
[2] IEEE Std C37.101™-2006, IEEE Guide for Generator Ground Protection.
[3] Wang Yuanyuan, A Novel Protection for Stator Winding Grounding Faults in Multi-Generator-Systems, Tencon-IEEE Region 10 Conferences, 2006
[4] C. H. Griffin, Generator Ground Fault Protection using Overcurrent, Overvoltage and Undervoltage Relay, IEEE Transactions on Power Apparatus and Systems, Vol. PAS-101, 1982
[5] Charles J. Mozina, 15 Years of Experience with 100% Generator Stator Ground Fault Protection (What Works, What Doesn’t and Why), 62nd Annual Conference for Protective Relay Engineer, 2009
[6] Blackburn J.Lewis, Protective Relaying: Principles and Application, Marcel Dekker, New York, 1998
[7] IEEE Std C37.101™-1993, IEEE Guide for Generator Ground Protection
[8] NengLing T, Yan D, Stator Ground Fault Protection Based on Phase Angle Differential of Delta Third Harmonic Voltages, Electric Power System Research, 2005
[9] Nengling T, et al, Wavelet-based Ground Fault Protection Scheme for Generator Stator Winding, Electric Power Systems Research, 2002.
[10] Xiangjun Z, et al, Improvement of Subharmonic Injection Schemes for Huge Hydro-generator Stator Ground Protection, International Conference on Power System Technology PowerCon Volume 2, 2002
[11] A.W.Galli, G.T.Heydt, P.F.Ribeiro, Exploring the Power of Wavelet Analysis, IEEE Computer Applications in Power, Oct. 1996, pp. 37-41.
[12] S A Gafoor, P.V. Ramana R., Wavelet-ANN Based Ground Fault Protection Scheme for Turbo Generators, Electric Power Components and Systems, 35:5, 575-590, 2007
[13] M. Zielichowski, Third Harmonic Ground-Fault Protection System of Unit-Connected Generator with Two Parallel Branches Per Phase, Electric Power Systems Research, 78-2008
[14] Fulczyk M, Influence of Generator Load Conditions on Third- Harmonic Voltages in Generator Stator Winding, IEEE Transactions On Energy Conversion, Vol.20, 1, 2005
Authors: Ahmad Rizal Sultan, Faculty of Electrical Engineering, Universiti Teknologi Malaysia (UTM), Skudai, Malaysia 81300, E-mail: rizal.sultan@fkegraduate.utm.my
Mohd Wazir Mustafa, Faculty of Electrical Engineering, Universiti Teknologi Malaysia(UTM), Skudai, Malaysia 81300, E-mail: wazir@fke.utm.my
Source & Publisher Item Identifier: PRZEGLĄD ELEKTROTECHNICZNY, ISSN 0033-2097, R. 89 NR 10/2013