Published by Martin SLIVKA, Radomír GOŇO, Stanislav RUSEK, VŠB-Technical University of Ostrava
Abstract. The paper deals with statistical analysis of data on faults and failures in electrical power distribution. We used the statistical analysis of both MV overhead and cable lines, and electrical power stations of one distribution company. The data were collected from 2000 to 2009 with focus on the duration of failure with respect to different types of equipment. To compare and analyze the data, we used confidence intervals and also statistical distribution of data-sets.
Streszczenie. W artykule analizowano dane statystyczne błędów i defektów w przesyle energii elektrycznej. Wykorzystano dane linii średniego napięcia kablowych i napowietrznych. Dane były zebrane w latach 2000 do 2009. (Analiza okresu trwania uszkodzeń w sieciach przesyłu energii)
Keywords: Mean failure time, confidence interval, exploratory data, distribution analysis.
Słowa kluczowe: uszkodzenia, przesył energy elektrycznej, analiza statystyczna
Introduction
Monitoring the durations of failures is valuable because it gives information on how quickly a distribution company is able to repair a failure. These data can be used as a basis for the maintenance optimisation of distribution network equipment and for the breakdown service operation at distribution companies. Hereby stated data is anonymous and confidential and the selection criteria may not allow a wholly objective assessment. All input data are at the minimum of 3-minute duration [1]. The dataset comprises approximately 7200 values read from 1 January 2000 to 31 December 2009 [4]. The failure data comprises the date of event, its duration and the type of failed equipment. Mean failure time τ for individual months and years was calculated [3]:

where: N – number of failures of one equipment type, t – duration of failure (h).
Graphical Comparison of Data
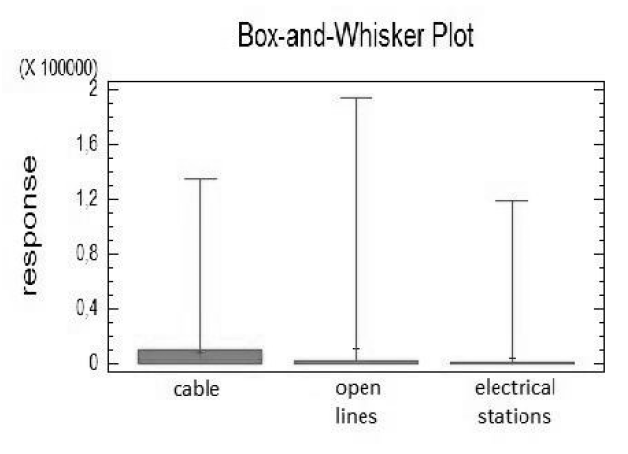
The box-and-whisker plot represents the distribution of variables in different datasets. The minimum, the lower and upper quartiles, and the means are not too far from each other; however, the maximum is the furthest. Most failures have low duration as Fig. 1 illustrates.
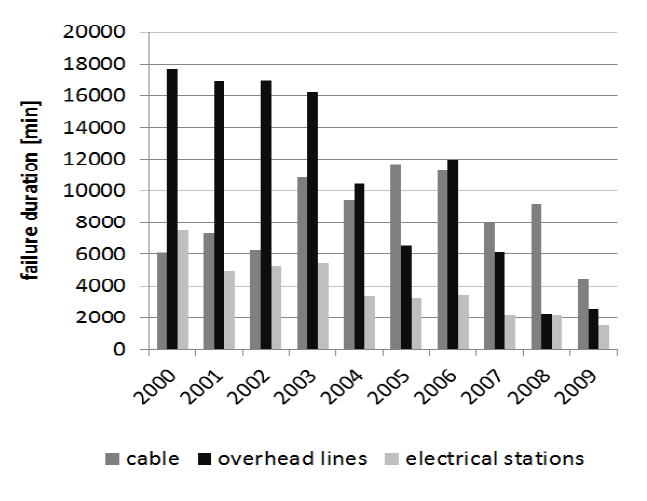
The bar chart in Fig. 2 represents the trend in failure duration within 2000-2009. Concerning overhead lines, it shows considerable decrease in the failure duration, similarly to the electrical power stations.
Exploratory Data Analysis (EDA)
First, outliers were excluded by means of z-coordinate. In this case, outliers are those with absolute value of z-coordinate greater than 3. After eliminating outliers, exploratory data analysis was conducted [2].
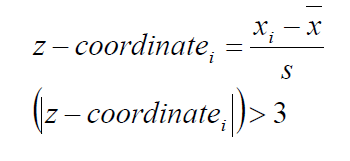
Table 1 – Descriptive data statistics
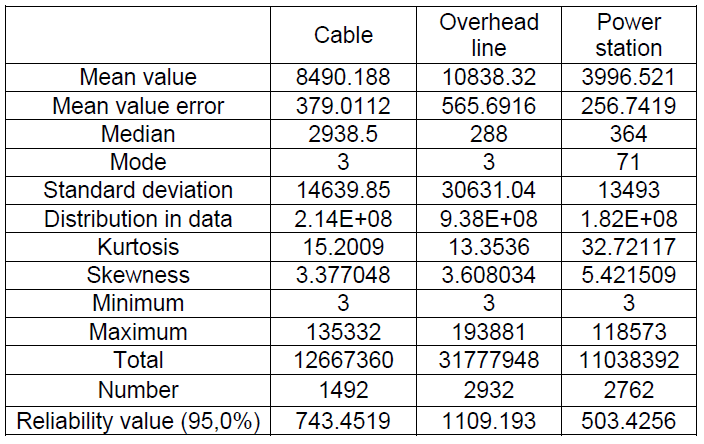


The EDA shows that all data have pointed distribution. Skewness reflects asymmetry in the distribution of values surrounding the mean – evidently the values above the mean prevail. The mode of electrical power stations is 71 minutes, while cables and overhead lines have 3 minutes. The median of cables is distinctively higher, probably due to the demanding character of repairs.
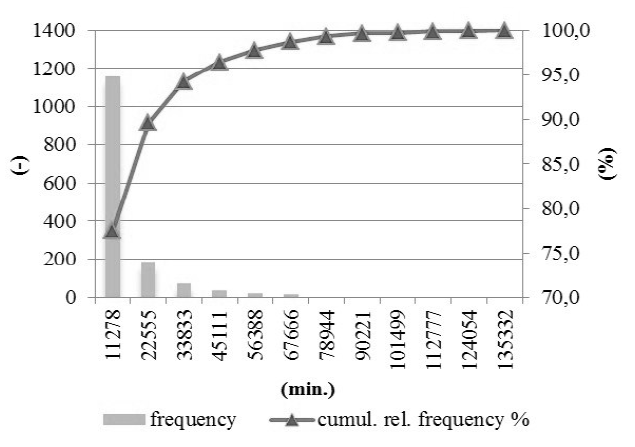
Frequency histogram
Histograms graphically represent the frequency of occurrence of assessed quantity, in our case failure duration with respect to selected classification. The number of classes is given by the Sturges’ rule. The bar chart depicts the rate in different classes. The chart shows that the failures with the shortest interval are proportionally prevalent. In longer duration the chart shows a steep drop in the rate. The equipment of electrical power stations shows the highest percentage with 92 % value of the first class. The line chart depicts proportional distribution of cumulative frequencies which correspond with proportional data distribution from the shortest failure duration up to a given class. These histograms were devised in MS Office 2010. Figures 3, 4, and 5 illustrate failure duration rate distribution for different datasets.
Distribution Analysis
Distribution analysis of several samples tests hypothesis (H0) which assumes the same original set of the basic probability distribution in comparison with alternative hypothesis (HA) which assumes inequality of mean values of samples (HA: does not hold H0). Distribution analysis can be conducted in the ANOVA table, or with Kruskal-Wallis one-way analysis of variance. The ANOVA table assumes normality of analyzed data. When this assumption is not supported, Kruskal-Wallis one-way analysis of variance can be used, however, at the cost of lower sensitivity compared to the ANOVA table.
Table 2 – Chi-Square a Kolmogorov-Smirnov test results
Normality Testing
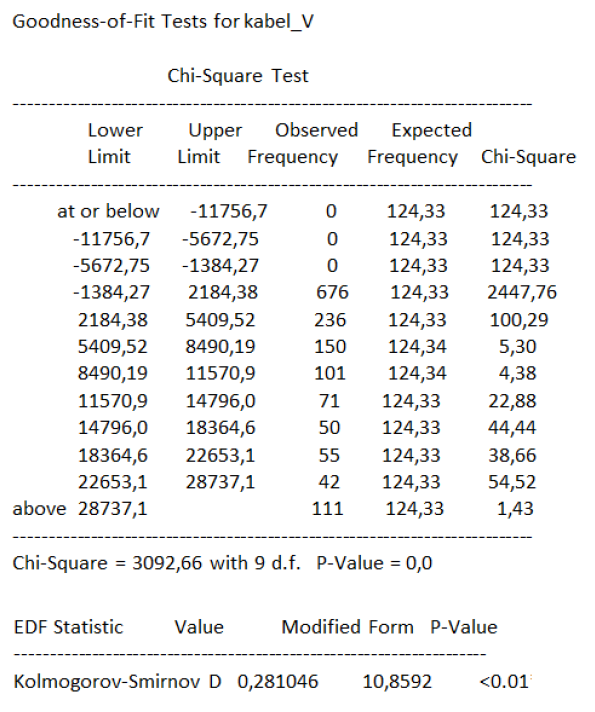
Out of many methods there are to be used for testing normality, we used chi-square goodness-of-fit and Kolmogorov-Smirnov tests for reasons of good availability in STAGRAPHICS Plus 5.0.
Chi-square test tests the number of frequencies in selected classes from analyzed data. It compares them with the number of frequencies that would occur in case of selected distribution. Only the test results for cable are shown, as the results of the other datasets were similar – also not with the character of normal distribution.
To illustrate normal distribution, we used a Q-Q plot Fig. 6. The blue line in the plot shows congruity of the empirical and the theoretical distribution functions, the latter of which originates in the normal distribution. The empirical distribution function from the distribution we analyzed is represented by the points. The points are not aligned with the blue line, but they more or less deflect from it. The analyzed data do not have the distribution function of normal distribution, therefore they do not originate from it.
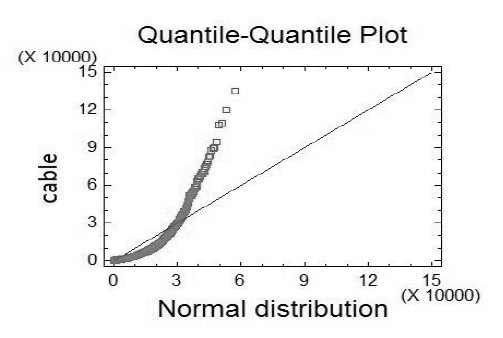
Table 3 – Kruskal-Wallis test results

Distribution Analysis
The abnormality of data does not allow distribution analysis by means of table ANOVA, therefore we used Kruskal-Wallis test. The test compares medians of individual samples and tests the null hypothesis that the medians are equal.
The Kruskal-Wallis test
The P-value in the test is zero and therefore there is 95% certainty that the datasets are statistically different. As every dataset is specific in its own way, intuitively we can assume the correctness of such conclusion.
To analyse in more detail differences in datasets we conducted the post – hoc analysis. As the data distribution is abnormal, the Tukey HSD test which is used to find means that are significantly different from each other was used. The test was conducted for 99% confidence interval of data reliability.
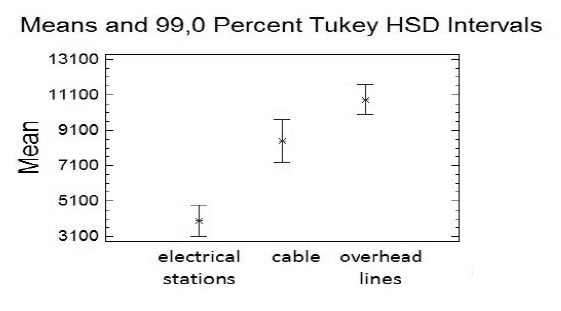
It is evident that these three independent homogeneous groups have completely different character. The values from the Fig. 7 are in the Tab. 4.
Table 4 – Table of mean values form Tukey HSD test and confidence intervals with 99% reliability
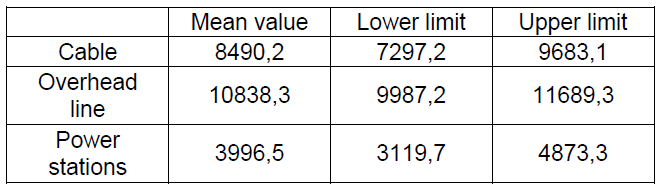
Mean failure time
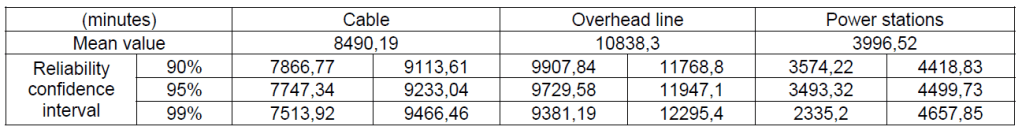
Mean failure time is a significant value that speaks for the condition of given equipment and the demands for its repair. It can be useful to know what the range of interval of mean failure time is.
Table 5 – Confidence intervals for selected reliability intervals
Conclusion
The paper deals with statistical representation of reliability data. Altogether, 7186 were analyzed in the monitored period of time. The variables have pointed and abnormal distribution with the prevalence of values above average. The analyzed variables are statistically different, which confirms the intuitive assumption. The mean failure times and reliability confidence intervals are to be found in Tab. 5. It is clear that the distribution of more accurate reliability intervals is closer to the mean value.
This work was supported by the Czech Science Foundation (No. 102/09/1842), by the Grant of SGS VŠB – Technical University of Ostrava (No. SP2013/137) and by the project ENET (No. CZ.1.05/2.1.00/03.0069).
REFERENCES
[1] Provozovatelé d i s t r i bučních soustav : PPDS, Příloha 2: Metodika určování nepřetržitosti distribuce elektřiny a spolehlivosti prvků distribučních sítí. (2011)
[2] Briš R., L i tschmannová M., Statistika I., Sylaby k předmětu VŠB-TU Ostrava (2004)
[3] Martínek, Z., Královacová, V., The Solution for Re-pairable Units. Proceedings of the 11th international Scientific Conference Electric Power Engineering 2010, University of Technology Brno (2010)
[4] Krejčí, P., Santarius, P., Hájovský, R., Velička, R., Čumpelík, R., PQ Monitoring in Selected Networks of Czech Republic. Przeglad Elektrotechniczny, vol. 88, nr. 7b/2012, 183-185
Authors: Ing. Martin Slivka, VŠB–TU Ostrava, Department of Electrical Power Engineering, 17. listopadu 15, Ostrava, martin.slivka.st1@vsb.cz; doc. Ing. Radomír Goňo, Ph.D., radomir.gono@vsb.cz; prof. Ing. Stanislav Rusek, CSc, stanislav.rusek @vsb.cz
Source & Publisher Item Identifier: PRZEGLĄD ELEKTROTECHNICZNY, ISSN 0033-2097, R. 89 NR 11/2013
