Industrial Harmonic Filter Design

Published by Electrotek Concepts, Inc., PQSoft Case Study: Industrial Harmonic Filter Design, Document ID: PQS0504, Date: June 30, 2005.


Abstract: The industrial harmonic problem can be solved using a comprehensive approach including site surveys, harmonic measurements, and computer simulations.

Simple calculations are used to determine the system resonant frequencies and then the preliminary model development is completed. Initial estimates of voltage distortion levels are made based on the level of harmonic current injection and the frequency response characteristic.

This case study presents the configuration of low voltage power factor correction capacitors as harmonic filters to improve poor power factor and reduce excessive voltage distortion levels.

PROBLEM STATEMENT

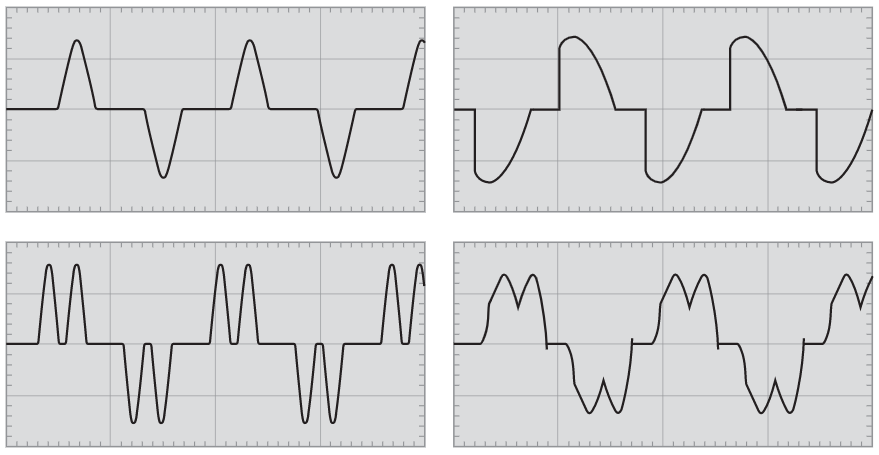
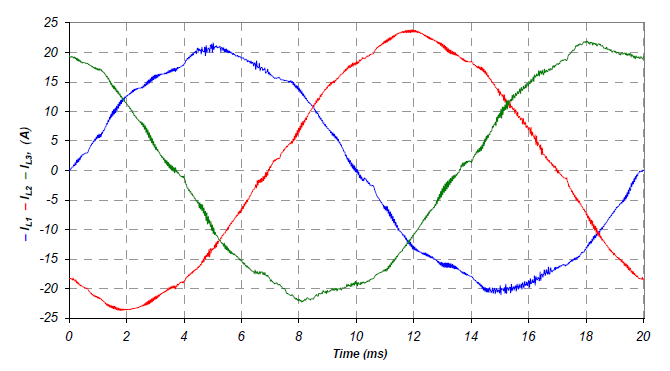
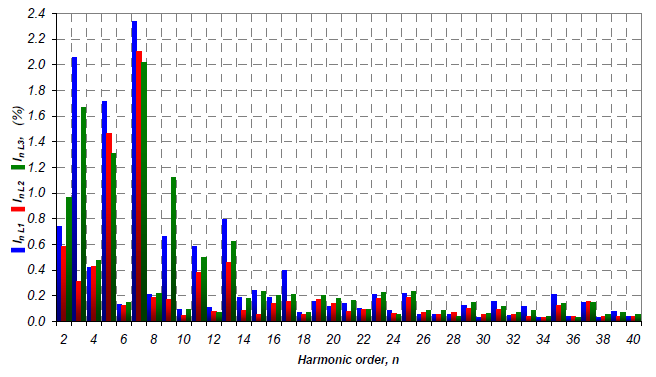
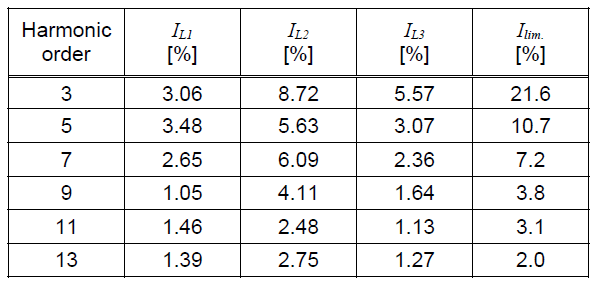
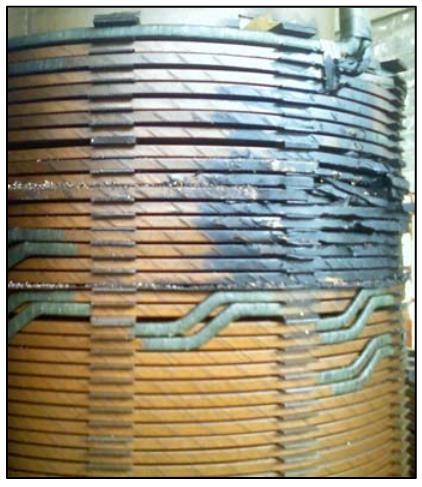
The plastics manufacturer (refer to power factor correction case) is now experiencing equipment problems, such as several capacitor bank fuses blowing, and a capacitor can failure. The plant engineer believes that the problem may be related to harmonics. He measures the following bus voltage waveform (Figure 1):

Figure 1 – Bus Voltage Waveform
Harmonic Evaluations

The industrial harmonic problem can be solved using a comprehensive approach including site surveys, harmonic measurements, and computer simulations. One general procedure used for a harmonic analysis study consists of the following steps:

− Preliminary analysis / model development
− Harmonic measurements
− Perform computer simulations
− Determine impact on equipment
− Evaluate harmonics with respect to limits
− Develop solutions (including filter design)

Simple calculations are used to determine the system resonant frequencies and then the preliminary model development is completed. Initial estimates of voltage distortion levels are made based on the level of harmonic current injection and the frequency response characteristic.

Model Development and Drive Characteristic

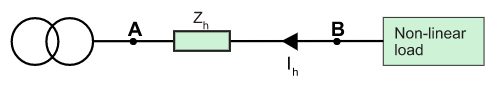
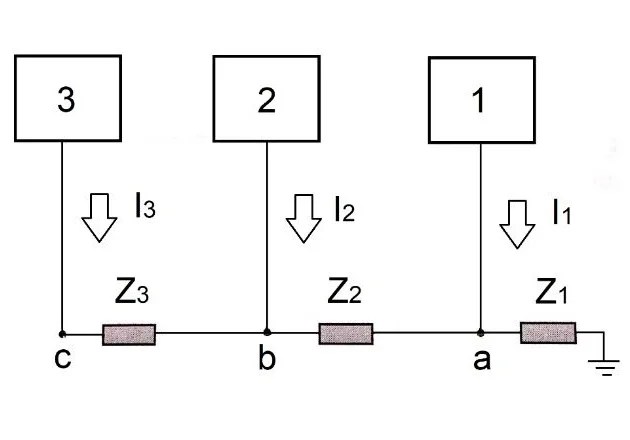
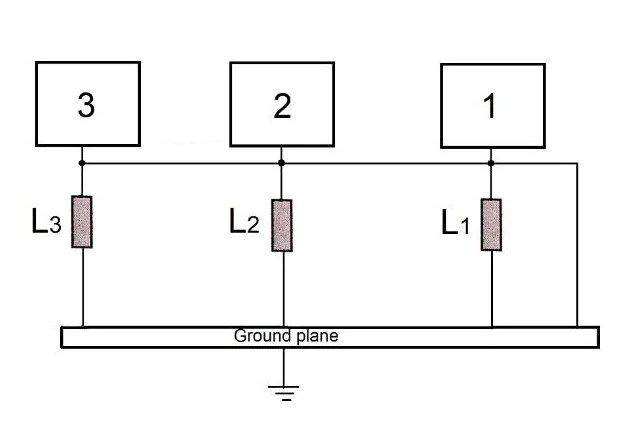
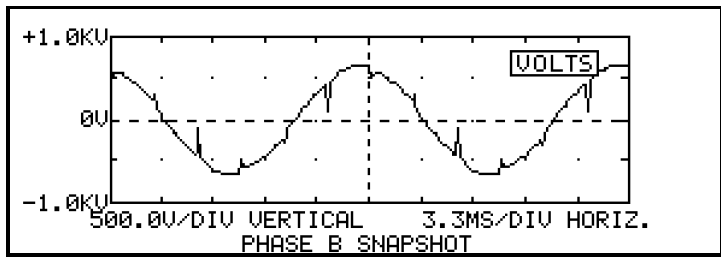
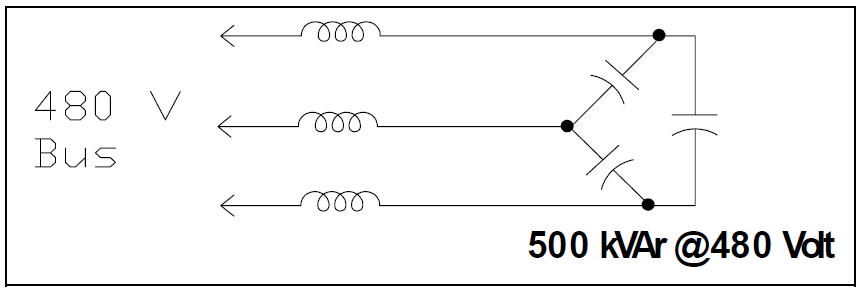
A simplified model, as illustrated in Figure 2, can be developed for the initial analysis. Harmonic measurements of the ASD indicated the following characteristic:

Drive rating: 500 HP
Drive voltage: 480 V
Fundamental Current: 600 A

Harmonic Number% of
Fundamental
Amps
528168
71272
11742
13424
THD:31.5%
.
Figure 2 – Simplified Model for Harmonic Analysis

Voltage Distortion and Harmonic Resonance Calculation

Hand calculations can be used to determine the voltage distortion level without capacitors. This value is then compared with measured quantity to determine the accuracy of the preliminary model.

The transformer impedance can be determined from:

Xtx = (kV2 * Zpu)/ MVA = (0.4802 * 0.06) / 1.5 = 0.0092Ω

Table 1 – Voltage Distortion Calculation

hIhXh=h*Xth=Ih*Xh
51680.0467.73
7720.0644.64
11420.1014.25
13240.1192.87
.

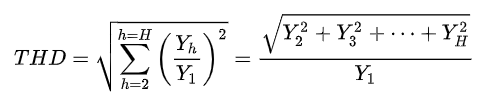
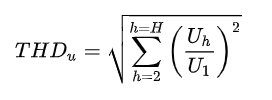
The total harmonic voltage distortion (VTHD) is determined by:

VTHD = (7.732 + 4.642 + 4.252 +2.872) / 2.772 = 3.74%

The customer has added 500kVAr of power factor correction at the 480 volt bus. The addition of a capacitor bank creates a parallel resonance condition. The parallel resonance occurs at the frequency where the shunt capacitive reactance is equal to the inductive source reactance and can be expressed in terms of the 60 Hz values as follows:

h = 1 /(2π(LsC)) = (Xc/Xs) ≈ (100*kVAtx)/(kVArcap * Ztx(%))

where:
h = parallel resonance frequency (x 60 Hz)
Xc = shunt capacitive reactance (C – capacitance) (ohms)
Xsc = short circuit reactance (Ls – inductance) (ohms)
kVAtx = step-down transformer rating (kVA)
Ztx = step-down transformer impedance (percent)
kVArcap = capacitor bank rating (kVAr)

This simple relationship provides an excellent first check to see whether or not harmonics are likely to be a problem. Almost all harmonic distortion problems occur when this parallel resonance moves close to the 5th or 7th harmonic, since these are the largest harmonic current components in loads like ASDs. However, the 11th and 13th harmonics can also be a problem when ASDs (PWM type) are a large percentage of the total load.

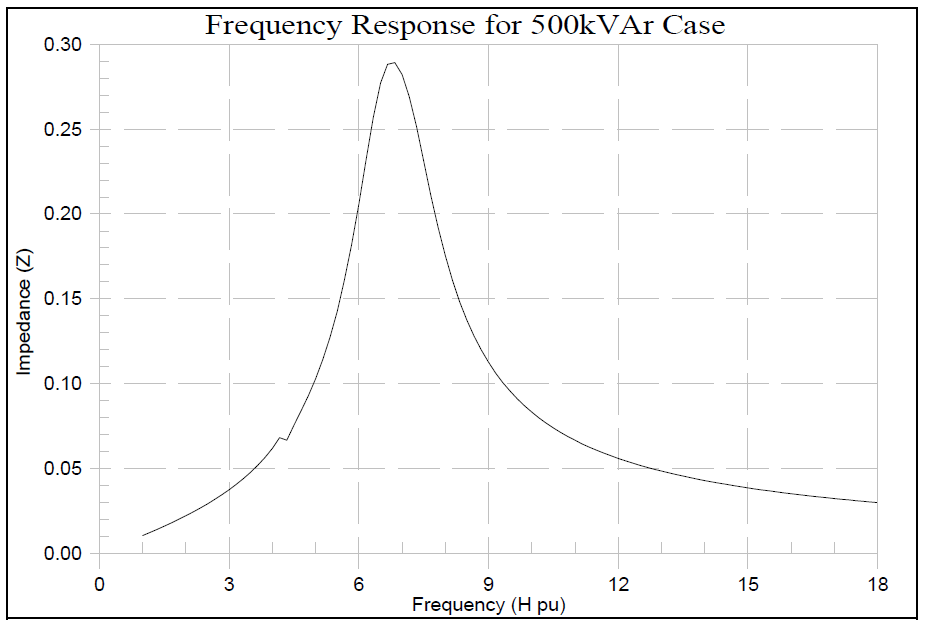
For the 500 kVAr power factor correction capacitor bank installation, the harmonic resonance is very near the 7th harmonic.

h ≈ √(100*kVAtx)/(kVArcap * Ztx(%)) = (100*1500)/(500*6.0) = 7.08

assuming:
kVAtx: step-down transformer rating (1500 kVA)
Ztx: step-down transformer impedance (6%)
kVArcap : capacitor bank rating (500 kVAr)

The frequency response characteristic, determined from computer simulation, is illustrated in Figure 3.

The addition of the 500kVAr power factor correction capacitor increases the voltage distortion to 11.5% (determined from computer simulation).

The initial solution to the problem would appear to be the installation of a 7th harmonic filter. This would create a low impedance condition and reduce the 7th harmonic voltage distortion. However, the installation of the 7th harmonic filter create a new parallel resonance very near the 5th harmonic. Recalling the current spectrum for the ASD, the 5th harmonic component was higher than the 7th (168A vs. 72A), therefore the voltage distortion will actually increase. Figure 4 illustrates the simulated frequency response characteristic for this condition.

Figure 3 – Frequency Response Characteristic
Figure 4 – Frequency Response with a 7th Harmonic Filter

The installation of the 7th harmonic filter increased the voltage distortion to 16.2% (determined by simulation). The proper solution to the problem is the addition of a 5th harmonic filter. Configuration of the power factor correction capacitor as a 5th harmonic filter reduced the voltage distortion to 3.2% (determined by simulation). In general, it is best to apply harmonic filters at the lowest generated harmonic frequency. The filter configuration for this case is illustrates in Figure 5.

Figure 5 – 5th Harmonic Filter Configuration

Filter Design Methodology

The harmonic filter, illustrated in Figure 5, provides a low impedance path for harmonic currents, thereby minimizing harmonic voltage distortion problems. The filter is tuned slightly below the harmonic frequency of concern. This method allows for tolerances in the filter components and prevents the filter from acting as a short circuit for the offending harmonic current. This allows the filter to perform its function of providing low impedance at the harmonic frequency while helping to reduce the duty on the filter components.

The general method for applying filters is as follows:

− Apply one single-tuned shunt filter first, and design it for the lowest generated frequency.
− Determine the voltage distortion level at the low voltage bus. The commonly applied limit of 5% was introduced in IEEE Std 519-1992.
− Vary the filter elements according to the specified tolerances and check its effectiveness.
− Check the frequency response characteristic to verify that the newly created parallel resonance is not close to a harmonic frequency.
− If necessary, investigate the need for several filters, such as 5th and 7th.

SUMMARY

The industrial harmonic problem can be solved using a comprehensive approach including site surveys, harmonic measurements, and computer simulations.

Simple calculations are used to determine the system resonant frequencies and then the preliminary model development is completed. Initial estimates of voltage distortion levels are made based on the level of harmonic current injection and the frequency response characteristic.

A harmonic filter provides a low impedance path for harmonic currents, thereby minimizing harmonic voltage distortion problems.

REFERENCES

IEEE Recommended Practice for Electric Power Distribution for Industrial Plants (IEEE Red Book, Std 141-1986), October 1986, IEEE, ISBN: 0471856878
IEEE Recommended Practice for Industrial and Commercial Power Systems Analysis (IEEE Brown Book, Std 399-1990), December 1990, IEEE, ISBN: 1559370440
IEEE Recommended Practice for Protection and Coordination of Industrial and Commercial Power Systems, March 1988, IEEE, ISBN: 0471853925


RELATED STANDARDS
IEEE Std. 519-1992
IEEE Std. 1036-1992

GLOSSARY AND ACRONYMS
ASD: Adjustable-Speed Drive
CF: Crest Factor
DPF: Displacement Power Factor
PF: Power Factor
PWM: Pulse Width Modulation
THD: Total Harmonic Distortion
TPF: True Power Factor

System and Equipment Grounding Safety

Published by Alex Roderick, EE Power – Technical Articles: System and Equipment Grounding Safety, August 15, 2021.


Grounding is used to provide a safe path for a fault current to flow.

Grounding is an integral part of any properly operating electrical system. In residence, grounding protects the occupants by providing a safe pathway for unwanted electricity that might otherwise create a hazard. Electricity always takes the easiest flow path to earth. A ground is a low-resistance conducting connection between electrical circuits, equipment, and the earth.

Grounding is used to provide a safe path for a fault current to flow. A complete ground path must be maintained when installing switches, light fixtures, appliances, and receptacles. In a properly grounded system, the unwanted current flow blows fuses or trips circuit breakers. Once a fuse is blown or a circuit breaker is tripped, the circuit is open, and no additional current will flow.

Grounding is usually done at two levels: system grounding and equipment grounding. The system ground is a special circuit designed to protect the entire distribution system of a residence. Equipment ground is essentially a circuit designed to protect individual components of an electrical system. Grounded conductors are used to providing a path to the ground for system and equipment grounds.

A grounded conductor is one that has been grounded on purpose. Grounded conductors are typically identified with green or green and yellow markings and may be installed as bare conductors.

System Grounding

The primary function of system grounding is to protect the service entrance wiring and the circuits connected to it. There are several methods of grounding an entire system. The two most popular methods used for grounding an electrical system are electrode grounding and water pipe grounding (see Figure 1). Other grounding methods use a concrete-encased electrode or a ground ring, both of which are less common in residential wiring systems.

Figure 1. System grounding methods include the use of an electrode ground, water pipe ground, concrete-encased electrode, or ground ring. Image courtesy of NI
Electrode Grounding

An electrode is a long metal rod used for grounding that makes contact with the earth. When no satisfactory grounding electrode is readily available, the common practice is to drive one or more metal rods (connected in parallel) into the ground. The electrode and circuit must provide a flow path to the earth with less than 25Ω of resistance.

Water Pipe Grounding

A water pipe ground uses the underground metal pipe that supplies a residence with water and is typically the best electrical ground for a residential electrical system. Water pipes work well as grounds because the large surface area of the pipe is in contact with the earth, as it connects the municipal water main to the water distribution system in residence. This large surface area reduces resistance and allows any unwanted electricity to easily pass through the pipe to the earth. When a water pipe is used for grounding, the water pipe run must never be interrupted by a plastic fitting or have an open section of plumbing. Water meters are a source of an open ground circuit when removed. To provide protection when a water meter is removed, a shunt (or meter bonding wire) must be permanently installed. A shunt is a permanent conductor placed across a water meter to provide a continuous flow path for ground current.

All internal piping systems capable of becoming energized must be bonded and connected. A bonding conductor is a reliable conductor that ensures the electrical conductivity between two metal parts that must be connected electrically. The term “grounding conductor” no longer appears by itself in the NEC. Instead, conductors are referred to by their function, such as “grounding electrode conductor,” “bonding conductor,” or “equipment grounding conductor.”

Equipment Grounding

Equipment grounding’s main purpose is to protect individual electrical devices. Equipment grounding safely grounds any devices or appliances attached to an electrical system or plugged into receptacles inside a home. For example, when a refrigerator has not been properly grounded, the electrical current caused by a short will seek the easiest path to earth. Unfortunately, the human body is an electrical conductor and allows current to reach the earth by traveling through the body (electric shock). Proper equipment grounding protects the body by harmlessly conducting unwanted electricity to the ground (see Figure 2).

Figure 2. Equipment grounding’s main purpose is to protect individual electrical devices. Image courtesy of VFC
Grounding Small Appliances

Small appliances are easily incorporated into a grounded system. Most small electrical appliances are designed with three-prong grounded plugs that match a standard three-prong grounded receptacle (see Figure 3). The U-shaped blade of the plug and the U-shaped hole in the receptacle are the ground connections. The U-shaped blade of a plug is longer than the current-carrying blades. The added length ensures a strong ground connection while the plug is being inserted or removed from a receptacle. The ground wire is connected to all receptacles and metal boxes to provide a continuous pathway for short-circuit current. The ground wire may be connected to each box using a pigtail, screw, or ground clip.

Figure 3. Small appliances are easily incorporated into a grounded system, as most small electrical appliances are designed with three-prong grounded plugs that match standard three-prong grounded receptacles. Image courtesy of APOGEE

Note: According to the NEC, an equipment grounding conductor (EGC) provides a ground-fault current path and connects the non-current-carrying metal parts of the equipment together and to the system ground and/or grounding electrode in order to establish a direct path to earth.


Author: Alex earned a master’s degree in electrical engineering with major emphasis in Power Systems from California State University, Sacramento, USA, with distinction. He is a seasoned Power Systems expert specializing in system protection, wide-area monitoring, and system stability. Currently, he is working as a Senior Electrical Engineer at a leading power transmission company.


Source URL: https://eepower.com/technical-articles/system-and-equipment-grounding-safety/

Definition and Origin of Harmonics

Published by Electrical Installation Wiki, Chapter M. Power harmonics management – Definition and origin of harmonics


Definition of Harmonics

The presence of harmonics in electrical systems means that current and voltage are distorted and deviate from sinusoidal waveforms.

Harmonic currents are caused by non-linear loads connected to the distribution system. A load is said to be non-linear when the current it draws does not have the same waveform as the supply voltage. The flow of harmonic currents through system impedances in turn creates voltage harmonics, which distort the supply voltage.

On Figure M1 are presented typical current waveforms for single-phase (top) and three-phase non-linear loads (bottom).

Fig. M1 – Examples of distorted current waveforms

The Fourier theorem states that all non-sinusoidal periodic functions can be represented as the sum of terms (i.e. a series) made up of:

A sinusoidal term at the fundamental frequency,
Sinusoidal terms (harmonics) whose frequencies are whole multiples of the fundamental frequency,
A DC component, where applicable.

The harmonic of order h (commonly referred to as simply the hth harmonic) in a signal is the sinusoidal component with a frequency that is h times the fundamental frequency.

The equation for the harmonic expansion of a periodic function y (t) is presented below:

.

where:

Y0: value of the DC component, generally zero and considered as such hereinafter,
Yh: r.m.s. value of the harmonic of order h,
ω: angular frequency of the fundamental frequency,
φh: displacement of the harmonic component at t = 0.

Figure M2 shows an example of a current wave affected by harmonic distortion on a 50Hz electrical distribution system. The distorted signal is the sum of a number of superimposed harmonics:

The value of the fundamental frequency (or first order harmonic) is 50 Hz,
The 3rd order harmonic has a frequency of 150 Hz,
The 5th order harmonic has a frequency of 250 Hz,
Etc…

Fig. M2 – Example of a current containing harmonics and expansion of the overall current into its harmonic orders 1 (fundamental), 3, 5, 7 and 9

Individual harmonic component (or harmonic component of order h)

The individual harmonic component is defined as the percentage of harmonics for order h with respect to the fundamental. Particularly:

.

Total Harmonic Distortion (THD)

The Total Harmonic Distortion (THD) is an indicator of the distortion of a signal. It is widely used in Electrical Engineering and Harmonic management in particular.

For a signal y, the THD is defined as:

.

THD is the ratio of the r.m.s. value of all the harmonic components of the signal y, to the fundamental Y1.

H is generally taken equal to 50, but can be limited in most cases to 25.

Note that THD can exceed 1 and is generally expressed as a percentage.

Current or voltage THD

For current harmonics the equation is:

.

By introducing the total r.m.s value of the current:

.

we obtain the following relation:

.

equivalent to:

.

Example: for THDi = 40%, we get:

.

For voltage harmonics, the equation is:

.
Origin of Harmonics

Harmonic currents

Equipment comprising power electronics circuits are typical non-linear loads and generate harmonic currents. Such loads are increasingly frequent in all industrial, commercial and residential installations and their percentage in overall electrical consumption is growing steadily.

Examples include:

Industrial equipment (welding machines, arc and induction furnaces, battery chargers),
Variable Speed Drives for AC or DC motors[1],
Uninterruptible Power Supplies,
Office equipment (PCs, printers, servers, etc.),
Household appliances (TV sets, microwave ovens, fluorescent lighting, light dimmers).

Harmonic voltages

In order to understand the origin of harmonic voltages, let’s consider the simplified diagram on Fig. M3.

Fig. M3 – Single-line diagram showing the impedance of the supply circuit for a non-linear load

The reactance of a conductor increases as a function of the frequency of the current flowing through the conductor. For each harmonic current (order h), there is therefore an impedance Zh in the supply circuit.

The total system can be split into different circuits:

One circuit representing the flow of current at the fundamental frequency,
One circuit representing the flow of harmonic currents.

Fig. M4 – Split of circuit into fundamental and harmonic circuits

When the harmonic current of order h flows through impedance Zh, it creates a harmonic voltage Uh, where Uh = Zh x Ih (by Ohm’s law).

The voltage at point B is therefore distorted. All devices supplied via point B receive a distorted voltage.

For a given harmonic current, the voltage distortion is proportional to the impedance in the distribution network.

Flow of harmonic currents in distribution networks

The non-linear loads can be considered to inject the harmonic currents upstream into the distribution network, towards the source. The harmonic currents generated by the different loads sum up at the busbar level creating the harmonic distortion.

Because of the different technologies of loads, harmonic currents of the same order are generally not in phase. This diversity effect results in a partial summation.

Fig. M5 – Flow of harmonic currents in a distribution network

Notes: 1. to know more about harmonics mitigation related to Variable Speed Drives, please refer to our Schneider Electric White Paper “Choose the best harmonic mitigation solution for your drive”


Author: This Electrical Installation Wiki is a collaborative platform, brought to you by Schneider Electric: our experts are continuously improving its content, collaboration is also open to all.

The Electrical Installation Guide (wiki) has been written for electrical professionals who must design safe and energy efficient electrical installation, in compliance with international standards such as the IEC 60364.


Source URL: https://www.electrical-installation.org/enwiki/Definition_and_origin_of_harmonics

Single-point and Multi-point Signal Grounding

Published by Lorenzo Mari, EE Power – Technical Articles: Single-point and multi-point Signal Grounding, April 16, 2021.


A grounding arrangement must be designed and implemented adequately for the electronic equipment’s proper performance

Introduction

The main categories for grounding electronic equipment are:

• Safety ground (AC and DC power ground) prevents shocks and fire hazards from the breakdown of components or wiring.

• Signal ground reduces noise resulting from electromagnetic fields, common impedances, or other interference coupling forms.

This article emphasizes typical methods employed for signal grounding.

In general, the electronic types of equipment have different circuits and systems, each having its grounding terminal. The method to interconnect these grounding points is fundamental to eliminate electromagnetic interference. Due consideration to the impedances introduced by the grounding conductors is of paramount importance.

Electrical Communications and Noise

Communication is the process of information transmission between two devices. An electrical communication system attains this function primarily through the use of electric devices and phenomena.

While transmitting electrical signals, specific unintended and undesirable effects take place. Broadly speaking, “noise” is any unintentional alteration of the signal shape. However, it is possible to distinguish three primary contaminants: distortion, interference, and noise.

Distortion changes the signal because of the system’s non-linear response to the desired signal. Turning off the signal disappears distortion.

Interference contaminates the desired signal due to extraneous signals — usually human-made — producing undesirable responses in a circuit or system. A circuit may respond to an undesired signal when the frequency of the undesired signal is within the operating frequency range of the circuit.

Noise is an electrical signal – random and unpredictable – from natural causes, external and internal to the system. Adding noise to a signal may partially obscure or destroy it. While distortion and interference also contaminate the signal, the uniqueness of noise is that, theoretically, it cannot be eradicated – posing a fundamental problem in electrical communications.

Common-mode Noise

Many ground system problems come from common impedance coupling.

When two or more electronic circuits share the same ground path, they also share the ground’s impedance, granting a noise coupling mechanism – the common-mode noise. 

Figure 1 shows a typical circuit using two signal wires and a common return current path. The source and load impedances connected to load 1 are Z1S and Z1L. Those related to load 2 are Z2S and Z2L.

The current I=I1+I2 flowing through the common-ground impedance Z causes a voltage Vc that undesirably affects the voltage across ZL1 and ZL2.  Note that the current flowing through one load affects the voltage across the other load.

Figure 1. Two signal wires with a common return current path.
Ground Plane

It is common to think of signal grounding as providing an equipotential point or plane used as a reference potential for a circuit or system. A ground plane is a sheet of metal connected to the ground. Ideally, every point on the ground plane should be at the ground potential.

In electrical technology, a plane is a surface on which every point is at the same voltage. A plane can be a sheet of metal, as shown in Figure 2.

Figure 2. Ideally, every two points on a ground plane should be at the same potential.
Figure 3. Ground plane.

But practical grounds are not equipotential. When the current looks for a low impedance path to return to the source, it generates a voltage difference along the path it flows through. Then, there will be minute voltage variations even in a small plane. The equipotential plane is an ideal target.

As shown in Figure 4, we sometimes employ a ring of conductors as a ground plane.

Figure 4. A ring of conductors used as a ground plane.
Typical Signal Grounding Configurations

When the objective is to reduce noise, several methods are available to interconnect the grounding points of various circuits in the same equipment or some equipment located in the same area.

The signal grounding configurations must be weighed concerning dimensions and frequency.

The typical signal grounding configurations are:

• Single-point

a. Series connection (Common ground or daisy chain)
b. Parallel connection

• Multi-point
• Hybrid

Single-point Grounding Configuration

Figure 5 shows a common ground or daisy chain configuration.

Figure 5. Common ground system.

This configuration is a series connection of the individual circuit grounds. The voltages at points a, b, and c are cumulative, being c the highest and the lowest. 

Va=(I1+I2+I3)∙Z1
Vb=(I1+I2+I3)∙Z1+(I2+I3)∙Z2
Vc=(I1+I2+I3)∙Z1+(I2+I3)∙Z2+I3∙Z3

The above equations clearly show the interaction between the circuits. When the ground currents flowing in the common paths are low or absent, the reference potential is essentially the same in all subsystems or equipment. Place the most critical stage closer to the ground point.

Avoid the series connection, especially when working with high frequencies since the rapid switching generates relatively high current impulses. Also, with circuits operating with very different energy levels – power and control – since the power equipment’s high energy impulses may couple to the control signals.

Despite being susceptible to common-mode noise and being the least effective noise mitigation method, this technique is widespread because it is economical and straightforward.

The parallel connection eliminates the common impedances in grounding circuits by connecting them to the same point, as shown in Figure 6.

Figure 6. Parallel connection.

The parallel connection is the most suitable at low frequencies because there is no cross-coupling between the ground currents from different circuits, and voltages at points a, b, and c depend on each circuit’s current and impedance.

• Va=I1∙Z1
• Vb=I2∙Z2
• Vc=I3∙Z3

This configuration mitigates common-mode noise but is mechanically bulky and costly, requiring a lot of wire in an extensive system.

The wire inductance increases the ground impedance at high frequencies, reaching very high values under resonant conditions when the wire length coincides with odd multiples of a quarter wavelength (λ). The ground path should be shorter than 1/20 of the maximum frequency’s wavelength to prevent resonance effects.

Multi-point Grounding Configuration

The multi-point grounding configuration connects multiple circuits to a ground plane. Unlike the previous arrangement, where the ground connection is at a single point, it is here at several points distributed on a ground plane.

Figure 7 shows circuits connected to the closest ground plane, usually the chassis. A chassis ground connects to an electrical or electronic system’s metal frame – the enclosure containing the components in place.

Figure 7. Multi-point configuration.

The ground paths from each circuit to the ground plane should be short to reduce the impedance and avoid resonance.

This method reduces the individual circuits’ impedance by using short conductors and a low impedance ground plane – due to its low inductance.  The ground plane’s low impedance lessens the common-mode effect.

Employ single-point grounding at frequencies below 1 MHz. Above 10 MHz, multi-point grounding is best. Use single-point grounding between 1 MHz and 10 MHz, keeping the ground paths shorter than 1/20λ.

MIL standards recommend a maximum of 300 kHz for single-point grounding and multi-point grounding afterward.

Hybrid Grounding Configuration

The practice calls for combinations of single-point and multi-point methods for cost reasons and seeking a reasonable behavior to deal with noise.

Different frequencies see unlike configurations in a hybrid ground. Figure 8 is a typical hybrid ground configuration. The capacitive reactance – Xc=1/ωC – decreases as frequency increases, then the low frequencies see a series connection while the high frequencies see the multi-point ground.

Figure 8. Hybrid configuration (with capacitors).

The opposite effect occurs substituting the capacitors with inductors. Since Xl=ωL , the lower frequencies see a low reactance – multi-point – while the higher frequencies see a high reactance – series connection. This arrangement is practical to keep a single-point configuration while connecting the safety ground required by the National Electric Code. Inductors provide low reactance for the power frequency while signals see a high reactance. Figure 9 shows such a connection.

Figure 9. Hybrid configuration (with inductors).
An Overview of Signal Grounding

Noise is an undesirable electrical signal which contaminates an original – desired – signal. Noise can be external or internal to the electronic equipment.

An adequately designed grounding arrangement can reduce noise.

A ground plane is a conductive surface connected to the ground. Theoretically, every point on the ground plane should have the same potential.  The ground plane may be a solid metal sheet or a set of conductors forming a ring or a grid.

The typical signal grounding arrangements are single-point (series and parallel connections), multi-point, and hybrid.

The series configuration employs a series connection of the individual circuit grounds in a daisy chain manner.

All the ground terminals connect to the same point in the parallel connection, eliminating the common impedances.

The multi-point system uses a ground plane to which the circuits connect separately.

Hybrid systems behave differently at low and high frequencies. Depending on the frequency and the use of capacitors or inductors, they can act as single-point or multi-point.


Author: Lorenzo Mari holds a Master of Science degree in Electric Power Engineering from Rensselaer Polytechnic Institute (RPI). He has been a university professor since 1982, teaching topics as electric circuit analysis, electric machinery, power system analysis, and power system grounding. As such, he has written many articles to be used by students as learning tools. He also created five courses to be taught to electrical engineers in career development programs, i.e., Electrical Installations in Hazardous Locations, National Electrical Code, Electric Machinery, Power and Electronic Grounding Systems and Electric Power Substations Design. As a professional engineer, Mari has written dozens of technical specifications and other documents regarding electrical equipment and installations for major oil, gas and petrochemical capital projects. He has been EPCC Project Manager for some large oil, gas & petrochemical capital projects where he wrote many managerial documents commonly used in this kind of works.


Source URL: https://eepower.com/technical-articles/single-point-and-multi-point-signal-grounding/

Assessment of the Impact of Photovoltaic System on the Power Quality in the Distribution Network

Published by Marek GAŁA, Andrzej JĄDERKO,
Czestochowa University of Technology, Faculty of Electrical Engineering


Abstract. The paper offers a characteristic of a photovoltaic (PV) system with the function UPS, equipped with energy storage AQUION ENERGY Battery 25 kWh and a system for monitoring and management of energy flow. Results and their analysis is presented for energy quality measurements carried out at a point of connecting the PV system to the power grid, collected over the period of one week.

Streszczenie. W artykule przedstawiono charakterystykę systemu fotowoltaicznego z funkcją UPS, wyposażonego w magazyn energii AQUION ENERGY Battery 25 kWh oraz system monitorowania i zarządzania przepływem energii. Przedstawiono wybrane wyniki oraz analizę pomiarów jakości energii elektrycznej przeprowadzonych w węźle przyłączenia systemu PV do sieci elektroenergetycznej w reprezentatywnym, tygodniowym okresie badania (Ocena wpływu systemu fotowoltaicznego na jakość energii w sieci dystrybucyjnej).

Keywords: photovoltaic systems; power quality; energy storage
Słowa kluczowe: systemy fotowoltaiczne, jakość energii elektrycznej, magazynowanie energii

Introduction

Price of electricity constantly raises and at the same time the technology of manufacturing efficient photovoltaic panels is becoming increasingly advanced. There are many PV systems available on the market, many of which can also be used by energy consumers, who intend to supply excess of energy to the distribution grid, which is now free of charge and does not require any special permission – all that has to be done is to register a connection with the distribution company. Moreover, it is possible to obtain funds from special programs for financing investment in renewable energy sources. All this explains high demand for PV systems equipped with inverters, control and protection systems. As of the end of May 2018, it is estimated that the power of all PV systems in Poland is about 300 MW, but it can reach 1.2 GW by the end of 2020 [1].

PV systems utilizing solar energy are one of the renewable energy sources (RES) to which article 2 point 22 of Act [11] applies. Act [11] enumerates the following categories of RES: microgeneration plants of total power up to 40 kW, connected to the power grid of voltage lower than 110 kV or of combined thermal power up to 120 kW; small generation plants of power 40 kW – 200 kW, connected to the power grid of voltage lower than 110 kV or of combined thermal power 120 kW – 600 kW. In accordance with article 7a clause 1 of Energy Law Act [10] generation plants and all related devices have to meet technological and exploitation standards in order to be connected to the grid. The standards ensure safety of the power system, which has to be protected against potential damage caused by faulty operation of a generation plant, and they also ensure that the energy quality parameters at the connection point are met.

A fast increase in the number of microgeneration plants can cause significant problems in distribution networks, including deterioration of energy quality. To prevent this, particular distribution companies issue detailed instructions, e.g. [2] [3], complying with general standards and regulations [4, 5, 9] specifying conditions that have to be met by microgeneration plants and small generation plants connected to the grid.

If the amount of electrical energy generated by a prosumer exceeds own consumption, the excess energy can be introduced to the power grid and counted at the ratio of 1 to 0.7 in the case of a plant over 10 kW or at the ratio 1 to 0.8 in the case of a plant below 10 kW – as stipulated in article 4, clause 1 of Act [11]. The prosumer can also include energy storage in their system, thereby optimizing the consumption of self-generated energy.

In what follows, this paper presents characteristics of a PV system with an energy storage. It also offers selected results of measurements of the quality of energy generated by this plant, supplying energy to devices connected into separate circuits.

Characteristics of the PV system

The PV system consists of 76 solar panels, each of power 250 Wp. They are connected to a three-phase photovoltaic inverter Goodwe type GW 17K-DT of nominal power 17.0 kW, capable of working with 20% overload and having efficiency up to 98.2%. The inverter is equipped with two MPPT modules and a switch disconnector. The PV system is also equipped with protection elements, including a protection device Ziehl controlling voltage and frequency, type UFR1001E.

The output circuits of the PV system are connected to three single-phase inverters Victron Energy, type MultiPlus 48/5000/70, working in a three-phase layout and equipped with microprocessor battery charge controllers, with adaptive charging and with continuous energy supply to AC receivers (function UPS). The first inverter mounted at phase L1 plays the role of Master, and the other two work as Followers. The inverters MultiPlus 48/5000/70 are presented in figure 1. The inverters MultiPlus collaborate with energy storage AQUION ENERGY Battery 25 kWh, type M110-LS83. The whole system is controlled by panel Color Control GX by Victron Energy, having access to the Internet and providing support for Victron Remote Management. Registered users and administrators have remote access to the system from PCs and mobile devices. The panel controls the charging of the energy storage, monitors current energy consumption, power obtained from the PV system as well as power supplied to and consumed from the grid. The PV system together with panel Color Control GX ensure that the energy storage is always fully charged, that the receiving circuit is supplied without interruptions and that excess energy from the PV system is directed to the energy storage to be used for own consumption. The energy storage is additionally monitored by Aquion Energy BMS-200 Battery Monitoring System.

Figure 2 presents AQUION ENERGY Battery 25 kWh type M110-LS83, and figure 3 provides an example of a screen view obtained from Victron Remote Management, with information on the flow of energy generated by the PV system.

Fig. 1. View of three PV inverters type MultiPlus 48/5000/70
Fig. 2. AQUION ENERGY Battery 25 kWh type M110-LS83
Fig. 3. A screen view of panel Color Control GX, responsible for managing the operation of a PV system with energy storage
Measurements of the quality of energy generated by the PV system

Apart from detailed technological specifications and criteria concerning connecting microgeneration plants to the power grid, issued by distribution companies (e.g. [3]), of vital importance is the assessment of the influence the plant exerts on energy quality parameters at the node where the plant is connected to the grid (Point of Common Coupling – PCC). It is therefore required that devices being component parts of PV systems are certified for compliance with current standards and directives issued by research institutions.

Compliance of a PV system with requirements and standards concerning energy quality at PCC as described in [3, 4, 5, 9] can be verified on the basis of measurements carried out as specified in e.g. [6, 7, 8, 9]. Such measurements include voltage deviation and variation, voltage imbalance, harmonics and interharmonics, flicker, commutation noise and signal transmission noise.

Below are presented selected results of measurements of energy quality parameters, concerning energy generated by a PV system with energy storage, supplying power to separate circuits in an object. The measurements were carried out at PCC where the PV system with energy storage is connected to the internal grid. The measurements utilized an energy quality analyzer PQ-Box 200, satisfying the standard [8] for class A. The testing took place in summer, during peaks of power generated by the system.

The results presented in this paper include power parameters and energy quality parameters, with the measurements performed during the period of one week. The data aggregation time was tA = 600 s.

Figure 4 presents the rms values of current. The maximal rms value of current was Imax = 17.2 A, and the maximal rms value of current for the aggregation time tA = 0.2 s was Imax 0.2s = 21.4 A. Load asymmetry was also attested, occurring due to the operation of many singlephase appliances in the receiving circuits of the object.

Fig. 4. RMS values of current IL1, IL2, IL3 at the connection node of the PV system

Fig. 5 presents the curve of active powers PL1, PL2, PL3 registered during the week period of observation.

Fig. 5. Active powers PL1, PL2, PL3 at the connection node of the PV system

Resultant active powers transmitted to the grid were obtained under real conditions, taking into account the charging of the energy storage and the operation of receivers in the circuits supplied by the PV system. They were PL1 min = -3.74 kW, PL2 min = -4.14 kW, PL3 min = -4.04 kW (Fig. 5). The three-phase power was Pmin = -11.67 kW. The maximum power consumed from the power grid was Pmax = 4.43 kW.

No significant voltage deformation, nor correlation between such deformation and the level of power generation by the PV system was observed at PCC under scrutiny. The values of the THD factors for voltage were in the interval THD U ∈ 〈1.87, 3.11〉% and satisfied the relevant standards [4, 9]. Figure 6 presents the values of instantaneous current registered at the power Pmin = -11.67 kW.

Fig. 6. Instantaneous currents for the case Pmin = -11.67 kW

The assessment of higher current harmonics content was performed in accordance with the standard [5] and requirements specified in [3]. To this end, the value of short-circuit factor was determined for the PCC

.

on the basis of short-circuit power SkPCC at the PCC and apparent power SEmax that can be achieved by the plant, obtaining RkPCC = 33. Besides, the value of the reference current Iref, i.e. the rated continuous current of the PV system, was obtained on the basis of measurements. Then the rms value of the fundamental of the reference current I1 ref was determined. Taking into account the measured rms values of higher current harmonics, the factors THD I and PWHD I were calculated:

.

The relative values of the higher current harmonics of the order n = 2,…,40 were found and referred to the fundamental I1 ref. No significant change in the degree of current deformation was found to be dependent on the variation of power generated by the PV system – figure. 7. The steep increases in THD I up to 12.89% visible in figure 7 were caused by current received by nonlinear sources of light, switched on during nighttime and supplied from the phase L2 circuit. Figure 8 presents relative values of current harmonics determined at Pmin. As these values indicate, the phase currents are deformed only to a slight extent. The harmonics of the order n = 3, 5, 7, 9 are dominant.

Fig. 7. Values of factors THD IL1, THD IL2, THD IL3 at the connection node of the PV system
Fig. 8. Relative spectrum of current harmonics for Pmin

Table 1 presents the maximal values of current harmonics with reference to I1 ref. Table 2 presents maximal values of the factors THD I and PWHD I.

Table 1. Relative values of the main current harmonics compared to the limits specified in [6]

.

Table 2. THD and PWHD factors of current compared to the limits specified in [6]

.

It can be observed that the values of factors THD I and PWHD I do not exceed the limit – cf. Table 2. On the other hand, the content of the 9. and 13. harmonics is relatively slightly exceeded in phase L2, due to nonlinear light sources supplied from the output circuits of the PV system – cf. Table 1.

Figure 9 presents the voltage coefficient curve. The values of the voltage unbalance factor were within the interval 0.09% to 0.43%, i.e. much below the limit of 2%. The value of rms voltage likewise varies within the limits.

Fig. 9. Voltage asymmetry coefficient αU

Figures 10 and 11 present the variation of the indices Pst and Plt respectively. The occurrence of limit values of the indices Pst = 1.0 and Plt = 0.65 was attested only once and only in one of the phases during the weekly period of testing.

Fig. 10. Indices of short-term flicker severity Pst L1, Pst L2, Pst L3 at the connection node of the PV system
Fig. 11. Indices of long-term flicker severity Plt L1, Plt L2, Plt L3 at the connection node of the PV system
Conclusions

PV system equipped with energy storage and an advanced system for monitoring and managing energy flow offers a way to utilize energy for one’s own consumption, at the same time ensuring continuous supply. As this study indicates, the system under scrutiny does not cause deterioration of energy quality beyond the admissible limit. Thus, despite a single occurrence of limit values of indices Pst and Plt defined in [3], electric energy in the node investigated in this study met all quality requirements specified in [4, 9].

REFERENCES

[1] Photovoltaic market in Poland. Institute of Renewable Energy (Rynek fotowoltaiki w Polsce. Instytut Energetyki Odnawialnej), Warsaw, June 2018.
[2] Instructions for Distribution Network Traffic and Exploitation applicable since 01.01.2014, TAURON Dystrybucja S.A. (Instrukcja Ruchu i Eksploatacji Sieci Dystrybucyjnej TAURON Dystrybucja S.A. obowiązująca od dnia 01.01.2014 r.).
[3] Connection criteria and technical requirements for microgeneration plants and small-scale generation plants connected to the LV distribution network (Kryteria przyłączania oraz wymagania techniczne dla mikroinstalacji i małych instalacji przyłączanych do sieci dystrybucyjnej niskiego napięcia) TAURON Dystrybucja S.A., Krakow, July 18, 2016.
[4] EN 50160: Voltage characteristics of electricity supplied by public distribution system.
[5] IEC 61000-3-12:2011 Electromagnetic compatibility (EMC) – Part 3-12: Limits – Limits for harmonic currents produced by equipment connected to public low-voltage systems with input current >16 A and ≤ 75 A per phase.
[6] IEC 61000-4-7:2002+A1:2008 Electromagnetic compatibility (EMC) – Part 4-7: Testing and measurement techniques – General guide on harmonics and interharmonics measurements and instrumentation, for power supply systems and equipment connected thereto.
[7] IEC 61000-4-15:2010 Electromagnetic compatibility (EMC) – Part 4-15: Testing and measurement techniques – Flickermeter – Functional and design specifications.
[8] IEC 61000-4-30:2015 Electromagnetic compatibility (EMC) – Part 4-30: Testing and measurement techniques – Power quality measurement methods.
[9] The Ministry of Economy ordinance on the detailed conditions of the power system operation, Journal of Laws of 2007, no, 93, item 623 with later amendments (Rozporządzenie Ministra Gospodarki z dnia 4 maja 2007 r. w sprawie szczegółowych warunków funkcjonowania systemu elektroenergetycznego, Dz. U. z 2007 r., nr 93, poz. 623 z późn. zm.).
[10] Act on Power Law of 10 April 1997, Journal of Laws of 1997 no 54, item 348, with later amendments (Ustawa z dnia 10 kwietnia 1997 r. Prawo energetyczne, Dz. U. z 1997 r., nr 54, poz. 348 z późn. zm.).
[11] Act on Renewable Energy Sources of 20 February 2015, Journal of Laws of 2015, item 478 (Ustawa z dnia 20 lutego 2015 r. o odnawialnych źródłach energii (Dz. U. z 2015 r., poz. 478).


Authors: dr inż. Marek Gała, Politechnika Częstochowska, Wydział Elektryczny, 42-200 Częstochowa, Al. Armii Krajowej 17, e-mail: m.gala@el.pcz.czest.pl
dr inż. Andrzej Jąderko, Politechnika Częstochowska, Wydział Elektryczny, Al. Armii Krajowej 17, 42-200 Częstochowa, e-mail: aj@el.pcz.czest.pl


Source & Publisher Item Identifier: PRZEGLĄD ELEKTROTECHNICZNY, ISSN 0033-2097, R. 94 NR 12/2018. doi:10.15199/48.2018.12.35

Detect and Eliminate Harmonics: Why?

Published by Electrical Installation Wiki, Chapter M. Power harmonics management – Detect and eliminate harmonics: why?


Harmonic Disturbances

Harmonics flowing in distribution networks represent disturbances in the flow of electricity. The quality of electrical power is deteriorated, and the efficiency of the system is decreased.

Here are the main risks linked to harmonics:

Overload of distribution networks due to the increase of r.m.s. currents,
Overload of neutral conductors, which current can exceed the phase currents,
Overload, vibration and premature ageing of generators, transformers and motors as well as increased transformer hum,
Overload and premature ageing of Power Factor Correction capacitors,
Distortion of the supply voltage that can disturb sensitive loads,
Disturbance in communication networks and telephone lines.

Economic Impact of Disturbances

All these disturbances have an economic impact:

Premature ageing of equipment means it must be replaced sooner, unless oversized right from the start,

Overload on the distribution network means higher equipment rating, increased subscribed power level for the industrial customer, and increased power losses,

Unexpected current distortion can lead to nuisance tripping and production halt.

A Necessary Concern for the Design and Management of Electrical Installations

Harmonics are the result of the always expanding number of power electronic devices. They have become abundant today because of their capabilities for precise process control and energy saving benefits. Typical examples are Variable Speed Drives in the Industry, and Compact Fluorescent Lamps in commercial and residential areas.

International standards have been published in order to help the designers of equipment and installations. Harmonic emission limits have been set, so that no unexpected and negative impact of harmonics should be encountered. In parallel to a better understanding of effects, solutions have been developed by the Industry.

Harmonic consideration is now a full part of the design of electrical installations.


Author: This Electrical Installation Wiki is a collaborative platform, brought to you by Schneider Electric: our experts are continuously improving its content, collaboration is also open to all.

The Electrical Installation Guide (wiki) has been written for electrical professionals who must design safe and energy efficient electrical installation, in compliance with international standards such as the IEC 60364.


Source URL: https://www.electrical-installation.org/enwiki/Detect_and_eliminate_harmonics:_why%3F

Reactors in a Power System

Published by Alex Roderick, EE Power – Technical Articles Reactors in a Power System, May 03, 2021.


This article highlights two common types of reactors which are the dry-type and the oil-immersed.

In an AC circuit, reactance is the opposition to current flow. A reactor, also known as a line reactor, is a coil wired in series between two points in a power system to minimize inrush current, voltage notching effects, and voltage spikes. Reactors may be tapped so that the voltage across them can be changed to compensate for a change in the load that the motor is starting. Reactors are rated by the ohms of impedance that they provide at a given frequency and current. Reactors may also be rated by the I2R loss across the device at a certain frequency at a rated current.

Two common types of reactors are the dry-type and the oil-immersed. The dry-type is open and relies on the air to circulate and dissipate the heat. Dry-type reactors are common in low-voltage applications.

Oil-immersed reactors are common in high-voltage applications. Oil-immersed reactors are placed in tanks and require a magnetic shield to prevent eddy currents from circulating in the tank. The shield is made from laminated steel sheets like the transformer core and motor stators.

Reactors may be used as line  or load reactors (see Figure 1). Line reactors are used when low line impedance allows high inrush current, when power factor correction capacitors are used, or when a motor drive causes notching. Load reactors are installed at the output of a motor drive. Load reactors help eliminate voltage spikes or reflected wave noise by slowing down the rate of change in the drive output voltage. However, load reactors have a tendency to overheat due to the harmonic content of the output waveform from the motor drive. The reactor must be designed to reduce the harmonic distortion.

Figure 1. Reactors are used as line or load reactors. Image courtesy of Transcoil
Inrush Current

Many electrical devices draw high currents at startup or have very low impedance to the flow of current. For example, electric motors typically draw many times their full-load current during startup. This inrush current can cause voltage sags that trip out other equipment. Many full-voltage motor starters use reactors to increase the impedance and limit the inrush current. Large capacitor banks used to correct for low power factor have very low impedance when the capacitor bank is first switched ON, and the capacitors begin charging. Low impedance means that the flow of current is very high. A reactor can be added in series to increase the reactance. The increased reactance increases the impedance and reduces the inrush current (see Figure 2).

Figure 2. Line reactors are used to reduce inrush current. Image courtesy of Schneider Electric
Reduced Notching

To reduce notching, the source of the notching needs to be isolated or buffered from other equipment that uses the same power distribution system. Creating a voltage divider is a relatively simple way to minimize notching. See Figure 3. When impedance in the form of a reactor is added in series with an SCR controller, the notch voltage is distributed across the new impedance and the impedance already existing in the feeder lines. The added impedance reduces the notch depth and widens the notch width. Experience has shown that the reactor should have about 3% impedance to reduce the notch depth by about 50%. This is enough to eliminate the extra zero crossovers that cause problems. Higher impedance may cause problems with sensitive equipment because the wider notch may be seen as a loss of voltage. Lower impedance may not reduce the notch depth enough to eliminate the problems.

Figure 3. A reactor can be added in series with an SCR power source to reduce notching.
Note

Transients on a line can cause electronic equipment to generate errors. Digital electronic circuits operate on low-level digital signals that can be corrupted by a false signal induced by the transient voltage.

Saturable-Core Reactors

When an iron core is saturated, substantially all the magnetic domains are aligned with the applied magnetic field. Further increases in the applied magnetic field do not result in increases in magnetic flux. Therefore, there is no increase in the voltage induced in opposition to the change in current. In other words, an inductor loses its ability to oppose changes in current when its core becomes saturated.

A saturable-core reactor is an inductor whose inductance is regulated by a magnetic field produced by a second winding wound around the same iron core as the primary winding. The “power” winding of a saturable-core reactor is the winding carrying the AC load current. The “control” winding of a saturable-core reactor is the winding carrying the DC control current. The control winding is carrying DC strong enough to create a magnetic field that saturates the core.

An increase in DC through the control winding produces an increased magnetic flux in the reactor core. An increase in the magnetic flux moves the reactor core closer to saturation and decreases the inductance of the power winding. A decrease in inductance in the power winding increases the current delivered to the load through the power winding. Therefore, a saturable-core reactor can be used as an amplifier where a relatively small DC through a control winding can control a relatively large AC through the power winding.

In actual practice, a saturable-core reactor consists of two pairs of windings (see Figure 4). The small dots near the saturable-core reactor coils indicate polarity. The power windings are in phase with each other, and the control windings are out of phase with each other. This allows the saturable-core reactor to saturate the core equally in both positive and negative alternations of the AC cycle.

Figure 4. Saturable-core reactors can use a small direct current as a way to control a large alternating current in a power circuit.

Saturable-core reactors were very popular in the plating industry before the advent of DC drives to control the current in the plating solution. In the case of a plater, the part being plated is the load. If no DC is flowing in the control coil, then the IR drop will be controlled by the amount of current in the reactor. With DC current in the control coil, the DC flux will flow in the core and limit the amount of AC flux in the core. Lower AC flux means less reactance and less impedance to the circuit current. Large amounts of AC current can be controlled by a small amount of DC current. This control is very linear and very reliable. Saturable-core reactors have fallen out of use in this type of application because the cost to build a reactor is much higher than building a DC drive.

Note

Saturable-core reactor power supplies used at high power levels are extremely reliable devices because there are no moving parts.

Chokes

A choke, also known as a line choke, is a reactor that is used to limit current to AC or DC drives in the event of short circuits inside the drive. When large short-circuit currents are drawn from the source, the choke starts to build a counter-voltage, and the voltage available to the drive is reduced. The reduced voltage causes the instantaneous electronic trip (IET) circuit to trip the drive off-line to avoid damage. Chokes have large conductors with fewer turns and offer low impedance to the line into the drive.

A common-mode choke is a reactor that reduces common-mode noise current produced by rapid motor drive or device switching (see Figure 5). Load current flows through one winding of the common-mode choke to the load and then flows through the other winding away from the load. This results in two opposite magnetomotive forces that cancel and result in zero inductance. With a common-mode noise, the currents flowing through the two windings of the common-mode choke are in the same direction. Hence, in-phase flux created in each of the windings will add together rather than being canceled as in the case of a differential noise component. This will result in a magnetomotive force that opposes the flow of the common-mode noise. 

These common-mode components will flow to the ground as shown in Figure 5. The net result is that a common-mode choke allows the load current to flow almost unimpeded while blocking the flow of common-mode noise current.

Figure 5. Common-mode chokes are used to reduce the severity of drive-induced common-mode noise. Image Courtesy of Power Systems Design

Common-mode chokes are often used to reduce drive-induced common-mode noise. A common-mode choke provides high inductance to oppose common-mode noise currents generated during drive switching. The magnitude and rise time of the noise current are reduced to the point where they are below the noise threshold of affected equipment.

Resonance

Capacitor banks are often used to correct low-power-factor situations. In systems with large amounts of capacitance used to correct power factor, high-voltage distortion can cause resonance at system harmonic frequencies. This results in series-or parallel-resonant currents, which can be very damaging to the electrical system. 

Figure 6. A reactor in series with a variable-speed motor drive shifts the resonance frequency away from any harmonics on the line.

Adding a reactor to the incoming power line to the motor drives is a common technique for minimizing the impact of motor drives on other loads in the electrical system (see Figure 6). The added reactance ahead of a motor drive alters the resonance frequency and decreases the amount of distortion in the motor drive’s input current.


Author: Alex earned a master’s degree in electrical engineering with major emphasis in Power Systems from California State University, Sacramento, USA, with distinction. He is a seasoned Power Systems expert specializing in system protection, wide-area monitoring, and system stability. Currently, he is working as a Senior Electrical Engineer at a leading power transmission company.


Source URL: https://eepower.com/technical-articles/reactors-in-power-system/

Types of Surge Arresters

Published by Lorenzo Mari, EE Power – Technical Articles: Types of Surge Arresters, December 18, 2020.


Learn about the most common types of surge arresters used to protect against transient overvoltages and lightning strikes.

Surge arresters introduce shunting resistance to the ground when a surge appears, absorbing energy from the surge without the voltage becoming excessive. They then extinguish the power follow current after dissipating the surge. The most common arrester types in power systems are silicon carbide (SiC) and zinc oxide (ZnO). This article describes these arrester types in more detail.

Characteristics of Different Surge Arrester Types

The first surge arresters provided lightning protection utilizing an air gap connected between the line and the ground. Their main drawback was the requirement of a series linear resistance and a fuse to break the power follow current. Additionally, when the gap sparks over, it creates a fault in the circuit – and an unpleasant outage when cleared by a circuit breaker.

A device able to limit the voltage without producing a power outage is more appealing.

After several generations of surge arresters, the introduction of valve-type silicon-carbide arresters in 1954 was a significant technological advance. The valve element (or valve block) consisted of a non-linear resistor – commonly silicon carbide (SiC) – whose value decreases abruptly as the voltage rises. The name valve block comes from the valving action to the flow of the current.

Silicon carbide arresters allowed for a reduction to the basic lightning impulse insulation level (BIL) of substation equipment, high fault current withstand, and smaller size, with significant economic savings.

Introduced around 1976, modern metal-oxide arresters – typically zinc oxide (ZnO) – do not need gaps and exhibit better handling characteristics for switching surges, reduced current under steady-state conditions, and reduced lead lengths.

Although silicon carbide arresters provided good service for many years, the better performance and improved power system availability make metal-oxide devices a better choice.

There are arresters with different voltage and power levels to best suit the protected equipment’s needs.

Silicon Carbide (SiC) Valve-Type Surge Arresters

SiC valve-type surge arresters employ a non-linear valve element (resistor) made of silicon carbide and inorganic binders. Silicon carbide is a compound of silicon and carbon.

Some arrester applications require that the valve element have a low resistance value during steady-state conditions to deal with particular surge and power system characteristics, creating excessive power losses. Valve-type surge arresters have spark gaps in series with the valve elements to manage this difficulty.

Series spark gaps keep the valve element isolated under steady-state conditions, in order to reduce losses, and they introduce the valve element when a surge emerges from the gap’s sparkover. There is no leakage current flow between the line and earth, allowing the valve design to deal with its voltage-limiting role and energy dissipation capacity only under surge conditions.

The total voltage across the arrester is the gaps’ sparkover level plus the voltage across the valve element. The lower the total voltage, the better the protection level.

SiC arresters also contain current limiting gaps to limit the system follow current. These gaps reduce the energy absorbed during operation, allowing for fewer valve elements, shorter arrester length, and reduced voltage levels. The arrester gaps exhibit drawbacks, like producing transients during the sparkover to engage the valve elements.

Another crucial matter is the arc-quenching ability of the arrester. Arrester design provides creative ways for quenching the arcs created in the gaps, protecting the valve element against the continuous flow of current – the follow current – after the surge is rerouted and steady-state conditions resume.

Figure 1 shows a volt-ampere characteristic for a gapped silicon-carbide arrester.

Figure 1. V-I characteristic of a gapped silicon-carbide surge arrester. Image courtesy of Industrial-electronics.

Figure 2 shows a diagram of a typical 6kV silicon-carbide surge arrester with its components: main gap units, magnetic coil, valve elements, bypass gap, and shunting resistors.

Figure 2. Schematic diagram of a gapped silicon-carbide surge arrester. Image courtesy of General Electric.

The pre-ionizing tips help to initiate the gap’s breakdown when an overvoltage develops. The bypass gap short-circuits the magnetic coil during the surge current transit, placing the surge voltage across the valve element, which presents low resistance at high voltage, and the surge current goes to the ground. The magnetic coil helps to quench the arcs into the main gaps after the surge current passes. The shunting resistors regulate the power frequency voltage across the main gap elements.

Figure 3 shows silicon carbide surge arresters for various voltages.

Figure 3. Silicon-carbide surge arresters. Image courtesy of General Electric.
Metal-Oxide Surge Arresters (MOSA)

A metal-oxide surge arrester contains non-linear metal–oxide resistive disc elements with excellent thermal energy withstand capabilities. Each disc includes powdered zinc oxide material mixed with other metal oxides. This type of surge arrester works like a high-speed electronic switch – opened at steady-state voltages and closed at overvoltages. 

Zinc oxide surge arresters are highly non-linear – their non-linear characteristic is much more pronounced than that of silicon carbide – and have low losses under steady-state conditions.

There are three types of metal-oxide arresters:

• Gapless
• Series-gapped
• Shunt-gapped

As with silicon-carbide surge arresters, the first metal-oxide arresters had a gap in series with non-linear resistors. At that time, the resistors’ thermal duty was relatively small and they could not withstand the thermal energy of the leakage current under steady-state conditions, requiring the gap. Gapless arresters appeared around 1980, and their resistors tolerate the constant small leakage current. 

Zinc oxide arresters are easy to manufacture, have low cost, and absorb or dissipate large amounts of energy. Nowadays, most arresters employed in new systems or revamps are gapless zinc oxide devices.

Figure 4 shows a gapless zinc oxide surge arrester’s cutaway, containing a single column of ZnO blocks.

Figure 4. Parts of a porcelain-housed gapless zinc-oxide surge arrester. Image courtesy of ABB.
1Porcelain insulator6Sealing cover
2Venting duct7Sealing ring
3Spring8Indication plates
4Desiccant bag9ZnO-blocks
5Copper sheet10Flange cover
.

Figure 5 shows a high voltage zinc oxide surge arrester for areas with very high lightning intensity. Note the external grading rings that long arresters regularly require to maintain constant voltage stress along their length.

Figure 5. Zinc-oxide surge arrester. Image courtesy of ABB
Surge Arrester Classification and Application

Based on voltage rating, protective characteristics, and durability in pressure-relief or fault-withstand characteristics, the classification of surge arresters used in power systems is as follows:

• Station arresters: Provide the best protective levels – lower discharge voltages, higher energy absorption, and more significant pressure relief. Typical applications are large substations and sites with strong surges.

• Intermediate arresters: Have inferior protective characteristics and energy discharge capability. Typical applications are small substations, underground cable protection, and dry-type transformers.

• Distribution arresters: Provide the lowest protective levels and energy discharge capability. They are used in medium voltage networks.

Insulation Coordination

The system and equipment insulation’s voltage withstand ability depends on the surge’s rise time. In this instance, insulation capability is a function of time.

A surge arrester’s protective characteristics are also a function of time; hence, the need for coordinating the insulation and arrester volt-time characteristics to get adequate protection – the insulation coordination procedure.

Insulation coordination compares the system or equipment insulation’s impulse withstand ability with the voltage across the arrester for the selected discharge current, in accordance with the preferred protection level. The choice of insulation levels and coordination practices affects costs considerably. A drop of one level in BIL can reduce major electrical equipment costs by thousands of dollars.

As an example, Figure 6 shows the entire V-I withstand curve for an oil-filled power transformer and the protective characteristics of a surge arrester – front-of-wave sparkover and discharge voltage.

Figure 6. Oil-filled transformer insulation withstand and arrester protective characteristics. Image courtesy of Cooper.

The arrester’s sparkover crest voltage should be below the transformer’s chopped wave withstand. It is safer to compare the arrester’s sparkover with the transformer’s front-of-wave test when the latter is available.

Another comparison is the arrester’s discharge voltage and the 1.2/50 µs impulse sparkover with the transformer’s full-wave test (BIL).

A Review of Surge Arrester Types and Characteristics

The first surge protective devices were the rod gaps. Rod gaps are cheap but have several disadvantages: they may not protect for fast fronts, produce steep surges during sparkover, and generate a fault on every operation – they do not reseal.

Silicon-carbide valve-type surge arresters employ a silicon carbide non-linear valve element and series spark gaps. The spark gaps keep the valve element isolated under steady-state conditions – reducing losses – and activates it when a surge emerges, but they create transients during the sparkover.

Zinc-oxide arresters were introduced around 1976. Zinc oxide is a substitute for silicon carbide. ZnO arresters have a more pronounced non-linear characteristic than SiC and can be used without series gaps due to their small current at nominal voltage. Yet, they are extremely effective at limiting surge voltages.

Most arresters employed today in new systems or revamps are gapless zinc-oxide devices.

There are three classes of power system surge arresters: station-, intermediate-, and distribution-class. Station arresters provide the best protective levels but are more expensive.

Insulation coordination is essential. This coordination compares the system or equipment insulation’s impulse withstand ability with the voltage across the arrester while surge current is being discharged.


Author: Lorenzo Mari holds a Master of Science degree in Electric Power Engineering from Rensselaer Polytechnic Institute (RPI). He has been a university professor since 1982, teaching topics as electric circuit analysis, electric machinery, power system analysis, and power system grounding. As such, he has written many articles to be used by students as learning tools. He also created five courses to be taught to electrical engineers in career development programs, i.e., Electrical Installations in Hazardous Locations, National Electrical Code, Electric Machinery, Power and Electronic Grounding Systems and Electric Power Substations Design. As a professional engineer, Mari has written dozens of technical specifications and other documents regarding electrical equipment and installations for major oil, gas and petrochemical capital projects. He has been EPCC Project Manager for some large oil, gas & petrochemical capital projects where he wrote many managerial documents commonly used in this kind of works.


Source URL: https://eepower.com/technical-articles/types-of-surge-arresters/

Substation Protection Against Transient Overvoltages and Lightning Strikes

Published by Lorenzo Mari, EE Power – Technical Articles: Substation Protection Against Transient Overvoltages and Lightning Strikes, December 11, 2020.


Learn how surge arresters protect power substations against lightning and switching overvoltages.

Transient overvoltages are typical of power systems. The sources of overvoltages are direct or nearby lightning strikes, switching operations, electromagnetic pulses, and electrostatic discharges. The classical device to protect equipment in substations against the effects of transient overvoltages is the surge arrester.

The most frequent transient overvoltage in substations comes from switching operations, and the most fearful is lightning, which introduces large disturbances.

Lightning-Caused Transient Overvoltages

Lightning is a prime source of transient overvoltages. In a substation shielded from direct strikes and with relatively low ground resistance, the most likely source of lightning surges is traveling waves entering through the overhead lines.

When lightning strikes an overhead line, it initiates a traveling wave. The traveling wave’s current value depends on the magnitude of the lightning surge, the line surge impedance, and the tower footing resistance. With phase conductors adequately shielded from direct strikes, the leading cause of the traveling waves is insulator flashover; in such cases, the overvoltage magnitude is the insulator flashover value.

Lightning is random, and there is always a possibility that a lightning strike, bypassing the substation’s shield, hits the protected circuits in or close to the substation.

The standard device to protect equipment in substations against overvoltages is the surge arrester. When connected from each phase conductor to the ground, the surge arrester transfers the high surge currents safely to the ground, protecting the system and equipment – such as transformers, circuit breakers, and bushings – insulating against the consequences of overvoltages.

Some Useful Terms

There are many terms in the analysis of power system electrical transients.  A few useful terms to be aware of are:

Power-frequency: 60 Hz or 50 Hz, depending on the country’s standard.
Flashover: a disruptive discharge around or over an insulator’s surface. Not to be confused with sparkover, which is a surge arrester term.
Sparkover: a disruptive discharge between the surge arrester’s electrodes. This term does not apply to gapless metal-oxide arresters.
Power-frequency withstand voltage: the highest rms applied voltage at which an arrester will not flashover.
Impulse withstand voltage: the highest crest value of the surge voltage at which an arrester will not flashover.
Power follow current: power-frequency current through an arrester, during and after the passage of surge current. This term does not apply to metal-oxide arresters.
Arrester voltage rating: maximum power-frequency rms line-to-ground voltage to which an arrester may be exposed, even under transient conditions.
Arrester discharge voltage: the voltage across the arrester while carrying surge current.
Arrester discharge current: The current flowing through an arrester, resulting from a striking surge.
Power-frequency sparkover: the minimum power-frequency rms voltage that will initiate sparkover between the line and ground terminals. This term does not apply to gapless metal-oxide arresters.
Front-of-wave sparkover: the voltage on the front of an impulse wave, rising at a preset constant rate, at which the arrester sparks over.
1.2/50 µs impulse sparkover: the highest impulse voltage that an arrester will allow without sparkover. This term does not apply to gapless metal-oxide arresters.
Maximum continuous operating voltage (MCOV): the maximum rms power frequency voltage that may be applied continuously between the arrester’s terminals. This term only applies to metal-oxide arresters.

Dielectric Tests

Anomalous voltage stresses cause early insulation failure. Insulation withstand refers to the voltage tolerated by equipment insulation without failure.

Knowing the withstand capability and endurance qualities of the insulation system is vital. Insulation-type designations, as well as high-potential and surge-voltage tests, classify the insulation’s properties and state the withstand capabilities.

Overvoltage tests certify the ability of the equipment insulation to outlive various stress levels after manufacturing completion. The most common tests are:

• Basic Lightning Impulse Insulation Level (BIL)
• Chopped Wave Withstand (CWW)
• Basic Switching Impulse Level (BSL)
• Front-of-wave-test

Let’s explore each of these tests a bit more.

Basic Lightning Impulse Insulation Level (BIL)

The BIL is the full-wave test. The standard impulse is a 1.2/50 µs (T1/T2 µs) waveshape, with a crest specified in kilovolts. This means that the voltage pulse increases from zero to crest value in 1.2 µs and declines to ½ crest value in 50 µs. The rise time and duration of this waveshape replicate a lightning surge.

The oscillogram of actual voltage may be challenging to interpret, particularly at the beginning of the waveshape. In this case, the BIL test finds a virtual time zero by locating points on the wave’s front where the voltage is 30% and 90% of the crest value and draws a straight line through these points. The virtual time zero is the intersection of this line with the time axis.

Figure 1 shows the standard 1.2/50 µs open-circuit voltage waveshape.

Figure 1. Standard 1.2/50 µs open-circuit voltage waveshape.

T1 is the time from the virtual zero to a point determined by the straight line’s intersection with a horizontal line at crest voltage value. T2 is the time from the virtual zero to half the crest value on the wave tail.

Therefore, T1 = 1.2 µs is the duration of the wavefront, and T2 = 50 µs is the time from the virtual zero to ½ crest value.

Another way to compute the time to crest is 1.67 times the actual time between 30% and 90% of the crest value. The crest values are classified into discrete values. A given rated voltage may have more than one BIL level.

The lightning strike’s currents also vary over a broad span. The industry standard impulse current is an 8/20 µs (T1/T2 µs) waveshape, as shown in Figure 2.

Figure 2. Standard 8/20 µs impulse current waveshape.

Another way to compute the time to crest is 1.25 times the actual time between 10% and 90% of the crest value.

Chopped Wave Withstand (CWW)

The waveshape for this test is the same used to determine the BIL, but it collapses at a time t – specified in the standard – after the wave’s crest by sparkover of an external rod gap shunting the tested equipment. The crest voltage is from 110% to 115% of BIL (Figure 3).

Figure 3. Sparkover on the tail.
Basic Switching Impulse Level (BSL) 

The BSL test of equipment is similar to the BIL but focuses on switching impulse rather than lightning. The wave shape depends on the tested equipment.

Front-of-wave Test

This test is similar to the chopped-wave test, but the voltage is cut off by a rod gap on the rising front of the wave at a time t rather than shortly after the wave’s crest. The gap limits the voltage to a preset value (Figure 4).

Figure 4. Front-of-wave sparkover.

The previous description involves general principles of dielectric testing. Standards for individual types of equipment detail the precise tests and methods to apply to the apparatus concerned.

Operation Principle of Surge Arresters

Insulation costs are very high, so insulating the system and equipment to resist any voltage that would ever appear is not economically viable. It is also impractical to insulate for steady-state voltage and accept all outages originating from surges. It is reasonable to look for a balance between the costs of insulation and protective devices.

Surge arresters are vital to protect the substations against lightning and switching surges. Their surge protective capability determines the power system insulation levels.

The duty of a surge arrester is to avoid exceeding the system and equipment withstand capabilities. Then, whenever a surge tries to exceed the insulation capacity, the arrester will keep the voltage in the acceptable range, protecting expensive electrical devices. 

Surge arresters are generally connected in parallel with the protected equipment and are subjected to the system voltage under normal operating conditions. Under steady-state voltage, their impedance is very high. However, it decreases abruptly at higher voltages when a steep wavefront surge comes into the system. The surge arrester diverts the wave’s portion above the arrester breakdown to the ground, away from the downstream protected equipment, as shown in Figure 5.

Figure 5. Operation principle of the surge arrester.

For the surge suppressor to adequately protect the equipment, the voltage that the suppressor sees before and after the surge’s arrival must not overshoot the voltage that the equipment can carry. 

In addition to the arrester’s capability to keep the voltage within an acceptable level, a vital factor to consider is its capacity to store or dissipate energy. The diverted current through the arrester and the voltage across it make the device absorb a quantity of energy that depends on the surge’s magnitude and duration. The arrester must store or dissipate this energy without any damage.

Under steady-state conditions, its resistance should be high enough to consume little current and dissipate minimal power.

To summarize, a surge arrester should:

• Display a high resistance under steady-state conditions, consuming a small leakage current – if any – and withstand the thermal stress it produces.
• Protect against an overvoltage, discharging the surge current immediately and limiting the voltage within a specified upper value – the arrester discharge voltage.
• Withstand the thermal energy generated by the surge current through the arrester elements – the arrester discharge current.
• Restore the steady-state conditions immediately after the surge voltage and current disappear, and interrupt the follow current.
• Possess switching surge discharging capability within specified levels.
• Be capable of discharging transmission lines

Separation Distance in a Surge Arrester

The surge arrester should be as close as possible to the equipment it protects because whatever it lets through before it operates will reflect with the same polarity– the equipment’s surge impedance is usually much greater than the line’s surge impedance (Figure 6).

If there is a large separation between the equipment and the surge arrester, the terminal voltage can reach a high value before being reduced by a reflection from the arrester.

Figure 6. Surge arrester separated from a transformer. Image courtesy of McGraw-Edison Company.

Keeping the surge arrester’s leads short reduces their inductance. We must avoid a situation in which the action of a surge arrester is nearly blocked or drastically delayed by the lead’s inductance.

A Review of Substation Protection Against Transient Overvoltages

A surge is a temporary steep rise of voltage in a power system, usually due to lightning or internal causes – mainly switching maneuvers. The energy contained in a surge may cause the failure of insulation in electrical systems and equipment unless they are correctly protected.

Surge arresters protect power substations by limiting lightning and switching overvoltages to a specified protection level below the insulation withstand voltage. 

Surge arresters have non-linear voltage and current characteristics, allowing them to start conduction at a specified voltage level, hold the voltage for the overvoltage duration, and stop conduction when the voltage returns to steady-state conditions. The arresters absorb or dissipate the overvoltage energy, as well.

The dielectric tests verify the ability of the system and equipment insulation to withstand various forms of surges. 

In the next article, we dive deeper into the features and characteristics of different surge suppressors by exploring their materials, topographies, and applications.


Author: Lorenzo Mari holds a Master of Science degree in Electric Power Engineering from Rensselaer Polytechnic Institute (RPI). He has been a university professor since 1982, teaching topics as electric circuit analysis, electric machinery, power system analysis, and power system grounding. As such, he has written many articles to be used by students as learning tools. He also created five courses to be taught to electrical engineers in career development programs, i.e., Electrical Installations in Hazardous Locations, National Electrical Code, Electric Machinery, Power and Electronic Grounding Systems and Electric Power Substations Design. As a professional engineer, Mari has written dozens of technical specifications and other documents regarding electrical equipment and installations for major oil, gas and petrochemical capital projects. He has been EPCC Project Manager for some large oil, gas & petrochemical capital projects where he wrote many managerial documents commonly used in this kind of works.


Source URL: https://eepower.com/technical-articles/substation-protection-against-transient-overvoltages-and-lightning-strikes/

Faults and Defects in Power Transformers – A Case Study

Published by Cacilda de Jesus Ribeiro1; André Pereira Marques2,3; Cláudio Henrique Bezerra Azevedo2; Denise Cascão PoliSouza1; Bernardo Pinheiro Alvarenga1; Reinaldo Gonçalves Nogueira1

1School of Electrical and Computer Engineering, Federal University of Goiás, Goiânia, GO, Brazil,
2CELG Distribuição, Goiânia, GO, Brazil,
3Federal Institute of Education, Science and Technology of Goiás, Goiânia, GO, Brazil


Abstract – Power transformers play a fundamental role in electrical power systems, in addition to representing significant investments involved in the implementation of these systems. To reduce the costs associated with a transformer’s life cycle and to guarantee its reliability and durability, it is essential to monitor its operating conditions, its insulation system, and the working conditions of its accessories and other components. Therefore, the aim of this work is to study the faults and defects that occurred in 34.5 kV, 69 kV, 138 kV, and 230 kV oil-immersed power transformers of the electrical system and the insulation system of CELG, a major electric energy concessionaire in the state of Goiás, Brazil. The results of this study, i.e., the efficacy of the predictive technique for maintenance over the last 28 years (from 1979 to 2007), the characterization of faults and defects during this period, and the presentation of proposals for improvements in the predictive technique, aimed at reducing the number of stoppages in the electric power supply system, are expected to contribute to the body of knowledge in this field.

I. INTRODUCTION

A power transformer is one of the most important and costly devices in electrical systems. Its importance is attributed directly to the continuity of power supply, since its loss through failure or defect means a supply stoppage. This is a large piece of equipment whose substitution is expensive and involves a lengthy process.

Research for new technologies and new predictive maintenance techniques has greatly contributed to reduce supply stoppages, thereby ensuring improved reliability of energy supply. Several studies highlight the importance of optimizing maintenance processes and diagnoses of substation equipment such as transformers [1].

In this context, the purpose of this research was to study faults and defects that occurred in 34.5 kV, 69 kV, 138 kV and 230 kV power transformers immersed in mineral oil for a period of 28 years at the electric power concessionaire CELG, which supplies over two million consumers distributed in 237 municipalities with a population of approximately four million in the state of Goiás, Brazil.

A defect is considered an anomaly in a device that can cause it to operate irregularly and/or below its nominal capacity. If not corrected in time, this defect can evolve, leading to failure of the equipment and its removal from service [2].

A fault is an anomaly in a piece of equipment that inevitably causes stoppage of its operation, forcing its removal from service [2].

As it is used here, the term “stoppage” indicates that the service of a piece of equipment was interrupted, i.e., it was removed from operation due to a defect or fault. The word “transformers” also refers to autotransformers.

II. POWER TRANSFORMERS

The present work was developed based on:

• the identification of the main parts of power transformers, which were analyzed and divided into blocks of components, as shown in Fig. 1; and

• The characterization and analysis of faults and defects detected in these devices, resulting from stoppages and/or interventions which they underwent.

Fig.1. Subdivision of a power transformer into blocks
III. STOPPAGES IN THE ELECTRIC POWER SYSTEM DUE TO TRANSFORMER DEFECTS AND FAULTS

A. Number of Stoppages of the Devices

In this study, 549 service stoppages were recorded from December 1979 to May 2007, involving 255 three-phase transformers or three-phase transformer banks, and several of these devices showed more than one stoppage.

Table I summarizes the number of devices, with their respective ranges of nominal output power and by nominal voltage.

Table I
Number of Devices by Range of Nominal Three-Phase Output Power and by Nominal Voltage

.

Of the transformer service stoppages in the period considered in this work, a certain number were due to faults and other defects, as indicated in Table II, reaching a total of 549 stoppages in this period of 28 years.

Table II
Number of Transformer Stoppages

.

It should be noted that this study took into account the devices that were removed definitively from operation as well as those that were purchased over the 28-year period of this study. It is estimated that 10% of the devices under study are part of the total number of transformers that belong to the system’s technical reserve over these years.

B. Number of Transformer Stoppages versus Damaged Components

Fig. 2 shows the percentage of transformer stoppages versus damaged components in the period of 1979 to 2007, without considering stoppages caused by the protection system and by human error. In this study, it was found that the components most affected were windings (34%), bushings (14%), onload tap changers, OLTC, (10%), and de-energized tap changers, DTC (10%). The item “unidentified component” (11%) refers to components which lack reliable records for several reasons.

The insulation system of the transformers in question is composed of mineral oil and solid insulation (cellulose, varnish or polyester), although most of it consists of oil-paper. It was found that the stoppages due solely to problems in the insulation oil accounted for only 4% of the number of stoppages during the 28 years analyzed here. The degradation of a transformer’s insulation system is usually the main parameter that causes electrical faults in these devices.

Fig.2. Number of transformer stoppages versus components

The aging of oil-paper insulation in a transformer depends on aging of both the paper and the oil. The assessment of the remaining life of a transformer is the desired result of diagnostic procedures. A popular belief is that the life of the insulation paper determines the transformer’s service life [3]. Thus, when factors of transformer insulation degradation such as water, oxygen, the products of decomposition in the oil and temperature are monitored and controlled continuously, there is decrease in the degradation of the insulation system, which means less risk of electrical faults [4]. CELG carries out systematic physicochemical testing and analyses of dissolved gases to control and monitor the insulating oil of its transformers, which is the reason for the low percentage of problems involving insulating oil in its devices (4%).

C. Transformer Failure Rates Over Time

As stated above, service stoppages can be caused by both defects and faults. The difference between them is that interventions to correct equipment defects can be programmed, unlike faults, which are generally emergencies in the electrical sector. It is therefore essential to know the individual transformer failure rates.

Fig. 3 shows the transformer failure rates in the CELG system per year and class of voltage, without considering the failures resulting from the protection system and from human error. In view of these results, and as can be seen in Figure 3, although failure rates of up to 9% were recorded (1992, 138 kV), the overall rates for the entire 28-year period are quite acceptable. These rates are listed in Table 3, and were calculated using (1).

.

where:
Tf : failure rate in the period under consideration [%]
Nf : number of failures in the period under consideration
Ne,i : number of devices existing in each year i considered
t : number of years of the period considered

Fig.3. Transformer failure rates over time

Analyzed quantitatively, the slightly higher rates of the 138 kV and 230 kV transformers are justified by the smaller number of devices of these classes of voltage.

Table III lists the failure rates of 34.5 kV, 69 kV, 138 kV and 230 kV transformers that occurred in the period under study, without considering the reserve equipment (estimated at 10% of the total number of power transformers).

Table III
Transformer Failure Rates for the Period of 1979 to 2007

.

As can be seen, the transformers failure rates of CELG’s system are relatively low, which is explained by the use of predictive techniques at this concessionaire. The company’s maintenance engineering sector, which strives to ensure a continuous supply of electric power by reducing the failure rate, has sought new predictive techniques, with emphasis on the detection of partial discharges in transformers by the acoustic method.

IV. PREDICTIVE TECHNIQUES

The well-known dissolved gas analysis (DGA) technique in insulating oil is sensitive to some types of incipient faults (defects). To quantify the efficiency of this technique in detecting such defects in CELG’s equipment, a comparison was made of the total number of transformer stoppages that could have been detected by the DGA predictive technique and the stoppages effectively detected by this technique. This comparison revealed that the technique provided an efficiency of approximately 75%. However, sampling of transformer oil for DGA testing is done periodically, according to the chromatography software program CELG uses and to the specificity of each device. Thus, between one sampling and the next, the device may undergo impacts from atmospheric discharges, external short circuits, and adverse operating conditions, which may trigger or accelerate incipient faults and cause the device to fail before the next sampling, masking the efficiency of the chromatography system. It is therefore understood that the efficiency of the DGA technique, per se, is higher than 75%. In addition to DGA, another predictive technique that could be used to increase the monitoring efficiency of the state of transformer insulation is the detection of partial discharges (PDs). The DGA method has only low sensitivity for detecting partial discharges [5]. This may sometimes lead to inaccuracy in analytical methods, which may lead to errors by the person analyzing test results. Furthermore, the DGA technique does not allow for the identification of the site of an incipient fault, making it difficult to locate it, especially if its intensity is low. Particularly interesting is the use of a noninvasive method such as the acoustic PD detection method, which allows for monitoring of the evolution of PDs even while the device is in operation.

Throughout its operation, a power transformer has to withstand numerous stresses that generally result in the degradation of the oil-paper insulation system by decomposition of the paper and/or oxidation of the oil.

Degradation reduces the quality of this insulation. Partial discharges can lead to winding breakdowns, and may cause accelerated aging. PDs must be inferred in order to build an early warning system. In this context, PDs serve as an important measuring parameter for on-line monitoring [6].

To illustrate the above, the photograph in Fig. 4 depicts the failure of a 20 MVA power transformer with a nominal voltage of 69 kV/34.5 kV, showing damage sustained by a large extent of the winding.

Fig.4. Damaged winding

Systematic equipment monitoring by the DGA technique showed a slight increase in gases, however without providing a warning about the need to remove this device from service, ultimately leading to its damage by short-circuiting between the spirals.

As can be seen in Fig. 5, the short circuit caused dislocation of the winding due to an electrodynamic overload.

Fig.5. Dislocated winding

This fault could have been avoided by PD detection, preventing the defect from developing into a short circuit between spirals and, hence, failure of equipment. This indicates the need for integrating predictive maintenance techniques in order to improve diagnostic quality and ascertain the state of transformer insulation systems.

This paper therefore presents a proposal for improving predictive techniques through the implementation of a set of techniques, highlighting the combination of DGA with the detection of partial discharges by the acoustic emission method [7], which allows PD activity to be pinpointed in the equipment without requiring its shutdown.

V. CONCLUSIONS

Although the failures rates and the number of stoppages that occurred during the period under study were relatively low, it is important to implement other predictive techniques that are sensitive to incipient faults in power transformers – especially in terms of problems involving windings, bushings and tap changers, which, taken together, account for 68% of the events in components of these devices – in order to further improve the performance quality indicators reported here. Among these techniques, this paper highlights the measurement of partial discharges by the acoustic emission method, which could be allied to the DGA method, a technique well-known in the energy sector, thereby increasing the maintenance efficiency and quality of electric power supply.

ACKNOWLEDGMENTS

This work was carried out in collaboration with the Maintenance Engineering Division of CELG Distribuição, CELG D, and the Federal University of Goiás School of Electrical and Computer Engineering (EEEC/UFG) through a partnership in an R&D Project – ANEEL.

REFERENCES

[1] M. WANG; A.J. VANDERMAR; K.D. SRIVASTAVA, “Review of Condition Assessment of Power Transformers in Service”, Proceedings of 2002 IEEE Electrical Insulation Magazine, Canada, November/December, v.18, n.6, pp.12-25, 2002.
[2] J. LAPWORTH, “Transformers reliability surveys”, Journal Electra, Cigré, n.227, August, pp.10-14, 2006.
[3] I. Höhlein and A. J. Kachler, “Aging of cellulose at transformer service temperatures. Part 2. Influence of moisture and temperature on degree of polymerization and formation of furanic compounds in free-breathing systems”, IEEE Electrical Insulation Magazine, vol.21, Sept.-Oct., pp. 20-24, 2005
[4] A.P. MARQUES, “Eficiência energética e vida útil de transformadores de distribuição imersos em óleo mineral isolante” (Energy efficiency and service life of distribution transformers immersed in insulating mineral oil), Master’s Dissertation – School of Electrical and Computer Engineering, Federal University of Goiás, Goiânia, 2004.
[5] Associação Brasileira de Normas Técnicas (Brazilian Technical Standards Association), Técnicas de ensaios elétricos de alta tensão – medição de descargas parciais, NBR-6940 (High-voltage electrical testing techniques – measurement of partial discharges, NBR-6940), Brazil, 1981.
[6] C. Yonghong; et al., “Study of On-line Monitoring Method of Partial Discharge for Power Transformers Based on RFCT and Microstrip Antenna”, Proceedings of the 2005 Electrical Insulation Conference, Indianapolis, USA, October, pp.103-107, 2005.
[7] Institute of Electrical and Electronic Engineers – IEEE Std., COLE, P.T., “Location of Partial Discharges and Diagnostics of Power Transformers using Acoustic Methods”, Proceedings of 1997 IEEE Diagnostic Methods for Power Transformers Conference”, London, 1997.


Source URL: https://studylib.net/doc/18633368/faults-and-defects-in-power-transformers-%E2%80%93-a-case-study