Published by Marek GAŁA, Andrzej JĄDERKO,
Czestochowa University of Technology, Faculty of Electrical Engineering
Abstract. The paper offers a characteristic of a photovoltaic (PV) system with the function UPS, equipped with energy storage AQUION ENERGY Battery 25 kWh and a system for monitoring and management of energy flow. Results and their analysis is presented for energy quality measurements carried out at a point of connecting the PV system to the power grid, collected over the period of one week.
Streszczenie. W artykule przedstawiono charakterystykę systemu fotowoltaicznego z funkcją UPS, wyposażonego w magazyn energii AQUION ENERGY Battery 25 kWh oraz system monitorowania i zarządzania przepływem energii. Przedstawiono wybrane wyniki oraz analizę pomiarów jakości energii elektrycznej przeprowadzonych w węźle przyłączenia systemu PV do sieci elektroenergetycznej w reprezentatywnym, tygodniowym okresie badania (Ocena wpływu systemu fotowoltaicznego na jakość energii w sieci dystrybucyjnej).
Keywords: photovoltaic systems; power quality; energy storage
Słowa kluczowe: systemy fotowoltaiczne, jakość energii elektrycznej, magazynowanie energii
Introduction
Price of electricity constantly raises and at the same time the technology of manufacturing efficient photovoltaic panels is becoming increasingly advanced. There are many PV systems available on the market, many of which can also be used by energy consumers, who intend to supply excess of energy to the distribution grid, which is now free of charge and does not require any special permission – all that has to be done is to register a connection with the distribution company. Moreover, it is possible to obtain funds from special programs for financing investment in renewable energy sources. All this explains high demand for PV systems equipped with inverters, control and protection systems. As of the end of May 2018, it is estimated that the power of all PV systems in Poland is about 300 MW, but it can reach 1.2 GW by the end of 2020 [1].
PV systems utilizing solar energy are one of the renewable energy sources (RES) to which article 2 point 22 of Act [11] applies. Act [11] enumerates the following categories of RES: microgeneration plants of total power up to 40 kW, connected to the power grid of voltage lower than 110 kV or of combined thermal power up to 120 kW; small generation plants of power 40 kW – 200 kW, connected to the power grid of voltage lower than 110 kV or of combined thermal power 120 kW – 600 kW. In accordance with article 7a clause 1 of Energy Law Act [10] generation plants and all related devices have to meet technological and exploitation standards in order to be connected to the grid. The standards ensure safety of the power system, which has to be protected against potential damage caused by faulty operation of a generation plant, and they also ensure that the energy quality parameters at the connection point are met.
A fast increase in the number of microgeneration plants can cause significant problems in distribution networks, including deterioration of energy quality. To prevent this, particular distribution companies issue detailed instructions, e.g. [2] [3], complying with general standards and regulations [4, 5, 9] specifying conditions that have to be met by microgeneration plants and small generation plants connected to the grid.
If the amount of electrical energy generated by a prosumer exceeds own consumption, the excess energy can be introduced to the power grid and counted at the ratio of 1 to 0.7 in the case of a plant over 10 kW or at the ratio 1 to 0.8 in the case of a plant below 10 kW – as stipulated in article 4, clause 1 of Act [11]. The prosumer can also include energy storage in their system, thereby optimizing the consumption of self-generated energy.
In what follows, this paper presents characteristics of a PV system with an energy storage. It also offers selected results of measurements of the quality of energy generated by this plant, supplying energy to devices connected into separate circuits.
Characteristics of the PV system
The PV system consists of 76 solar panels, each of power 250 Wp. They are connected to a three-phase photovoltaic inverter Goodwe type GW 17K-DT of nominal power 17.0 kW, capable of working with 20% overload and having efficiency up to 98.2%. The inverter is equipped with two MPPT modules and a switch disconnector. The PV system is also equipped with protection elements, including a protection device Ziehl controlling voltage and frequency, type UFR1001E.
The output circuits of the PV system are connected to three single-phase inverters Victron Energy, type MultiPlus 48/5000/70, working in a three-phase layout and equipped with microprocessor battery charge controllers, with adaptive charging and with continuous energy supply to AC receivers (function UPS). The first inverter mounted at phase L1 plays the role of Master, and the other two work as Followers. The inverters MultiPlus 48/5000/70 are presented in figure 1. The inverters MultiPlus collaborate with energy storage AQUION ENERGY Battery 25 kWh, type M110-LS83. The whole system is controlled by panel Color Control GX by Victron Energy, having access to the Internet and providing support for Victron Remote Management. Registered users and administrators have remote access to the system from PCs and mobile devices. The panel controls the charging of the energy storage, monitors current energy consumption, power obtained from the PV system as well as power supplied to and consumed from the grid. The PV system together with panel Color Control GX ensure that the energy storage is always fully charged, that the receiving circuit is supplied without interruptions and that excess energy from the PV system is directed to the energy storage to be used for own consumption. The energy storage is additionally monitored by Aquion Energy BMS-200 Battery Monitoring System.
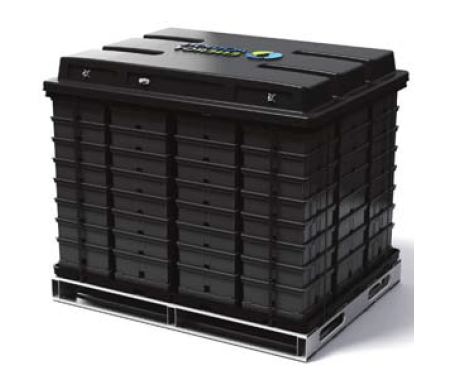
Figure 2 presents AQUION ENERGY Battery 25 kWh type M110-LS83, and figure 3 provides an example of a screen view obtained from Victron Remote Management, with information on the flow of energy generated by the PV system.


Measurements of the quality of energy generated by the PV system
Apart from detailed technological specifications and criteria concerning connecting microgeneration plants to the power grid, issued by distribution companies (e.g. [3]), of vital importance is the assessment of the influence the plant exerts on energy quality parameters at the node where the plant is connected to the grid (Point of Common Coupling – PCC). It is therefore required that devices being component parts of PV systems are certified for compliance with current standards and directives issued by research institutions.
Compliance of a PV system with requirements and standards concerning energy quality at PCC as described in [3, 4, 5, 9] can be verified on the basis of measurements carried out as specified in e.g. [6, 7, 8, 9]. Such measurements include voltage deviation and variation, voltage imbalance, harmonics and interharmonics, flicker, commutation noise and signal transmission noise.
Below are presented selected results of measurements of energy quality parameters, concerning energy generated by a PV system with energy storage, supplying power to separate circuits in an object. The measurements were carried out at PCC where the PV system with energy storage is connected to the internal grid. The measurements utilized an energy quality analyzer PQ-Box 200, satisfying the standard [8] for class A. The testing took place in summer, during peaks of power generated by the system.
The results presented in this paper include power parameters and energy quality parameters, with the measurements performed during the period of one week. The data aggregation time was tA = 600 s.
Figure 4 presents the rms values of current. The maximal rms value of current was Imax = 17.2 A, and the maximal rms value of current for the aggregation time tA = 0.2 s was Imax 0.2s = 21.4 A. Load asymmetry was also attested, occurring due to the operation of many singlephase appliances in the receiving circuits of the object.
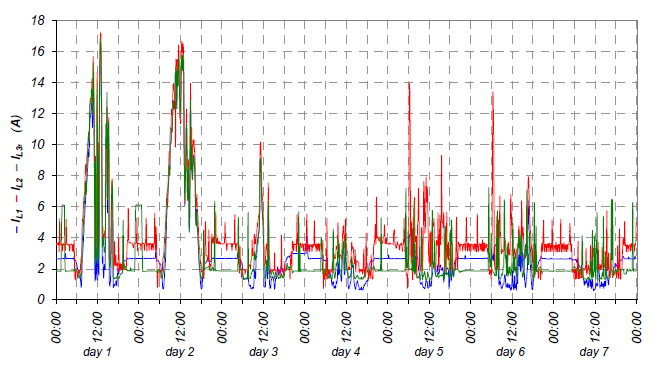
Fig. 5 presents the curve of active powers PL1, PL2, PL3 registered during the week period of observation.
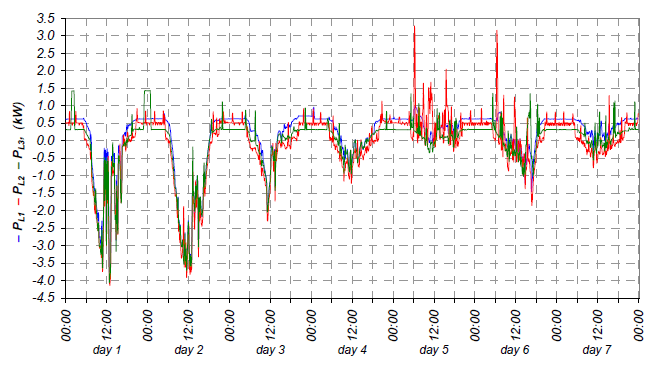
Resultant active powers transmitted to the grid were obtained under real conditions, taking into account the charging of the energy storage and the operation of receivers in the circuits supplied by the PV system. They were PL1 min = -3.74 kW, PL2 min = -4.14 kW, PL3 min = -4.04 kW (Fig. 5). The three-phase power was Pmin = -11.67 kW. The maximum power consumed from the power grid was Pmax = 4.43 kW.
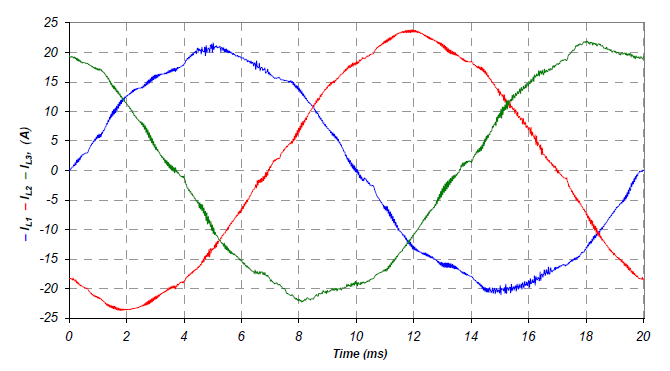
No significant voltage deformation, nor correlation between such deformation and the level of power generation by the PV system was observed at PCC under scrutiny. The values of the THD factors for voltage were in the interval THD U ∈ 〈1.87, 3.11〉% and satisfied the relevant standards [4, 9]. Figure 6 presents the values of instantaneous current registered at the power Pmin = -11.67 kW.
The assessment of higher current harmonics content was performed in accordance with the standard [5] and requirements specified in [3]. To this end, the value of short-circuit factor was determined for the PCC
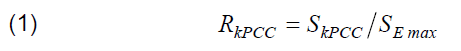
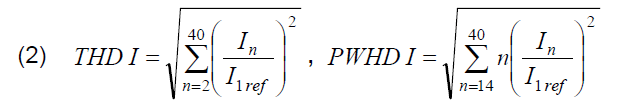
on the basis of short-circuit power SkPCC at the PCC and apparent power SEmax that can be achieved by the plant, obtaining RkPCC = 33. Besides, the value of the reference current Iref, i.e. the rated continuous current of the PV system, was obtained on the basis of measurements. Then the rms value of the fundamental of the reference current I1 ref was determined. Taking into account the measured rms values of higher current harmonics, the factors THD I and PWHD I were calculated:
The relative values of the higher current harmonics of the order n = 2,…,40 were found and referred to the fundamental I1 ref. No significant change in the degree of current deformation was found to be dependent on the variation of power generated by the PV system – figure. 7. The steep increases in THD I up to 12.89% visible in figure 7 were caused by current received by nonlinear sources of light, switched on during nighttime and supplied from the phase L2 circuit. Figure 8 presents relative values of current harmonics determined at Pmin. As these values indicate, the phase currents are deformed only to a slight extent. The harmonics of the order n = 3, 5, 7, 9 are dominant.
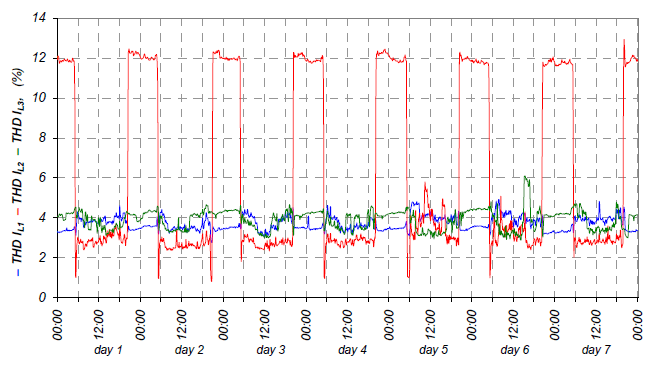
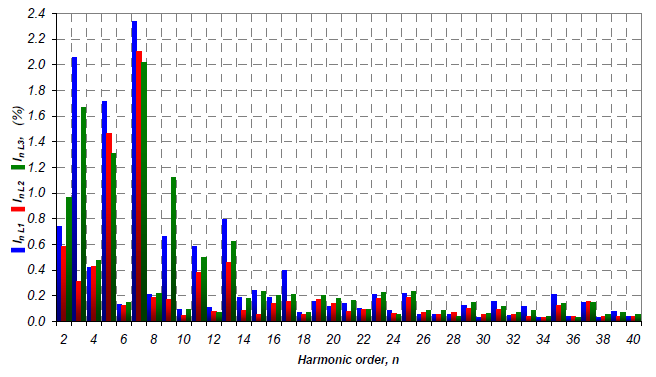
Table 1 presents the maximal values of current harmonics with reference to I1 ref. Table 2 presents maximal values of the factors THD I and PWHD I.
Table 1. Relative values of the main current harmonics compared to the limits specified in [6]
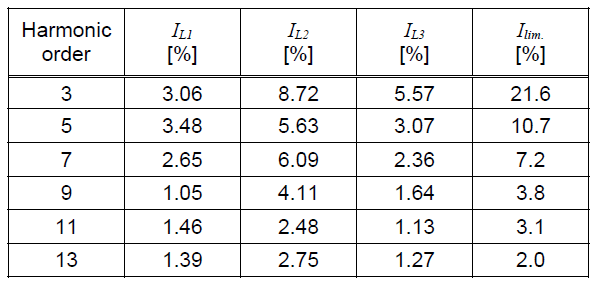
Table 2. THD and PWHD factors of current compared to the limits specified in [6]
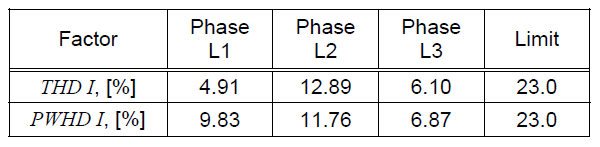
It can be observed that the values of factors THD I and PWHD I do not exceed the limit – cf. Table 2. On the other hand, the content of the 9. and 13. harmonics is relatively slightly exceeded in phase L2, due to nonlinear light sources supplied from the output circuits of the PV system – cf. Table 1.
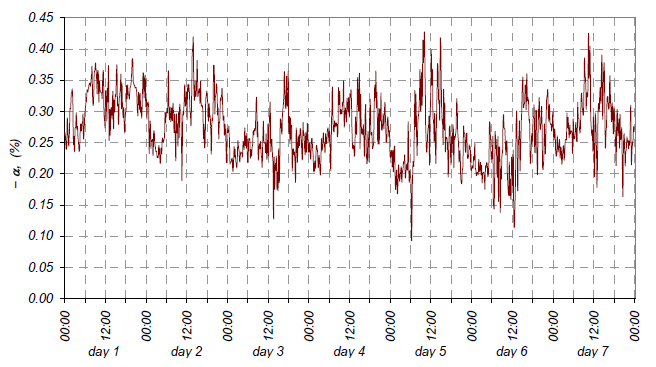
Figure 9 presents the voltage coefficient curve. The values of the voltage unbalance factor were within the interval 0.09% to 0.43%, i.e. much below the limit of 2%. The value of rms voltage likewise varies within the limits.
Figures 10 and 11 present the variation of the indices Pst and Plt respectively. The occurrence of limit values of the indices Pst = 1.0 and Plt = 0.65 was attested only once and only in one of the phases during the weekly period of testing.


Conclusions
PV system equipped with energy storage and an advanced system for monitoring and managing energy flow offers a way to utilize energy for one’s own consumption, at the same time ensuring continuous supply. As this study indicates, the system under scrutiny does not cause deterioration of energy quality beyond the admissible limit. Thus, despite a single occurrence of limit values of indices Pst and Plt defined in [3], electric energy in the node investigated in this study met all quality requirements specified in [4, 9].
REFERENCES
[1] Photovoltaic market in Poland. Institute of Renewable Energy (Rynek fotowoltaiki w Polsce. Instytut Energetyki Odnawialnej), Warsaw, June 2018.
[2] Instructions for Distribution Network Traffic and Exploitation applicable since 01.01.2014, TAURON Dystrybucja S.A. (Instrukcja Ruchu i Eksploatacji Sieci Dystrybucyjnej TAURON Dystrybucja S.A. obowiązująca od dnia 01.01.2014 r.).
[3] Connection criteria and technical requirements for microgeneration plants and small-scale generation plants connected to the LV distribution network (Kryteria przyłączania oraz wymagania techniczne dla mikroinstalacji i małych instalacji przyłączanych do sieci dystrybucyjnej niskiego napięcia) TAURON Dystrybucja S.A., Krakow, July 18, 2016.
[4] EN 50160: Voltage characteristics of electricity supplied by public distribution system.
[5] IEC 61000-3-12:2011 Electromagnetic compatibility (EMC) – Part 3-12: Limits – Limits for harmonic currents produced by equipment connected to public low-voltage systems with input current >16 A and ≤ 75 A per phase.
[6] IEC 61000-4-7:2002+A1:2008 Electromagnetic compatibility (EMC) – Part 4-7: Testing and measurement techniques – General guide on harmonics and interharmonics measurements and instrumentation, for power supply systems and equipment connected thereto.
[7] IEC 61000-4-15:2010 Electromagnetic compatibility (EMC) – Part 4-15: Testing and measurement techniques – Flickermeter – Functional and design specifications.
[8] IEC 61000-4-30:2015 Electromagnetic compatibility (EMC) – Part 4-30: Testing and measurement techniques – Power quality measurement methods.
[9] The Ministry of Economy ordinance on the detailed conditions of the power system operation, Journal of Laws of 2007, no, 93, item 623 with later amendments (Rozporządzenie Ministra Gospodarki z dnia 4 maja 2007 r. w sprawie szczegółowych warunków funkcjonowania systemu elektroenergetycznego, Dz. U. z 2007 r., nr 93, poz. 623 z późn. zm.).
[10] Act on Power Law of 10 April 1997, Journal of Laws of 1997 no 54, item 348, with later amendments (Ustawa z dnia 10 kwietnia 1997 r. Prawo energetyczne, Dz. U. z 1997 r., nr 54, poz. 348 z późn. zm.).
[11] Act on Renewable Energy Sources of 20 February 2015, Journal of Laws of 2015, item 478 (Ustawa z dnia 20 lutego 2015 r. o odnawialnych źródłach energii (Dz. U. z 2015 r., poz. 478).
Authors: dr inż. Marek Gała, Politechnika Częstochowska, Wydział Elektryczny, 42-200 Częstochowa, Al. Armii Krajowej 17, e-mail: m.gala@el.pcz.czest.pl
dr inż. Andrzej Jąderko, Politechnika Częstochowska, Wydział Elektryczny, Al. Armii Krajowej 17, 42-200 Częstochowa, e-mail: aj@el.pcz.czest.pl
Source & Publisher Item Identifier: PRZEGLĄD ELEKTROTECHNICZNY, ISSN 0033-2097, R. 94 NR 12/2018. doi:10.15199/48.2018.12.35
