Published by Simon Mugo, EE Power – Technical Articles: Introduction to Energy Meter Calibration, November 04, 2022.
This article will guide engineers and technicians through procedures, precautions, and the importance of carrying out electrical energy meter calibration.
All electrical and electronic measuring equipment is prone to errors caused by external or internal factors. The errors can be removed through a process known as equipment calibration.
The energy meter undergoes calibration, too. This is the process used to determine and eliminate errors during energy measurement. Some of the factors that inject errors in an energy meter are current errors caused by phase angle, voltage transformers, and errors caused by crystal oscillators.
Successful Energy Meter Calibration
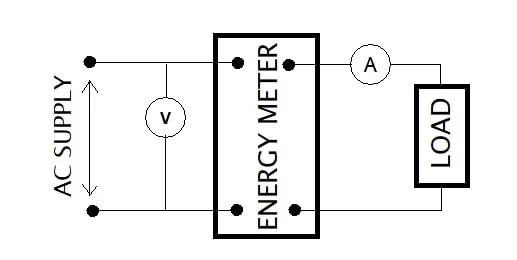
An electric energy meter is designed to have specified characteristics and parameter constants that deliver necessary information about disc revolution counts and energy measured in joules. These characteristics and parameter constants are specified by the energy meter manufacturers. Below is the setup that makes meter calibration successful.
Figure 1. Calibration Circuit Connection for Energy Meter. Image used courtesy of Simon Mugo
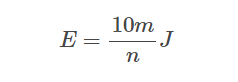
Before energy meter calibration takes place, make sure to complete adjustments of load, creep, lag, and so on. Generally, the energy meter number of revolutions is very high, and its measurement cannot be achieved in electric laboratories. Therefore, we have to make several assumptions for us to achieve our goal. The number of revolutions (m) in the energy meter disc is 10 for n joules of electric energy in the characteristic constant.
From the assumption, we can carry out the calculation of the energy (E), which is computed from m using the equation;
.
If the energy calibrated for the 10 revolutions is equal to the energy that is consumed by the load for that amount of time and revolution, the energy meter has no error. The energy that is consumed by the load is given by denotation ET. This energy is also known as true energy hence the denotation.
The loads applied to the energy meter are placed under variation and the time that is taken for 10 revolutions is estimated using a stopwatch and recorded. Parameters such as current and voltages are observed using necessary equipment and tabulated as recorded in the table below.
Table 1. Recording Calibration Measures
.
The reading that is fed in the table above is observed from the test that is carried out.
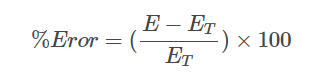
For the specific revolution, the meter energy E remains constant while the energy that is consumed by the load ET is varied and calculated theoretically. Therefore, when the meter is under various electric loads, we can compute the percentage error by involving the formula listed below:
.
The Calibration Curve
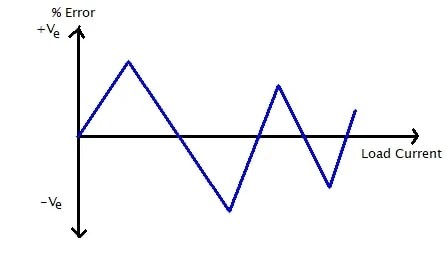
The energy meter calibration can be obtained by the use of a graph. This is made possible by plotting a graph of percentage errors against the current values, I. The graphical representation of the energy meter calibration is known as the calibration error. Initially, the load current is valued at zero, and therefore, there is no percentage error because the values of the energies E and ET are zero. The figure below is an example of the energy meter calibration curve.
Figure 2. The Calibration Curve Graph. Image used courtesy of Simon Mugo
The error calculated in percentage can be negative or positive. The load current error limits can be decided by just having a close study and observation of the drawn calibration curve. If the limit happens to be outside the desired option, then you have to adjust the error range to the desired range by application of different adjustments, for example, friction, lag, and creep.
Energy Meter Calibration Procedure
Below is a step-by-step procedure used to calibrate the energy meters.
• Connection your circuit as per the circuit drawn in figure 1 above. • Check the meter-rated voltage and supply it to the meter that is at no load initially. • Confirm that in your connection, the current coil has been connected in series with the electric load, and the pressure coil is at shunt with the input voltage from the supply. • Record the current, voltage, and time for the particular disc revolution. • Using the percentage error formula listed above, compute the theoretical error in percentage
Energy Meter Calibration Precautions
While undertaking Energy meter calibrations, ensure the following precautions are taken:
• Never make a loose connection to the meter under calibration. • Between the observer and the calibration circuit terminal should not exist any physical mode of contact. • Before taking any reading, ensure the energy meter is connected to the electric load for about 15 minutes. This will help eliminate temperature and friction errors. • Make sure to note the readings carefully. • To achieve a precise or accurate error, more readings should be taken to help calculate the mean or average error.
Advantages and Takeaways of Energy Meter Calibration
Energy meter calibration offers several important advantages:
• Acts as a guard against potential trouble to the system or instrument while offering great data traceability and reporting. • Gives the equipment a chance to undergo maintenance to eradicate several other problems. • Allows energy meters to report reliable data output. • Reduces the cost of energy and helps improve profitability.
The article has highlighted the following important information that a calibration engineer and technician should know:
• Calibration is the process of eradicating errors in any electronic measuring equipment or tool. • An electric energy meter undergo calibration to make sure that errors are eradicated and the tool function as per the manufacturer’s specification. • Calculation of the percentage error formula has been highlighted, and the calibration curve is drawn. • The calibration procedures, precautions, and importance have been highlighted.
Author: Simon Munyua Mugo is a Mechatronic Technical Tutor and Head of Research and Innovation at Mumias West Technical and Vocational College, Kenya. He has a Bachelor of Science in Mechatronic Engineering from Dedan Kimathi University of Technology, Kenya.
Published by Payal jangilwar1, Prof. Balram Yadav2, 1M-tech scholar, Department of Electrical and Electronics Engineering, Scope College of Engineering, Bhopal, 2HOD, Department of Electrical and Electronics Engineering, Scope College of Engineering, Bhopal.
Abstract – Electric Vehicles plays an important role in energy storage management in microgrid. This mechanism is managed by grid to vehicle technology in storing energy and vehicle to grid technology in supplying the energy back to grid. We need a proper architecture to make this concept reality. This paper represents a architecture to establish a V2G and G2V concept employing Dc fast charging which is also called as level 3 charging. The model is prepared with microgrid test system with DC fast charging architecture. The simulation results shows that electric vehicle batteries give proper regulation of power in microgrid by using V2G and G2V concept.
Keywords: Vehicle to grid, grid tie inverters, automotive and power generation units, battery, electric vehicle.
1. INTRODUCTION
Electric Vehicles are increasing their demand nowadays. It can draw power from on-board source of electricity. Electric vehicles are better in working than gasoline-powered vehicles as they reduces pollution to much extent, also electric vehicles are mechanically simpler than gasoline-powered vehicles. Batteries of electric vehicles can used as a potential energy storage devices in microgrid. It is proven that electric vehicles are feasible solution for energy management system of microgrid. It employs V2G and G2V technology using level 3 charging architecture, for charging electric vehicles. Previously level 1 and level 2 AC charging scheme was used to charge electric vehicles. These scheme leads to distribution losses such as voltage fluctuations, power losses and transformer overloads this can harms the distribution system. Therefore to reduce these losses DC fast charging scheme(level 3) is employed and to allow bi-directional energy flow V2G and G2V technology is used. This paper presents a dc quick charging station with V2G technology.
Simulation result shows that energy storage management of microgrid effectively working with this technology. This paper describes DC fast charging configuration, microgrid test system and control system.
2. DC CHARGING SYSTEM DC
fast charging scheme is more better than level 1 and level 2 AC charging system. It reduces charging time to 20-30 minutes about 80% charging has to be done within this time. It uses 200-600V input voltage and about 30 amps input current to charge electric vehicles. DC fast charger bypasses the onboard charging device by supplying power directly to battery of electric vehicles.
2.1 CALCULATION OF PARAMETERS OF DC FAST CHARGING UNIT
DC charging unit needed DC connection band its control is also necessary. To reduce the fluctuations of DC bars due to large no if electric vehicles connected to it, the value of capacitor should be high. The maximum values of current and voltage are the reference values because electric vehicle cannot exceed maximum power value. Maximum value of power can be given by
PEA =Imax* Vmax
It is important to make visible power calculations, to deal with the fact that load coefficient is to be formed in power system, the power to be taken from the no of slots to which the EV to be charged and connected. The main function of capacitor is to maintain the fluctuations under certain level. “ when switching status is low, switching block at the bottom output terminal that the DC connection is shorted at the negative and when switching status is high switching block works effectively and DC connection is shorted to positive end”.
2.2 DC FAST CHARGING STATION CONFIGURATION
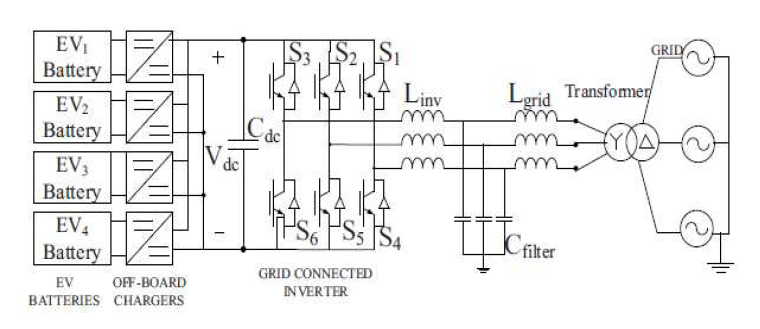
DC fast charging station configuration includes EV batteries, on-board charger, grid-connected inverter, dc bus, LCL filter and step up transformer. It implements V2G-G2V framework in microgrid. There are two important components of this charging station are
a) Battery charger b) Grid-connected inverter and LCL filter
Fig 1. EV charging system for DC fast charging station
Fig 2. Battery charger configuration
a) Battery charger configuration
DC chargers for Dc fast charging system are situated off-board nd embedded in a EVSE. The important component of an off-board charger employing V2G functionality is bidirectional dc-dc converter. Bidirectional DC-DC converter are judged by current and voltage supply from one side. “The current in double sided transducers must be travelled in both sides. As we know there is a no power key this way, the one-way key MOSFET or IGBT are placed parallel in battery charger circuit. Battery chargers are acts as power converters. These charges can be used in three different ways buck, boost and buck-boost converters. Two IGBT switch used for two different values
1) Buck mode operation: It is a charging mode, where power flows from grid to vehicle. In this mode when upper switch is operating ; Ie having low value converter act as a buck converter and syeps down the ‘input voltage(Vdc) to battery charging voltage( V). When switch is off, through inductor and diode of lower switch current completes its return path.
Vbatt = Vdc * D
D is the duty ratio of upper switch
2) Boost mode operation: the converter is act as boost converter when lower switch is cooperating. It steps up the battery voltage (Vbatt) to DC bus voltage (Vdc). When the switch is in on state through an inductor, current continues to flow and completes its path through anti parallel diode of upper switch and the capacitor. It is a discharge mode. In this case power flows from vehicle to grid. Output voltage in boost mode is given by
Vdc = Vbatt/ 1-D’
Where D’ is duty ratio of lower switch.
b) Grid connected inverter and LCL filter
The three phase grid connected inverter is used to convert AC power into DC power and also permits the reverse flow of current through anti parallel diodes of the switches. Double-sided power flow has to be flow using six-pulse inverter. More the number of pulses, less the current fluctuations. There are two types of filter active filter and passive filter. In this system we are using passive filter as they interface with system and reduce harmonics. Inductor filters are first order filter and required large of inductor to reduce harmonics but this leads to voltage drop. LC filter is second order filter. By using this filter inrush current and output capacitor problems arrives. Therefore LCL filter is used in this system which reduces harmonics and obtained pure sinusoidal voltage and current. The main advantage of using this filter it has two inductor therefore system remains in steady state.
3.CONTROL SYSTEM
a) Off-board charger control
For charging/ discharging control of battery charger, current control strategy using PI controllers is used. Reference battery current get compared with zero, to determine polarity of current wave. This is to be done to decide whether it is charging mode or discharging mode. When any one mode is get selected then reference current is compared with measurement current to find error. This error is passed through PI controller, this generates pulse for Sbuck/ Sboost, It is noted that “ Sbuck will turned off in charging mode and Sboost will turned off in discharging mode”.
b) Inverter control
In synchronism with reference frame a cascade control is provided for inverter controller. Controller structure is made up of two outer voltage control loop and two inner current control loops. D-axis outer loop has control over dc bus voltage and inner loop has control on active AC current. Also, q-axis outer loop controls AC voltage and q-axis inner loop regulates reactive current.
4. MICROGRID TEST SYSTEM CONFIGURATION
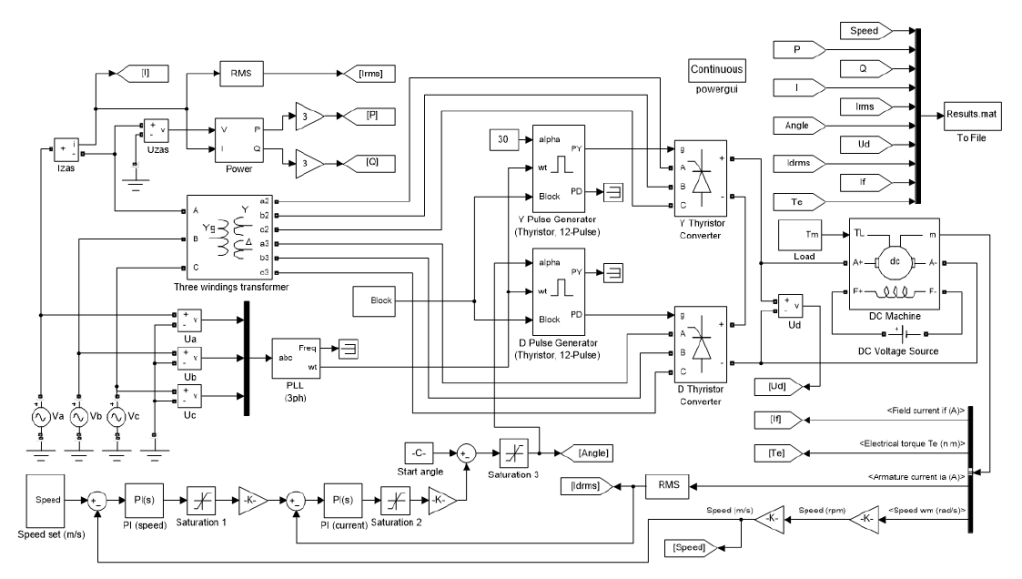
In this test system A 100KW wind turbine and 50 KW solar PV array act as generation sources. EV battery storage system included 4EV batteries which are connected to 1.5 KV dc bus of charging station. A boost converter has maximum power point tracking controller, to this boost converter a solar PV is connected. Distribution feeder of 25KV and equivalent transmission system are included in utility grid. At common coupling point(PCC) a wind turbine is connected to microgrid, this turbine is driven by doubly-fed induction generator. Function of transformer connected is to step up the voltages and connect the respective ac systems to utility grid.
5. SIMULATION RESULTS
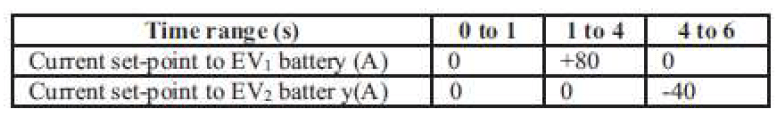
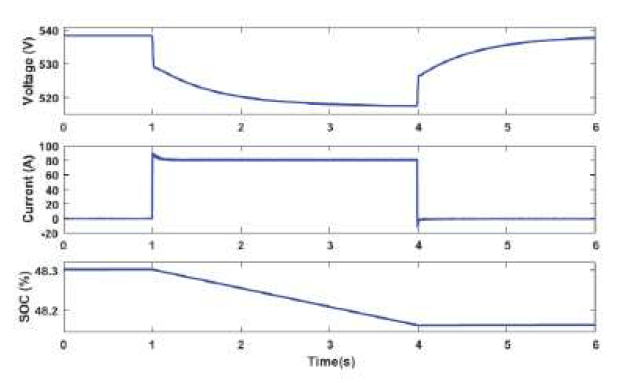
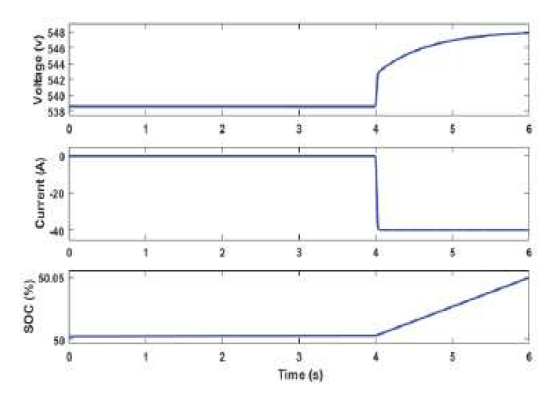
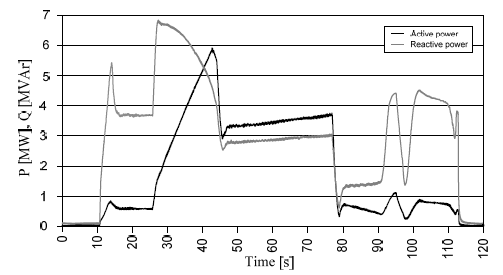
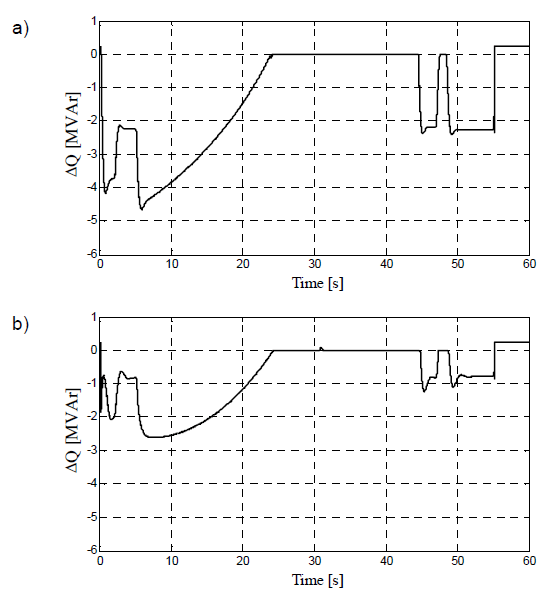
The designing and modulation of DC fast charging system for electric vehicle in microgrid is successfully and the results shows that it works precisely. Wind turbine is work preferably at rated speed giving maximum power up to 100KW. Solar photovoltaic system is checked under standard conditions it can provides maximum output power of 50KW. To work at unity power factor, the 480V AC bus is connected to 150KW resistance load. According to reference of CGI reactive current is set to zero. It is proven that “ the initial state of charge of electric vehicle is set to 50% and once the steady conditions are obtained V2G and G2V power transfer is carried out using batteries of EV1 and EV2”. Table 1 shows current set points for battery charging circuits of EV1 and EV2. Fig 3 and 4 shows battery parameters when EV! Is operating in V2G and EV2 is operating in G2V modes.
Table 1. Current Set-points to EV Batteries
.
Fig 3. Voltage, current and SOC of EV1 during V2G operation
Fig 4. Voltage, current and SOC of EV2 during G2V operation
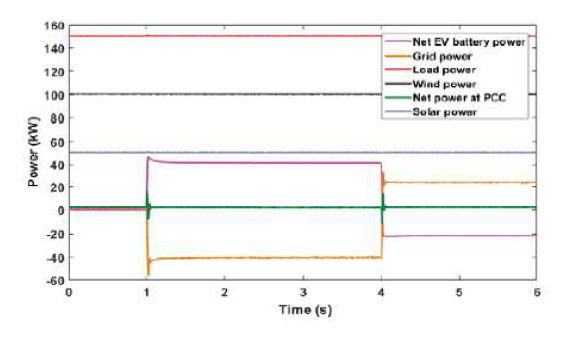
Active power profile of various components in the system is shown in fig 5. The power from grid changes to adapt power transfer by electric vehicles. “ the negative polarity of grid from 1s to 4 shows power transferred from vehicle to grid”. The change in polarity at 4s shows power is transferred by grid to charge the vehicle. This shows the V2G-G2V operation. Net power PCC is zero, this shows that power is balanced in the system.
Fig 5. Active power profile of various components in the system
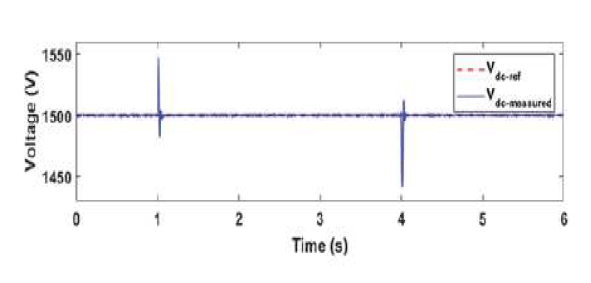
Fig 6. DC bus voltage regulation
Fig 6. shows the regulation of Dc bus voltage by outer voltage control loop of inverter at 1500V. Reference current tracking by inner control loop is shown in fig 7.
Fig 7. Reference current tracking tracking by inner current loop
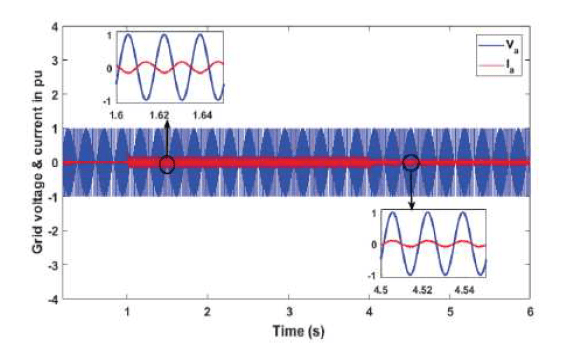
Fig 8. Grid voltage & current during V2G-G2V operation inverter
The harmonic distortion analysis is completed on grid injected current and the result is shown in fig 9. As said in IEEE std 1547 “ harmonic current distortion on power systems 69KV and below are limited to 5% THD. The THD of grid injected current is obtained as 2.31% and carried out by LCL filter”.
Fig 9. Harmonic spectrum an THD of grid injected current
6. CONCLUSION
Architecture of Dc fast charging in microgrid is presented in this paper. DC system with off-board chargers and inverter is designed to connect the EVs to microgrid. Control system is designed to allow bidirectional energy flow. Simulation results shows the smoot power flow between EVs ad microgrid. In this work active power regulation in microgrid has been considered and V2G system can be used for reactive power control & frequency regulation.
REFERENCES
[1] C. Shumei, L. Xiaofei, T. Dewen, Z. Qianfan, and S. Liwei, “The construction and simulation of V2G system in micro-grid,” in Proceedings of the International Conference on Electrical Machines and Systems, ICEMS 2011, 2011, pp. 1–4. [2] S. Han, S. Han, and K. Sezaki, “Development of an optimal vehicle-togrid aggregator for frequency regulation,” IEEE Trans. Smart Grid, vol. 1, no. 1, pp. 65–72, 2010. [3] M. C. Kisacikoglu, M. Kesler, and L. M. Tolbert, “Single-phase on-board bidirectional PEV charger for V2G reactive power operation,” IEEE Trans. Smart Grid, vol. 6, no. 2, pp. 767–775, 2015. [4] A. Arancibia and K. Strunz, “Modeling of an electric vehicle charging station for fast DC charging,” in Proceedings of the IEEE International Electric Vehicle Conference (IEVC), 2012, pp. 1–6. [5] K. M. Tan, V. K. Ramachandaramurthy, and J. Y. Yong, “Bidirectional battery charger for electric vehicle,” in 2014 IEEE Innovative Smart Grid Technologies – Asia, ISGT ASIA 2014, 2014, pp. 406–411 [6] joao c. Ferreira, Vitor monteriro, joao l. Alfonso, Alberto silva, “ smart electric Vehicle Design” conference paper IEEE, June 2011, 758-763, Germany. [7] Aykut Fatih GUVEN, Salih Burak AKBASAK, “DC fast charging station modeling and control of elecrtric vehicles”, Karadeniz Fen Bilimleri Dergisi the black sea journal of science, Dec 2021, 680-704, Yalova, Turkey. [8] clement-NYns K haesen E. and Driesen J,” the impact of charging plug-in-hybrid electric vehicleso a residential distribution grid”, tans power system 25(1), 2010, 371-388. [9] Seshasai bagdi, A. Apparao, Venkateshwara Rao K.M., “ Vehicle to grid technology employing Dc fast charging configuration in microgrid using Fuzzy controllers”, JUNi khyat , volume 11 ,Jan 2021, 752-760 Srikakulam, Vizianagaram ,India. [10] Femina Mohhamad Shaeel, OM P. Malik, “ Vehicle to grid technology in microgrid using Dc fast charging architecture” IEEE Canadian conference of electrical and computer engineering, 2019,1-4, Calgary, Canada.
Source & Publisher Item Identifier: International Research Journal of Engineering and Technology (IRJET) e-ISSN: 2395-0056 Volume: 09 Issue: 07 | July 2022 http://www.irjet.net p-ISSN: 2395-0072
Published by Sherkhon SULTONOV1 , Murodbek SAFARALIEV2 , Sergey KOKIN2 , Stepan DMITRIEV2 , Inga ZICMANE3 , Shokhin DZHURAEV1,4 Tajik Technical University, Tajikistan (1), Ural Federal University (2), Riga Technical University, Latvia (3), Branch of the National Research University ‘Moscow Power Engineering Institute’ in Dushanbe City (4) ORCID: 1. 0000-0003-2322-5272; 2. 0000-0003-3433-9742; 3. 0000-0001-7493-172X; 4. 0000-0001-8781-2383; 5. 0000-0002-3378- 0731; 6. 0000-0003-4092-2758.
Abstract. The paper describes the distinctive features of the isolated power system of Tajikistan, significant part of which is constituted by the hydropower plants; identifies the main problems of the electric power system of the Republic of Tajikistan in terms of power generation; describes specific features of HPP cascade management; proposes a method of determining the alternative fully drawn down level of the Norak HPP reservoir, taking into account the water level requirements in various water volume conditions from the point of view of power generation increase; estimates the economic efficiency of reducing the deficit of electricity in the power system with view to long-term optimization.
Streszczenie. W artykule opisano charakterystyczne cechy izolowanego systemu elektroenergetycznego Tadżykistanu, którego znaczną część stanowią elektrownie wodne; identyfikuje główne problemy systemu elektroenergetycznego Republiki Tadżykistanu w zakresie wytwarzania energii; opisuje specyficzne cechy zarządzania kaskadowego HPP; proponuje metodę określenia alternatywnego całkowicie obniżonego poziomu zbiornika Norak HPP z uwzględnieniem wymagań poziomu wody w różnych warunkach objętości wody z punktu widzenia przyrostu mocy; szacuje ekonomiczną efektywność redukcji deficytu energii elektrycznej w systemie elektroenergetycznym z myślą o długoterminowej optymalizacji. (Specyfika zarządzania elektrownią wodną w izolowanym systemie)
Keywords: hydropower resources, optimization, Vakhsh cascade, Norak HPP, power system of Tajikistan, power generation. Słowa kluczowe: zasoby hydroenergetyczne, optymalizacja, kaskada Vakhsh, Norak HPP, system energetyczny Tadżykistanu, energetyka.
Introduction
Optimal management of hydropower plants (HPPs) regimes is a complex task that should be solved individually for each power system, depending on its structure and nature. Each power system has its own specific characteristics and requires individual approach for solution of particular tasks. Most often, the target of HPP optimal management is the rational use of hydropower resources. The HPP operation regime depends on the river flow, which is probabilistic and varies widely depending on weather conditions and other factors. HPP regime management is even more complicated under severe water economic management restrictions. Currently, the adjustment range of the HPPs is limited by the water economic management requirements. In this regard, there is a need to analyze and change the methods and tasks of optimal use of HPP resources [1-3].
Long-term regime optimization includes finding effective HPP operation regimes for the entire control cycle. It is necessary to define the regime of use of water and energy resources of the water reservoirs, with establishment of refill and drawdown schedules for the water reservoirs. Planning of optimal long-term HPP regimes is necessary for the implementation of rational use of reservoir resources. Efficient use of water in HPP reservoirs can increase electricity generation by 5 % or more [4-6].
For many years, many classical algorithms, such as linear programming [7], heuristic programming [8], dynamic programming [9], network flow algorithms [10], etc., have been widely developed and applied to the aforementioned optimization task. Solving problems related to large-scale hydropower systems, usually used methods that can reduce or facilitate computational dimensions. Therefore, it is extremely important to develop other optimization algorithms in order to reduce dimensionality, increase computational efficiency, and improve the efficiency and practicality of optimization results.
Tajikistan’s electric power system (EPS), which consists mainly of HPPs, has some characteristic features that should be taken into account when applying optimization methods.
Description of the Research Object
Tajikistan is a country whose territory is 93 % covered with mountains. It has unique potential of renewable and environmentally friendly energy sources – the hydropower resources. Hydropower is the main energy source for the electric EPS of the Republic of Tajikistan. Tajikistan ranks the 8th in the world in terms of hydropower resource potential after China, Russia, the United States, Brazil, Zaire, India, and Canada. Its hydropower reserves are estimated at 527.06 billion kWh per annum. Technically available and economically feasible potential is 317 billion kWh per annum, just 5% of which have been used so far [11-13]. Hydropower potential is 58.55 thousand kWh per annum per person, making it second largest in the world. Tajikistan exceeds many countries in terms of Hydropower potential per square kilometer of the territory (3682.7 kWh per annum /km2 ). The main rivers of Tajikistan are Vakhsh, Panj, Kofarnihon, Zarafshon and Syr Darya Rivers, whose basins cover more than 75% of its territory. Combined, the rivers of Tajikistan account for 55.4% of the average annual surface runoff of the Aral Sea basin [14-16].
Tajikistan has virtually no oil and gas resources, their amount accounting for less then 1% of the total power resources. In Tajikistan, the electricity sector is managed by an Open Joint-Stock Holding Company (OJSHC) “Barqi Tojik”. This state-owned company controls power plants and networks, power generation, power transmission and distribution of electricity across the Republic, with the exception of Gorno-Badakhshan Autonomous Oblast (GBAO) [17-20].
The electricity system of Tajikistan consists mainly of HPPs, and the following significant features should be taken into account for optimal power plant regime management of the power system [15,17,21 ]:
• almost 90% of the installed capacity of the system is accounted for by HPPs, which produce about 99.5% of the country’s electricity;
• Thermal power plants operate during the winter period (November-February) and supply hot water and electricity to Dushanbe city residents only;
• almost all HPP capacity (97 %) is concentrated on the Vakhsh river, which requires to take into account the downstream relations of the HPPs located thereof when determining optimal HPP operating regimes; the capacity of the Norak HPP, which has an annual (seasonal) regulation reservoir, is 80% of the total capacity of the Vakhsh cascade HPPs. Such predominance results in the fact that the water flow of the other HPPs in the cascade, which as a rule have daily regulated reservoirs, is mainly determined by the transit runoff of the Norak HPP. Naturally, the adjustment capacities of such hydropower plants in the EPS are extremely small.
The major part of electricity in Tajikistan is generated by HPPs concentrated on the Vakhsh, Syrdarya, and Varzob rivers. The main source of water resources are the mountains, mainly due to snowmelt. The water flows down in a natural way, reaching its peak level in June. The natural regime of levels and flow rates of the Vakhsh River in the period from October to March is characterized by a stable low-water period with small, almost uniform water flow rates, the lowest of them in December, with slight fluctuations in level. Vakhsh is characterized by low levels and expenditures in the autumn-winter period, when the river is fed mainly by groundwater and periodical precipitation. The rise in water consumption begins in April, the highest water consumption is observed in July, sometimes in late or early August, and the decline begins in mid-August, lasting until October. In mid-October, the lowwater state of the river begins, with flow rates of about 150- 250 m3 / sec. The hydrograph of the Vakhsh River is shown in Fig.1.
Fig.1. Hydrograph of the Vakhsh River
Thus, at present, Tajikistan is experiencing serious difficulties associated with a constant shortage of electricity; the power shortage amounts to 2-4 billion kWh in winter. The main causes of energy shortage in the Republic of Tajikistan are as follows [21]:
Tajikistan are as follows [21]:
• of all the HPPs, only the Norak HPP has a reservoir of annual (seasonal) regulation with a capacity of 10.5 km3 of water; all other HPPs have either daily regulation or no regulation at all. Stored energy cannot cover the country’s needs during the winter period.
• isolated operation of the power system. Since 2009, Tajikistan’s energy system has been operating in isolation, which makes it impossible to import electricity from neighboring countries in winter. In summer, the country has a surplus of electricity, which cannot be exported to neighboring countries. Therefore, a huge amount of water is discharged in vain. Energy loss in the summer period ranges from 3 to 7.5 billion kWh, depending on the water amount of a specific year.
• increase in electricity consumption by the population during the winter heating period. Thus, the relevance of this paper lies in the research and finding the solutions to the task of reduction of the current electricity shortage in Tajikistan based on the calculations of the optimal operating regimes for the HPPs in the country’s power system.
Fig.2. Diagram of the Vakhsh HPP cascade
Method of additional drawdown of Norak HPP reservoir
Eight HPPs are located in a cascade on the Vakhsh river. Six of them are located on the Vakhsh River itself; they are Bilding Rogun, Norak, Boygozi, Sangtuda – 1, Sangtuda – 2 and Sarband HPPs. The other two, Markazi and Sharshara HPPs, are located on the Vakhsh River main canal. Since the latter two HPPs have small installed capacities and are located on relatively small diversion dams intended for the accumulation of irrigation channels, they are not studied in this paper. We should point out that out of five reservoir- equipped HPPs under consideration, Norak HPP reservoir is the only one with the ability to regulate annual (seasonal) flow, while the remaining HPPs located downstream have daily regulation only. Vakhsh cascade scheme is shown in Fig.2.
With the cascade arrangement of HPPs, the task of optimization of their long-term regimes becomes more complicated. Cascade stations are linked in terms of flow rate, water pressure, power capacity, and power generation. HPPs of the cascade differ in varying degrees of flow regulation [22]. The upstream plants affect the downstream ones in the cascade, namely, the regulation of the flow and, as a result, the generation of electricity and power. The larger the reservoirs of the plants upstream, the greater is the effect. In the cascade, the joint flow regulation is implemented, based on the requirements of the power consumers and the power capacity of each HPP in the cascade. Usually, water and energy regulation of runoff is carried out according to the principle of maximum efficiency of the entire cascade, but each station can set its own limits for regulating the runoff [23].
The Government of Tajikistan is actively working to complete the construction of the Rogun HPP. The Rogun HPP with an installed capacity of 3,600 MW will become the largest station in Tajikistan, with an average annual power energy generation of 13.1 billion kW∙h [24]. The Rogun hydropower unit is the largest on the Vakhsh River, providing the most efficient operation of the entire cascade. With the commissioning of this station, it is possible to practically fully mastering the water and energy potential of the entire Vakhsh River, as well as regulate the flow of the Amu Darya River. The reservoir of the Rogun HPP will have an annual flow regulation, which will allow storing a huge amount of water in summer and dumping it in winter, thereby reducing the shortage of electricity in the country. Also, the construction of the Rogun HPP on the Vakhsh River will improve the operation mode of the Nurek HPP, since the joint work of Rogun and Nurek allows the efficient use of hydropower resources. [25].
The issues of long-term optimization of HPP regimes in isolated power systems by means of optimal flow redistribution between the years of different water level are covered in [22]. This paper addresses the task of determining the optimal fully drawn down level for the Norak HPP reservoir.
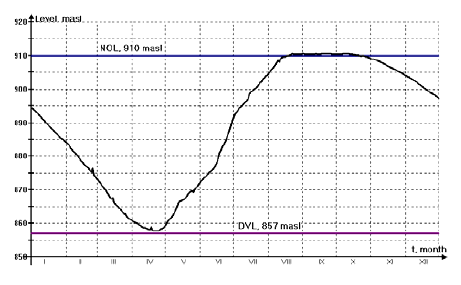
The refill regime of the Norak reservoir depends on the river flow. The reservoir needs to be filled to the normal operating level (NOL) during the high-water period, and emptied till the dead volume level (DVL) during the lowwater period. The management of the regime of the reservoir is a challenging task, as the river flow is stochastic in nature. Improper flow management can lead to serious consequences. Errors in the drawdown of water from the reservoir can lead to non-delivery of the guaranteed power in case of premature reduction till the DVL, while failure to draw down the water till DVL will lead to idle discharges, i.e. energy losses. Errors during water refill can result in failure to fill the reservoir to the NOL, with the possible underproduction of the guaranteed power; premature filling up to the NOL will lead to an increase of idle discharges [3]. To date, the refill/drawdown regimes of the Norak HPP reservoir are defined by the Dispatching control service of the OJSHC “Barqi Tojik”. The schedule of refill/drawdown of the Norak HPP reservoir is shown in Fig. 3.
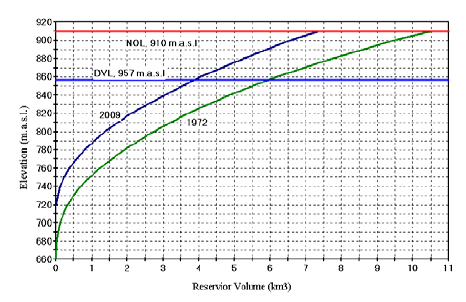
Definition of the optimal fully drawn down level of reservoir allows to designate the DVL mark. The main provisions and method given below are part of the water and energy calculations of HPPs with annual regulation [26]. The main task of the annual regulation reservoir is to increase the amount of energy and capacity of Hydropower plant during the low-water period of the year by using the excess water retained in the reservoir during the high-water period. Thus, there is a need to divide the entire volume of the annual regulation reservoir into two parts – useful and dead volumes. For the total volume of a reservoir, it is necessary to divide it into the above two volumes, i.e. to solve the problem of determining the fully drawn down level of the reservoir hop, and to set the DVL mark. When solving this task, we assume that the NOL of the reservoir is already known, and that the reservoir can be filled anytime during a high-water period. The part of the total reservoir volume that lies between the fully drawn down level and the NOL mark represents the useful volume of the reservoir Vus (Fig. 4). The volume curves (Fig. 4) show that the volume of the Norak HPP reservoir has changed over the time of its operation. On the basis of bathymetric surveys of 1989, 1994, 2001 and 2009, the volume losses of the Norak HPP reservoir were calculated. As of 2009, the total volume of the Norak HPP reservoir has decreased by 10.5 billion m3 as compared to the planned volume, and amounted to 7.37 billion m3 [21, 23].
Fig.3. Refill/drawdown schedule of the Norak reservoir
Fig.4. Volume curves of the Norak HPP reservoir
Below is the calculation of the optimal fully drawn down level of the Norak HPP reservoir based on the method suggested in [27]. The task is to find the fully drawn down level of the reservoir that will provide for the maximum energy effect of the hydropower plant. When the reservoir is drawn down below the DVL, the electricity generation increases by ΔW.
The criterion for completing the calculation, i.e. determining the optimal hop, m, is as follows: if WHPPhopi > WHPPhop(i+1) , then hopi is the optimal fully drawn down level and the calculation ends. However, according to calculations, we can find that with an increase in the fully drawn down level hop, Wres increases more than the decrease of Wriver. It can be found that the curve of the total HPP output EHPP does not bend even when the water is drawn down 23m below the planned DVL mark, i.e. the condition WHPPhopi> WHPPhop(i+1) is not met (Fig. 5).
Thus, it can be found that the generally accepted method for determining the optimal fully drawn down level of the reservoir [27] is not relevant for the Norak HPP reservoir. This method is applicable for the calculation of the optimal fully drawn down level of low- and medium-pressure HPP reservoirs, for which, as we have already indicated above, the pressure reduction is decisive. For high-pressure Hydropower plants, such as Norak, Sayano-Shushenskaya and other, the rule of changes in output depending on the fully drawn down level of the reservoir, shown in Fig. 5, does not apply. In [26], a different method was proposed for determining the optimal fully drawn down level of the Norak HPP reservoir by searching for a compromise solution, taking into account additional restrictions on the hydrology and technical characteristics of the dam. Taking into account the two above limitations, it is possible to determine the fully drawn down level of the reservoir at which the greatest energy effect can be obtained at the Hydropower plant. The power generation increases by ΔW for each (-1) meter of water draw down below the DVL. Additional Norak HPP electricity generation at draw down below the DVL is shown in Fig. 6.
Fig.5. Volume curves of the Norak HPP reservoir
Fig.6. Additional power generation at draw down below the DVL
The specific features of the hydraulic facilities of the Norak HPP are also taken into account. Pressure water conduits of the Norak HPP have the following specific features: the water is supplied to the HPP turbines of the Hydropower station from three water intakes; each of the three units is powered by a single supply pressure tunnel with a diameter of 10 m. The upper elevation of the pressure tunnel is 842 m above sea level, i.e. 15 m below the DVL (857 m) [26]. It can be said that the design of the hydraulic facilities provides for the drawdown of the reservoir below the planned DVL mark; and the difference between the maximum fully drawn down level and the planned DVL should not exceed 15m.
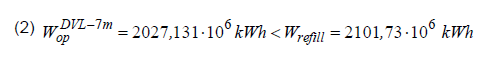
It is absolutely required to check the solution for the possibility of refill of the reservoir up to the NOL. It is necessary to calculate the drawdown energy and the refill energy of the reservoir. In case the refill energy exceeds the drawdown energy, the reservoir can be filled up to the NOL.
.
The calculations prove that even when the reservoir is emptied up to the level of 7 m below the planned DVL mark, the refill energy is greater than the drawdown energy. The drawdown of the Norak HPP reservoir is 7 m below the planned DVL mark, and the reservoir does get refilled up to the NOL during the high-water period. For the entire period of operation of the reservoir
.
The calculations show that when the Norak HPP reservoir is emptied to the level of 7 m below the planned DVL mark, the reservoir is filled to the NOL during the highwater period.
If we limit the drawdown of the reservoir to the level of 7 m below the planned DVL mark, and on condition the abovementioned restrictions are met, we can get an additional electricity generation of 178 million kWh, which will make for a 7% reduction of the winter energy deficit, and reduce the amount of idle discharges during the highwater period.
Conclusions
The major part (94%) of electricity in Tajikistan is generated by Hydropower plants of the Vakhsh cascade. Out of five HPPs in the cascade, only the Norak HPP has seasonally regulated reservoir, generating about 60% of the country’s electricity. All other HPPs are located downstream the Norak HPP and have daily regulated reservoirs.
It is possible to obtain additional electricity generation by drawing down the Norak HPP reservoir to a level below the planned DVL mark, with observance of all relevant restrictions. According to the compromise solution search results, lowering the water level in Norak HPP water reservoir by 7 m below the DVL will provide for an up to 7% cut in the power deficit.
Currently, the Norak HPP is operated in a mode where about 4.2 cubic kilometers of water accumulates in the reservoir in summer, and then this water is used to generate electricity in winter. Thus, the water level in the reservoir of the Norak HPP rises and falls by 50 meters during the year. In the presence of the Rogun HPP, the water level in the reservoir of the Norak HPP can be maintained at a constant level, while the reservoir of the Rogun HPP will be used to regulate the flow, the difference in the water level in it will vary up to 30 meters. This will make it possible to establish a permanent seasonal flow regime for the Norak HPP. The directions of further research will be connected with this.
REFERENCES
[1] Feng, Zhong-kai, Wen-jing Niu, and Chun-tian Cheng, Optimization of hydropower reservoirs operation balancing generation benefit and ecological requirement with parallel multi-objective genetic algorithm, Energy, 153 (2018), pp. 706-718. [2] Thaeer Hammid Ali, et al., A review of optimization algorithms in solving hydro generation scheduling problems, Energies, 13.11 (2020), 2787. [3] Ibanez Eduardo, et al., Enhancing hydropower modeling in variable generation integration studies, Energy, 74 (2014), pp. 518-528. [4] Nikitin Viacheslav, Nikolay Abasov, and Evgeny Osipchuk, Modeling of Long-term Operating Regimes of Hydro Power Plants as Part of Energy and Water Systems in the Context of Uncertainty, E3S Web of Conferences, 209 (2020). [5] Liao Sheng-li, et al, Long-term generation scheduling of hydropower system using multi-core parallelization of particle swarm optimization, Water Resources Management, 31.9 (2017), pp. 2791-2807. [6] Ahmad Asmadi, et al, Reservoir optimization in water resources: a review, Water resources management 28.11 (2014), pp. 3391-3405. [7] Azamathulla H.Md, et al., Comparison between genetic algorithm and linear programming approach for real time operation, Journal of Hydro-environment Research 2.3 (2008), pp. 172-181. [8] Ngoc Trieu Anh, Kazuaki Hiramatsu, and Masayoshi Harada. “Optimizing the rule curves of multi-use reservoir operation using a genetic algorithm with a penalty strategy.” Paddy and Water environment 12.1 (2014): pp. 125-137. [9] Kumar D. Nagesh, and Falguni Baliarsingh, Folded dynamic programming for optimal operation of multireservoir system, Water Resources Management, 17.5 (2003), pp. 337-353. [10] Braga Benedito, and Paulo SF Barbosa, Multiobjective real-time reservoir operation with a network flow algorithm 1, JAWRA Journal of the American Water Resources Association 37.4 (2001), pp. 837-852. [11] Xenarios Stefanos, Murodbek Laldjebaev, and Ronan Shenhav, Agricultural water and energy management in Tajikistan: a new opportunity, International Journal of Water Resources Development, 37.1 (2021), pp. 118-136. [12] Safaraliev M. Kh, et al, Energy Potential Estimation of the Region’s Solar Radiation Using a Solar Tracker, Applied Solar Energy, 56.4 (2020), pp. 270-275. [13] Laldjebaev M., R. Isaev, and A. Saukhimov, Renewable energy in Central Asia: An overview of potentials, deployment, outlook, and barriers, Energy Reports 7 (2021), pp. 3125-3136. [14] Ghulomzoda A. et al., Recloser-Based Decentralized Control of the Grid with Distributed Generation in the Lahsh District of the Rasht Grid in Tajikistan, Central Asia, Energies, 13 (2020), p. 3673. [15] Asanov M.S. et al., Algorithm for calculation and selection of micro hydropower plant taking into account hydrological parameters of small watercourses mountain rivers of Central Asia, Int. J. Hydrogen Energy, 46 (2021), № 75. pp. 37109-37119 [16] Ghulomzoda A. et al., A Novel Approach of Synchronization of Microgrid with a Power System of Limited Capacity. Sustainability, 13(2021), p. 13975. [17] Matrenin P. et al., Adaptive ensemble models for medium-term forecasting of water inflow when planning electricity generation under climate change, Energy Reports, 7 (2021). [18] Kirgizov A.K. et al., Expert system application for reactive power compensation in isolated electric power systems, Int. J. Electr. Comput. Eng., 11 (2021), No 5, pp. 3682-3691. [19] Masih A. et al., Application of Dual Axis Solar Tracking System in Qurghonteppa, Tajikistan, in Proceedings of 2019 the 7th International Conference on Smart Energy Grid Engineering, SEGE 2019, 2019, no. 2, pp. 250–254. [20] Matrenin P. et al., Medium-term load forecasting in isolated power systems based on ensemble machine learning models, Energy Reports, 7 (2021). [21] Kirgizov A., et al, Characteristics of Relative Growth for HPP Power Systems of Tajikistan, IOP Conference Series: Materials Science and Engineering, 883 (2020), No. 1. [22] Filippova T.A., Sidorkin Yu. M., and Rusina A.G., Optimization of electric power plants and power systems regimes, Novosibirsk: NSTU publishing House, 2007, 356 p. [23] Yuri Sekretarev, Sherkhon Sultonov and Victor Shalnev, Optimal Control Regime of the Vakhsh Hydropower Reservoirs to Reduce Electricity Shortages in Tajikistan, Applied Mechanics and Materials, 792 (2015), pp. 446-450. [24] Safaraliev Murodbek, et al., The transient analysis of the hydrogenerator of Nurek HPP subject to automatic excitation control action.” Przegląd Elektrotechniczny 96 (2020), No. 8, pp.35-38 [25] Kokin S.E., et al., Transient stability analysis in rotor winding of hydrogenerator at various short circuit values in power grid in consideration with AEC, in 2019 16th Conference on Electrical Machines, Drives and Power Systems, ELMA 2019 – Proceedings, 2019, pp. 1–4. [26] Sekretarev Yu. A., Sultonov Sh.M.,and Nazarov M. Kh, The possibility of additional drawdown of the Norak reservoir to increase production, Hydropower Stations in the XXI century: collection of materials of the Third All-Russian Scientific and Practical Conference. Sayanogorsk, 2016, pp. 384-388. [27] Sekretarev Yu. A., Zhdanovich A.A., and Mitrofanov S.V., Hydropower engineering: contra. of the task and method, Novosibirsk: NSTU Publishing house, 2013, 64 p.
Authors: PhD Sultonov Sherkhon Murtazoqulovich, Department of Electric stations, Tajik Technical University named after academic M. S. Osimi, Dushanbe 734042, Tajikistan, e-mail: sultonzoda.sh@mail.ru; post–graduate student Murodbek Kholnazarovich Safaraliev , Department of Automated Electrical Systems, Ural Federal University, 19, Mira Street, Yekaterinburg, 620002, Russian Federation, e-mail: murodbek_03@mail.ru; D.Sc Sergey Evgenevich Kokin, Department of Automated Electrical Systems, Ural Federal University, 19, Mira Street, Yekaterinburg, 620002, Russian Federation, e-mail, e-mail: s.e.kokin@urfu.ru; Stepan Alexsandrovich Dmitriev, Department of Automated Electrical Systems, Ural Federal University, 19, Mira Street, Yekaterinburg, 620002, Russian Federation, e-mail: dmstepan@gmail.com; PhD Inga Zicmane, Faculty of Electrical and Environmental Engineering, Riga Technical University, LV1048 Riga, Latvia, e-mail: Inga.Zicmane@rtu.lv; PhD Shokhin Dzhuraevich Dzhuraev, Department of Electric Power Engineering, Branch of the National Research University ‘Moscow Power Engineering Institute’ in Dushanbe City, Dushanbe 734002, Tajikistan, e-mail: dzhuraevsh@mail.ru
Source & Publisher Item Identifier: PRZEGLĄD ELEKTROTECHNICZNY, ISSN 0033-2097, R. 98 NR 4/2022. doi:10.15199/48.2022.04.12
Published by Lorenzo Mari, EE Power – Technical Articles: Substation Grounding Basics: Step, Touch, and Transferred Voltages, October 09, 2020.
Learn about Earth potential gradients and shock situations in substations.
The conduction of high currents to ground in substations due to atmospheric disturbances or equipment failures generates potential gradients on Earth’s surface that are a threat to the safety of persons and animals in the surroundings.
Grounding Grid Design Criteria
The performance of a grounding grid in a substation involves criteria related to the electrical response of one or more electrodes immersed in the Earth.
Currents on the order of thousands of amperes produce high potential gradients in the vicinity of the points of contact of the substation grid to the Earth. If people or animals touch places having different potentials, they may suffer an electric shock.
The most critical design criteria for grounding grids are:
• Avoid hazardous potential gradients in the vicinity of grounded electrical structures during fault conditions
• Obtain a ground resistance lower than a preset value. It is vital to understand that a low ground resistance value does not ensure the safety of people standing on the earth above the grounding grid or in the surrounding area
The design of the grounding grid requires the computation of the maximum step, touch, and transfer voltages that a person can withstand.
The Electric Potential
A charged particle inside an electric field has potential energy because of its interaction with the field. The electric potential in a location is the potential energy per unit charge placed at the location. The electric potential unit is the volt, denoted by V, in honor of the Italian scientist Alessandro Volta (1745–1827).
If a charge moves from one point (P1) to another point (P2) along any path, the electric field experiences an electric potential difference – or voltage – between P1 and P2.
To ascertain the amount of work required to move the charge from P1 to P2, we must have a reference level from which we can begin to find the energy expended. Usually, this reference position is at a considerable distance from all charges, and the electric potential at this distance is 0 V, as a matter of convenience.
Any point may be a reference position, and the reference potential magnitude can be any value. Frequently, in circuit analysis, the Earth is the reference of potential with a value of 0 V.
Earth Potential Gradients
The total value of the ground resistance of an electrode may be described by adding resistances in series from the electrode to a point at an infinite distance from the electrode. The magnitude of these resistances is inversely proportional to the distance from the electrode. The larger resistances are near the grounding electrode; the rate of the total resistance’s rise decreases as we move away from the electrode.
When a current (I) from a ground fault or an atmospheric discharge goes through the grounding electrode, it flows through all resistors to infinity. According to Ohm’s law, this current creates a voltage drop of magnitude V = IR across each resistance.
The potential at every point on the Earth may be computed by adding the voltage drops from the electrode to infinity, taking the grounding electrode as a reference position with a reference potential of 0 V.
In practice, the potential is measured on Earth’s surface, using techniques such as the fall of potential method.
Figure 1 shows how Earth’s potential – with respect to the grounding electrode – increases as we move outward from the electrode.
Figure. 1 Potential profile with the grounding electrode as the reference position. GPR stands for ground potential rise. Image courtesy of Prof. J. H. Briceño
The rate of rise of the potential is high in points close to the electrode but decreases as we move away, just like resistance, which is reasonable since Ohm’s law is a linear equation. Therefore, most of the potential resulting from the current I appears on Earth’s surface close to the grounding electrode.
As seen in Figure 1, the potential starts at 0 V and reaches the maximum value at infinity.
In grounding analysis, the common practice is to use infinity as the reference position for Earth’s potential rather than the grounding electrode. Then, the potential will be at its maximum value at the electrode and will decrease as we move away from it, to reach a value of 0 V at infinity.
The ground potential rise (GPR) is the maximum electric potential that the grounding electrode may reach. Numerically, it is the product of current I times the electrode resistance to ground Rg.
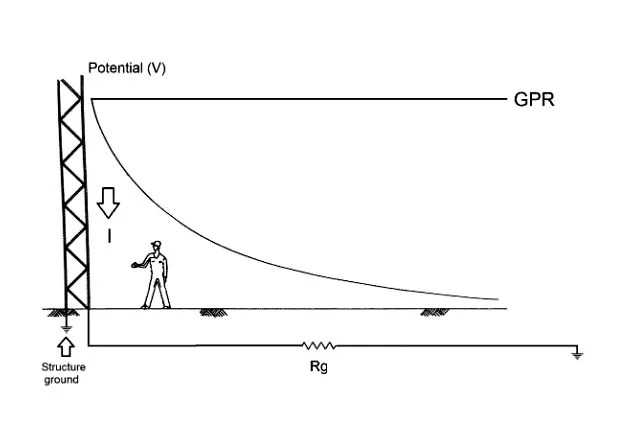
Figure 2 shows a typical substation structure grounded only at its foundation and a curve of Earth potential vs. radial distance. Notice that the potential on the Earth’s surface is at its maximum at the facility, lessening as the distance increases.
Figure 2. Potential profile with infinity as the reference position
The curve of potential in Figure 2 is a mirror image of the curve seen in Figure 1. This is caused by the exchange of the reference positions.
In practice, with a single rod, the potential will be negligible after a distance of about 20 m, showing that infinity is closer than we might think.
The curve of potential goes around the grounding electrode, producing a “potential funnel” surrounding the electrode.
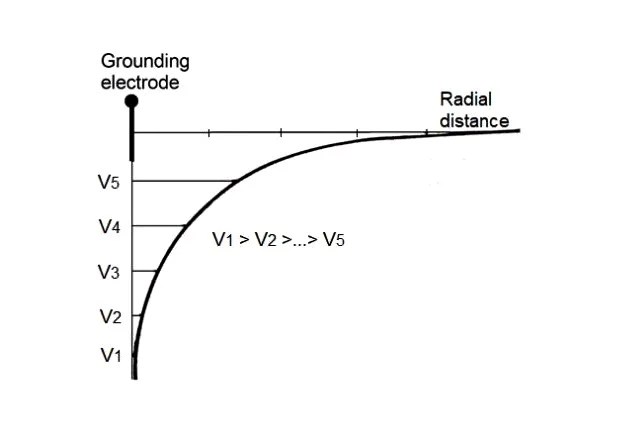
Some publications exhibit the values of potential on the lower portion of the ordinate axis, as shown in Figure 3. This could cause confusion, as the usual practice is to display positive values on the upper portion of the ordinate axis.
Figure 3. Another way of displaying the potential profile with infinity as the reference position
Figure 4 shows a potential contour based on Figure 3. This potential contour is a projection of the “potential funnel” on Earth’s surface. The circles are equipotential lines because they join all points with the same potential.
Figure 4. Equipotential lines on Earth’s surface
With a symmetrical electrode – and constant soil resistivity – the equipotential points on Earth’s surface form a set of concentric circles. In practice, the contours are never perfect circles; their shape varies depending on several factors, and the ones shown are for illustration only.
Subtraction of the potentials of two adjacent circles gives the potential difference — or voltage — between them.
Step, Touch, and Transferred Voltages
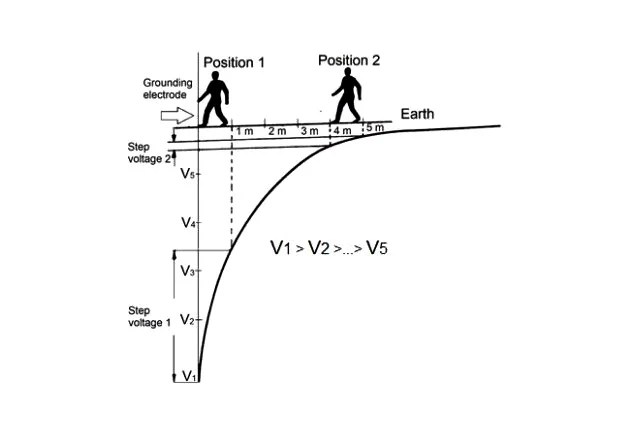
Figure 5 shows three typical shock situations analyzed when designing grounding grids in electrical substations. Recall that the potential profile shows up when injecting a current I into the grounding electrode.
Figure 5. Step, touch, and transferred voltages. Image courtesy of Prof. J. H. Briceño
Situation 1 is the step voltage. When people walk towards the grounding electrode, their feet “see” different potentials. The potential difference is the step voltage. The standard length of a step is 1 m for people and 1.5 m for animals.
Step voltage can be dangerous under certain circumstances. Still, several studies show that, although painful, it is less hazardous than other types of contacts because the current circulating from one foot to the other does not pass through the vital organs of the body, like the heart. However, the step voltage can cause the person to fall, triggering a current flow through the chest and putting vital organs at risk. It could also affect a person working or lying on the floor.
In animals, the greater separation between the extremities causes higher voltages, and, due to their anatomical constitution, the heart is in the current’s path.
Figure 6 shows a person walking on Figure 3’s curve towards the grounding electrode. It is clear that the step voltage increases as the person approaches the electrode, the worst case being when they touch. This is due to the steeper slope of the curve on the Earth near the electrode.
Figure 6. Step voltages as the person approaches the grounding electrode
In Situation 2, a person touches a grounded structure having their feet at a potential other than that of the structure’s ground. This situation is the touch voltage. As seen in Figure 5, the potential at the assembly is the GPR. The maximum distance that a person can reach is 1 m, so that is the separation between the hand and foot contacts.
Situation 2 is more dangerous as the current circulates through vital organs, including the heart.
Situation 3 is the transferred voltage. This situation is a particular case of touch voltage that happens when the person is far from the grounding electrode and touches a metal element in contact with the electrode. Here, the person “sees” a potential difference equal to or exceeding the GPR of the substation. The potential difference is more significant in Situation 3 than in the other two.
An essential criterion for safety is having the magnitudes of step voltage and touch voltage below the threshold at which injury may occur.
A Review of Touch, Step, and Transferred Voltages
High currents through the substation grid produce potential gradients on the Earth’s surface that may endanger the lives of people and animals nearby.
A grounding grid must control the potential gradients and create adequate ground resistance.
The ground potential rise (GPR) is the maximum electric potential that a grounding electrode may reach. In grounding practice, the reference position for electric potential is infinity. The potential at the electrode is the GPR, and it decreases in a radial direction, reaching 0 V at infinity.
Three typical shock situations analyzed when designing grounding grids are step, touch, and transferred voltage. Touch voltage is the most dangerous because the current passes through vital organs in the body. Transferred voltage is a particular case of touch voltage in which the body may be subjected to the full GPR.
The design of a grounding grid must pursue safe values of step, touch, and transferred voltage.
Author: Lorenzo Mari holds a Master of Science degree in Electric Power Engineering from Rensselaer Polytechnic Institute (RPI). He has been a university professor since 1982, teaching topics as electric circuit analysis, electric machinery, power system analysis, and power system grounding. As such, he has written many articles to be used by students as learning tools. He also created five courses to be taught to electrical engineers in career development programs, i.e., Electrical Installations in Hazardous Locations, National Electrical Code, Electric Machinery, Power and Electronic Grounding Systems and Electric Power Substations Design. As a professional engineer, Mari has written dozens of technical specifications and other documents regarding electrical equipment and installations for major oil, gas and petrochemical capital projects. He has been EPCC Project Manager for some large oil, gas & petrochemical capital projects where he wrote many managerial documents commonly used in this kind of works.
Published by Saheed Lekan GBADAMOSI1, Nnamdi NWULU1, O.M. BABATUNDE2, Dept. of Electrical & Electronics Engineering Science, University of Johannesburg, South Africa (1), University of Lagos, Nigeria (2)
Abstract. This paper presents a modelling and simulation approach using the Electrical Transient Analyzer Program software to evaluate the magnitude and effects of harmonics from varying RES into the transmission system. An analytical technique was developed to estimate and quantify the harmonic power flow and losses amplification on the transmission lines. The efficiency of the proposed approach is implemented on nondistorted Garver’s 6 bus and IEEE 24 bus test systems. The developed technique can quantitatively estimate harmonic contributions from RES.
Streszczenie.. W artykule przedstawiono podejście do modelowania i symulacji przy użyciu programu Electrical Transient Analyzer – programu do oceny wielkości i skutków harmonicznych ze zmieniających się źródeł odnawialnych do systemu przesyłowego. Opracowano technikę analityczną do szacowania i określania ilościowego przepływu mocy harmonicznych i strat w liniach przesyłowych. Efektywność proponowanego podejścia jest implementowana w 6-szynowych systemach Garvera i IEEE 24. (Oszacowanie harmonicznych w systemie przesyłowym z dużej skali odnawialnymi źródłami energii)
Keywords: Generation, Harmonics, Power loss, Renewable energy sources, Transmission. Słowa kluczowe: żródła odnawialne, systemy przesyłowe, zawartość harmonicznych.
Introduction
As the utilization of renewable energy sources are actively promoted with many countries of the world meeting their energy demand through the use of RES. In order to accommodate these sources, the transmission network is faced with various challenges such as power quality, system reliability, and frequency and voltage imbalance which has adverse effects on the power system operation. In modern power system, the mature RES technologies available are wind power and solar photovoltaic owing to their environmental-friendly nature and sustainable electrification [1]. The wind and photovoltaic systems together with power converters are strong power electronic devices and thus emitting harmonic current into the transmission network. With continuous deployment of RES and their transmitting medium, harmonic distortion has become a major concern for power system planners as harmonics can lead to decreased voltage quality, overheating of transformer and reduce life expectancy of power equipment. In power systems, harmonics can be contributed from both the consumer loads and the utility supply. At the consumer, the increase use of non-linear loads [2] such as modern electronic circuitry and switching apparatus frequently affect the quality of power supply. Similarly, RE generators mostly use variable speed generator in connection with inverter and high voltage direct current (HVDC) transmission link inject undesirable harmonics into transmission network. Therefore, harmonics is a major dominant features of power quality that require to be kept at a lowest level in accordance to IEEE 519-1992 standard [3].
Several researchers have worked on harmonic contributions from the utility and consumer sides. Ref. [4] investigates the harmonic current on the distribution network when charging an electric vehicle in a residential area. The Monte Carlo Simulation was employed for simulation of the electric vehicle load demand. The method proposed in [5] was based on complex arithmetic approach to compute harmonics injected by distributed generators in distribution system. Ref. [6] presents artificial neural network and bacterial foraging approach for effective evaluation of harmonics pollution in a power system. Ref. [7] investigates the harmonic contributions from a foundry on a distribution network. The quantity of harmonic penetration from the foundry was obtained using Simulink software in Matlab and successive approximation technique was employed to estimate the harmonic impacts on the voltage profile of the distribution system. Ref. [8] discusses many approaches through which wind power can influence harmonic quantity in power system. A new method is presented in [9], which investigates the harmonic pollution and voltage stability by the distributed generators. The DGs are grid tied and consists of wind and PV systems. A new technique was presented in [10] for harmonics computation in power systems. The new algorithm was based on bus voltage for power system modelling using genetic algorithm and phase values. Ref. [11] modelled a wind farm and the system harmonic impedance was estimated for different operating conditions. A simplified approach is presented to compute harmonic load flow so as to designate the voltage pollution problems. A new scheme is presented in [12] for harmonic distortion reduction in residential systems. The approach employs filter configuration at different locations of the distribution system. Ref. [13] considered the harmonic contributions from PV DG and the non-linear loads from the consumers side. Ref. [14] considered harmonics emanating from residential components of a distribution system. A modal analysis method is proposed for prioritizing harmonic compensation based on DG location at different nodes. Ref. [15] presents the impacts of harmonics from PV penetration in an unbalanced distorted distribution system. The optimization problem is solved using Monte Carlo Simulation and Interior point techniques. Ref. [16] proposed a probabilistic technique for mitigating harmonic distortion in a distribution system by deploying different DGs. Ref. [17] developed statistical inference technique to estimate the harmonic index emanating from the non-linear loads on a power system network. Ref. [18] presents a recursive least square method for harmonic estimation in a distorted distribution system. A 3-phase filter is employed to mitigate the harmonics from non-linear loads on the distribution network. Ref. [19] proposed a new technique for harmonic sources identification in a distribution network. The estimated error is computed in order to ascertain the quantity of harmonics at the nodes.
This study addresses the issues of power quality associated with transmission system planning with largescale renewable energy sources. An analytical approach is developed for harmonic power flow calculations. The objective is to estimate the harmonic quantity emanating from renewable energy sources (solar and wind power) and high voltage direct current (HVDC) transmitting medium.
Therefore, grid modelling and simulation are performed on two standard non-distorted Garver’s 6 bus and IEEE 24 bus test systems using Electrical Transient Analyzer Program (ETAP 12.6.0) software. The harmonic power losses are determined based on the computed harmonic line parameters. This paper main contributions are:
• grid modelling and simulation of large-scale RES with power electronic based HVDC transmitting medium to quantified the harmonic contributions.
• state estimation of harmonic power flow and losses on the transmission system are addressed with appropriate allocation of RES on the grid.
This paper is organized into five sections as follows: Section 2 presents the system load flow for proper evaluation of the transmission system characteristics. In Section 3, state estimation for harmonic power flow and losses on a transmission system. Section 4 presents the simulation results and discussion for two case studies and finally, the paper is concluded in Section 5.
Table 1. A review of related works on harmonics contribution from utility and consumer sides
.
Transmission system load flow
The system load flow is an essential systematically study to determine the power systems performance under normal working conditions on a transmission system. Load flow techniques have been established to analyse the pattern of power flow for both balanced and unbalanced system. This can be carried out for power system operation and planning. However, modelling of transmission system required proper modifications with high penetration of nonlinear renewable energy sources [20]. The nonlinearity characteristic is attributed to the harmonic contributions from power electronics-based inverter, wind turbine and PV module as shown in Fig. 1.
Modelling of line parameter’s
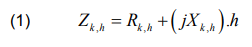
The transmission line impedance is determined by the system frequency, which has the ability to magnify harmonics from each components of the RES. Therefore, transmission line impedance changes with frequency of the system resonances which give rise to harmonic frequency amplification.
.
where Rk,h and Xk,h are the resistance and reactance of the transmission line k at hth harmonics. Similarly, the transmission line admittance matrix of the hth harmonics is a reciprocal of the line impedance which is generated separately for any order of harmonics.
.
Harmonics modelling of renewable energy components
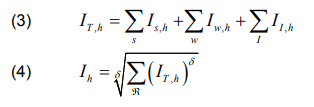
In this study, the harmonic sources are modelled as current injections and these sources are wind turbines [21], PV modules and power electronic inverter as presented in Fig. 1. The sum of individual harmonic current at each source determines the current harmonics at the point of common coupling (PCC). The sum total of the harmonic currents at the PCC is always less than the quantity of harmonic emissions from those components. This is referred to as harmonic aggregation and it diverges between different harmonic contributions based on different harmonic buses [10].
.
where Is,h , Iw,h and II,hare the current harmonics for solar, wind and HVDC link, Ihis the aggregation of current harmonics, ℜ is the number of harmonic sources available, δ is the aggregation summation component and the values are δ = 1 for h < 5 , δ = 1.4 for 5≤h≤10 and δ = 2 for h > 10 .
Harmonic state estimation on a transmission line
The harmonics current and voltage are characterized with many undesired problems such as overheating and overvoltage on the transmission lines [3]. The state estimation of harmonic problems possesses a nonlinearity structure owing to the magnitude and phase components of the harmonics and this can be resolved using either conventional or optimization methods [22]-[24].
Fig.1. Schematic pattern of harmonic current flow
Harmonic current
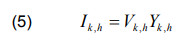
The current and voltage harmonic contributions from RES components are magnified by the resonance which multiply the harmonics quantity that occur on the transmission line. The current harmonic flowing on the transmission line is a function of the voltage harmonics at the buses and the harmonic admittance.
.
where Vk,hand Yk,hrepresent the harmonic voltage and admittance on the transmission line.
Harmonic power flow
The harmonic power flow is determined based on the solution provided by the set of linear equations. This is usually done to ascertain the resonant magnitude at each bus.
.
where and represent the harmonic voltage and admittance at each bus.
Harmonic power loss
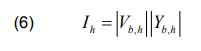
The harmonic sources are represented as current injections. Therefore, in order to compute the harmonic power loss at each bus, the harmonics magnitudes and phase angles are considered, which are characterized by random variables.
.
where Vb,hand Yb,hrepresent the harmonic voltage and current at each bus; and is the phase angle difference at each bus.
Total harmonic distortion
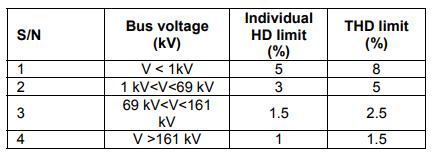
The voltage total harmonic distortion (THDv) is the harmonics contribution of individual harmonic components at each bus of the system. In accordance to IEEE 519-1992 standard, the THDv must not exceed its maximum permissible limit (THDvmax).
Table 2. International standard for total harmonic distortion for different voltage levels [25].
.
Simulation of the study system
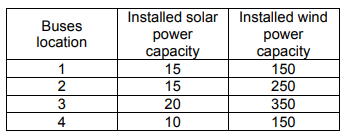
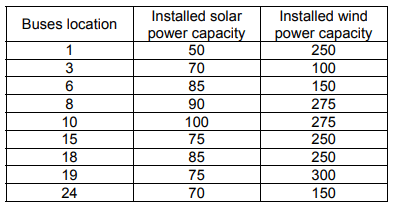
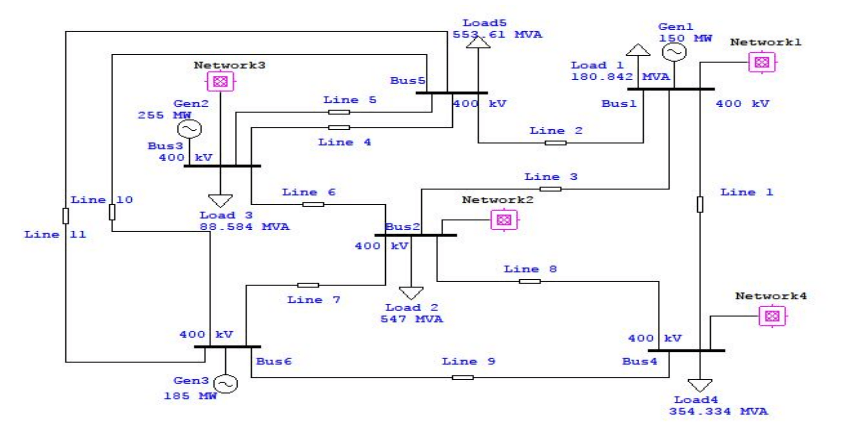
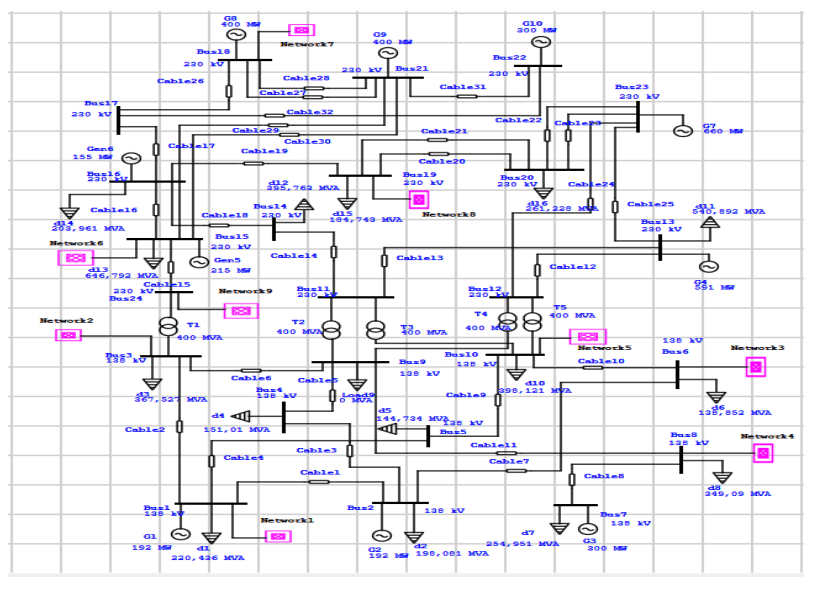
Two case studies were considered for modelling and the simulation has been performed using Electrical Transient Analyzer Program (ETAP) 12.6.0 software package. The case studies are the undistorted IEEE 6-bus and 24-bus test systems. The grid modelling for the 6-bus system as shown in Fig. 2 has four solar and wind farms with installed capacity of 60 MW and 900 MW respectively. Similarly, the 24-bus system has shown in Fig. 3 contains nine solar farms and wind parks with capacity of 700 MW and 2000 MW respectively.
Wind turbines
In this study, a doubly-Fed Induction Generator (DFIG) was used for wind turbine with rated power of 5 MW. In order to obtain both the magnitude and phase angle of the current harmonics, DFIG is modelled as a current source with parameters such as rotor resistance, stator resistance, reactance and magnetizing reactance valued at 0.0389 pu, 0.005 pu, 0.085 pu and 7.089 pu respectively. The generated power from the wind farm is sent to the wind farm transformers of voltage of 22 kV, which later fed the HVDC link.
Table 3. Installed capacity of renewable energy sources for 6-bus system.
.
Table 4. Installed capacity of renewable energy sources for 24-bus system.
.
Solar PV panels
Here, the PV array are formed from the series and parallel formation of the solar PV panels in order to obtain the desirable output current and voltage. The PV rated capacity is 550 kW with power factor close to unity. The AC rated voltage and the input DC voltage are 400 V and 600 V respectively. The power output of solar PV farm is also connected to the transformer of 22 kV and its fed into the HVDC link.
Cables
This study considered offshore renewable energy sources because of easy accessibility of adequate wind speed. The cables in between turbines and PV arrays are modelled as parameters and the cables for transmitting power to the grid is modelled as distributed parameters. The length from the offshore to the grid 50 km and the length in between turbines is 1 km. The cables series resistance, reactance and susceptance are 0.063 Ω/km, 0.192 Ω/km and 0.06 mS/km respectively.
HVDC link
Here, a Voltage Source Converter HVDC transmission system is used and it consists of converter (rectifier and inverter), transformers, phase reactor, DC cables, DC capacitors and breakers. The values of the parameters used for this study are as obtained in [26]. A closed loop control is employed for the converter station and the PV and wind generating stations are controlled by stationed AC voltage. The reference value for the PV and wind farms as well as converter station is set to 500 MW. The AC and DC reference voltage values are 150 kV and 300 kV respectively.
Simulation results and discussion
The Garver’s 6-bus and IEEE 24-bus test systems are adopted in the harmonic estimation and are applied to simulate both the RES and power system components. In this study, harmonic analysis has been performed for the emission emanating from wind turbines, PV arrays and HVDC links spreading through the PCC and into the grid and consumers domain.
Fig.2. Modelling of Garver 6-bus system with RES
Fig.3. Modelling of IEEE 24-bus system with RES.
Table 5. Individual and total harmonic distortion for voltage in 6-bus system
.
Table 6. Individual and total harmonic distortion for voltage in 24-bus system
.
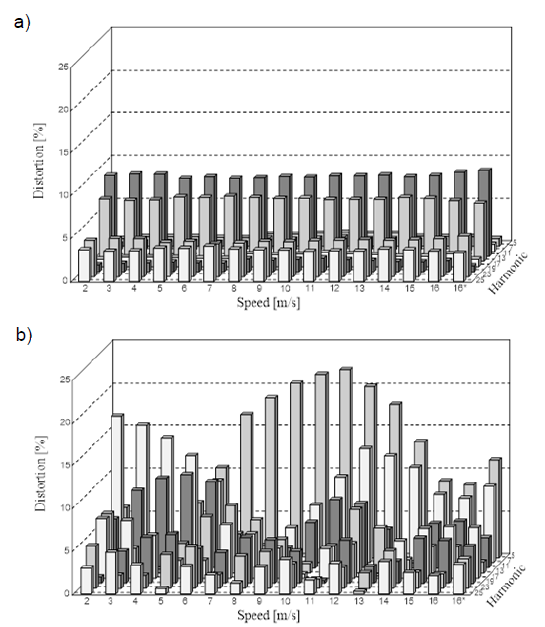
The findings of this study are presented in Tables 5-8. The individual and total harmonic emissions from the harmonic sources into the grid buses for 6-bus and 24-bus test systems are presented in Tables 5 and 6 respectively. From 6-bus system, it can be observed that the THD ranges from 6.88% to 10.82%. This is an indication that harmonic contributions at each bus exceeded the recommended standard limits as given in Table 2. The wind turbines, PV arrays and HVDC links contributes significant harmonics to the grid. Also, the harmonic level is relatively high in bus 5 and 6 as compared to other buses. This is an indication that the transmission system experience high resonance as a result of magnified harmonics at buses 5 and 6. The harmonics emanating from the RES components propagates to the nearest buses and this propagation is the same to all buses without RES components at odd orders of harmonics. The main reason is because of the wind and Solar PV power are more dominant in the grid.
Fig.5. Harmonic power loss variation on a 24-bus test system.
Table 6 shows the individual voltage harmonics and total harmonic distortions for 24-bus test system. It is observed that there is significant harmonic violation at all the buses for both the individual and total harmonic distortions. These are odd harmonics which violate the recommended standard limits as specified by IEEE. Figures 4 and 5 show harmonic power loss along each bus for Garver 6-bus and 24-bus test systems. The harmonic power losses are computed from the proposed analytical method which are calculated from harmonic contributions of individual harmonics at each bus. These harmonic power losses are induced by the harmonic contributions from wind turbines, PV arrays and HVDC links. These values reflect the relative influence of harmonic distortions on power losses.
From Tables 7 and 8, it can be observed that the distortions at each bus has significant impact on the power system characteristics of Garver bus and 24-bus systems respectively. The background harmonics results in significant decrease in power factor and increase in voltage drop at each bus. The levels of power factors are much lower, hence, resulting in an increase in voltage drop across the buses. The power system characteristics are heavily impacted by the high frequency harmonic emissions from the wind and solar PV parks into the grid. The resonance in the wind and solar PV parks occurs due to the inductance and capacitance of the transformers and transmission cables respectively. Hence, the buses without RES experience some level of resonance frequency owing to the distance between them and the parks.
Table 7. Power system characteristics for a 6-bus system
.
Table 8. Power system characteristics for a 24-bus system.
.
Conclusion
This paper presents a study on harmonic distributions in a large-scale renewable energy integrated system. In this study, analytical method is proposed for estimating harmonic power loss and power flow at the bus and transmission network. Based on this method, the harmonic power loss and power flow can be effectively computed from the individual and total harmonic distortions as obtained from each bus. The characteristics of harmonic propagation patterns are investigated based on harmonic contributions from wind and solar PV parks. The effectiveness of the developed approach is tested on IEEE 6-bus and 24-bus test systems. Simulation results show that the individual harmonic distortions and total harmonic distortions are aboved the recommended limit at the buses owing to the emissions originating from the solar and wind parks into the grid. These harmonics has significant impact on the power losses and power system characteristics.
REFERENCES
[1] Gbadamosi S.L., Nwulu, N.I., A multi-period composite generation and transmission expansion planning model incorporating renewable energy sources and demand response. Sustain. Energy Technol. Assessments, 2020, vol.39, p. 100726. [2] Nwulu N.I., Fahrioglu M., Investigating a ranking of loads in avoiding potential power system outages, Przeglad Elektrotechniczny, Volume 88, Issue 11 A, 2012. [3] Gbadamosi S.L., Melodi A.O., Harmonic distortion from induction furnace loads in a steel production plant. Int. Inst. Sci. Technol. Educ., 2013, vol. 3, no. 10, pp. 8–17. [4] Kutt L., Saarijarvi E., Lehtonen M., Molder H., Niitsoo J., Estimating the harmonic distortions in a distribution network supplying EV charging load using practical source data – Case example. IEEE Power Energy Soc. Gen. Meet., 2014, vol. 2014, pp. 4–8. [5] Wang S., Liu X., Wang K., Wu L., Zhang Y., Tracing harmonic contributions of multiple distributed generations in distribution systems with uncertainty. Int. J. Electr. Power Energy Syst., 2018, vol. 95, pp. 585–591. [6] Ray P.K., Subudhi B., Neuro-evolutionary approaches to power system harmonics estimation. Int. J. Electr. Power Energy Syst., 2015, vol. 64, pp. 212–220. [7] Gbadamosi S. L., Melodi A.O., EFFECTS OF STEEL PLANTS WITH THREE-PHASE INDUCTION FURNACES ON POWER DISTRIBUTION QUALITY OF THE EXISTING 33 kV NETWORK IN NIGERIA. Adv. Sci. Technol. Res. J., 2015, vol.9, no. 27, pp. 1–10. [8] Bollen M. H. J., Yang K., Harmonic aspects of wind power integration. J. Mod. Power Syst. Clean Energy, 2013, vol. 1, no.1, pp. 14–21. [9] Malik M., Sharma P.R., A scheme for reduction in harmonics and establish the stability of hybrid system connected in grid. Ain Shams Eng. J., 2020, pp. 1–8. [10] Bečirović V., Pavić I., Filipović-Grčić, B. Sensitivity analysis of method for harmonic state estimation in the power system. Electr. Power Syst. Res., 2018, vol. 154, pp. 515–527. [11] Papathanassiou S. A., Papadopoulos M. P., Harmonic analysis in a power system with wind generation. IEEE Trans. Power Deliv., 2006, vol. 21, no. 4, pp. 2006–2016. [12] Bagheri P., Xu W., Ding T., A Distributed Filtering Scheme to Mitigate Harmonics in Residential. IEEE Trans. Power Deliv., 2016, vol. 31, no. 2, pp. 648–656. [13] Sakar S., Balci M. E., Abdel S. H. E., Zobaa A. F., Integration of large- scale PV plants in non-sinusoidal environment: Considerations on hosting capacity and harmonic distortion limits. Renew. Sustain. Energy Rev., 2018, vol. 82, 176–186. [14] Munir S., Li Y. W., Compensation Scheme Using Power Electronics Interfaced DGs. IEEE Trans. Smart Grid, 2016, vol.7, no. 3, pp. 1191–1203. [15] Cagri I., Karatepe E., Boztepe M., Impact of harmonic limits on PV penetration levels in unbalanced distribution networks considering load and irradiance uncertainty. Electr. Power Energy Syst., 2020, vol. 118, p. 105780. [16] Abdelsalam A. A., El-saadany E. F., Probabilistic approach for optimal planning of distributed generators with controlling harmonic distortions. IET Gener. Transm. Distrib., 2013, vol. 7, no. 10, pp. 1105–1115. [17] Mazin H. E., Xu W., Huang B., Determining the Harmonic Impacts of Multiple Harmonic-Producing Loads. IEEE Trans. Power Deliv., 2011, vol. 26, no. 2, pp. 1187–1195. [18] Garanayak P., Panda G., Ray P. K., Harmonic estimation using RLS algorithm and elimination with improved current control technique based SAPF in a distribution network. Int. J. Electr. Power Energy Syst., 2015, vol. 73, pp. 209–217. [19] Ujile A., Ding Z. A., dynamic approach to identification of multiple harmonic sources in power distribution systems. Int. J. Electr. Power Energy Syst., 2016, vol. 81, pp. 175–183. [20] Puchalapalli S., Pindoriya N. M., Harmonics assessment for modern domestic and commercial loads: A survey. Int. Conf. Emerg. Trends Electr. Electron. Sustain. Energy Syst. ICETEESES 2016, pp. 120–125. [21] Rajan , K. Dhayalini , S. Sathiyamoorthy, Genetic Algorithm for the coordination of wind thermal dispatch, PRZEGLĄD ELEKTROTECHNICZNY, ISSN 0033-2097, R. 90 NR 4/2014 [22] Kabalci Y., Kockanat S., Kabalci E. A., modified ABC algorithm approach for power system harmonic estimation problems. Electr. Power Syst. Res., 2018, vol. 154, pp. 160–173. [23] H. Bouzeboudja, M. Maamri , M. Tandjaoui, The Use of Grey Wolf Optimizer (GWO) for Solving the Economic Dispatch Problems based on Renewable Energy in Algeria A case study of “Naama Site”, PRZEGLĄD ELEKTROTECHNICZNY, ISSN 0033-2097, R. 95 NR 6/2019. [24] W. Khamsen, C. Takeang, Hybrid of Lamda and Bee Colony Optimization for Solving Economic Dispatch, PRZEGLĄD ELEKTROTECHNICZNY, ISSN 0033-2097, R. 92 NR 9/2016 [25] Aurasopon , W. Khamsen, An improved local search involving bee colony optimization using lambda iteration combined with a golden section search method to solve an economic dispatch problem, PRZEGLĄD ELEKTROTECHNICZNY, ISSN 0033-2097, R. 95 NR 1/201 [26] Thi N., Yen H., Hongkun C., Ngoc L., Study on VSC-HVDC grid topology of offshore wind farms. Cluster Comput., 2018, vol. 1.
Authors: Dr. Saheed Lekan Gbadamosi, Dept. of Electrical & Electronics Engineering Science, University of Johannebsurg, Johannesburg, Auckland Park Campus, South Africa. E-mail: gbadamosiadeolu@gmail.com; Prof. Nnamdi. I Nwulu, Dept. of Electrical & Electronics Engineering Science, University of Johannebsurg, Johannesburg, Uckland Park Campus, South Africa. E-mail: nnwulu@uj.ac.za; Dr. O.M. Babatunde, Dept. of Electrical & Electronics Engineering, University of Lagos, Nigeria. E-mail: olubayobabatunde@gmail.com.
Source & Publisher Item Identifier: PRZEGLĄD ELEKTROTECHNICZNY, ISSN 0033-2097, R. 97 NR 4/2021. doi:10.15199/48.2021.04.26
Published by Marian HYLA, Silesian University of Technology, Department of Power Electronics, Electrical Drives and Robotics. ORCID: 0000-0001-6466-7398
Abstract. The paper presents the problems of the influence of a high power thyristor hoisting machine on the mine’s power supply grid. The results of the real object measurements when the machine is powered from a 12-pulse rectifier with common, symmetrical firing angle control are presented. A comparative analyses were carried out in terms of reactive power and higher harmonics for symmetrical and asymmetric firing angle of thyristors based on simulation tests. The influence of the rectifier control method on the operating conditions of the automatic reactive power compensation system was indicated. Practical aspects, not included in the simulation model, have been emphasized.
Streszczenie. W artykule zaprezentowano zagadnienia wpływu tyrystorowej maszyny wyciągowej dużej mocy na sieć zasilającą kopalni. Przedstawiono wyniki pomiarów na obiekcie rzeczywistym przy zasilaniu maszyny z 12-pulsowego prostownika o sterowaniu symetrycznym wspólnym. Przeprowadzono analizę porównawczą pod kątem mocy biernej i wyższych harmonicznych dla symetrycznego oraz asymetrycznego kolejnościowego sterowania tyrystorów na podstawie badań symulacyjnych. Wskazano wpływ metody sterowania na warunki pracy systemu automatycznej kompensacji mocy biernej. Zwrócono uwagę na aspekty praktyczne, nie uwzględnione w zastosowanym modelu symulacyjnym. (Kompensacja mocy biernej w sieci 6 kV z 12-pulsową tyrystorową maszyną wyciągową)
Keywords: hoisting machine, thyristor rectifier, asymmetric control, reactive power compensation Słowa kluczowe: maszyna wyciągowa, prostownik tyrystorowy, sterowanie asymetryczne, kompensacja mocy biern
Introduction
The purpose of reactive power compensation is to relieve the electric grid from the flow of reactive currents. This is achieved by eliminating the phase shift between the fundamental harmonics of the current and voltage and the elimination of higher harmonics of the load currents, regardless of the shape of the supply voltage [1, 2].
In practice, there are many definitions of reactive power [3-5]. In industrial power grids partial compensation is usually applied. It consists in the compensation of the fundamental current harmonic in order to keep the value of the power factor within acceptable limits, and thus – to limit active power losses and voltage drops in the supply lines. The higher harmonics content in the load current are limited by means of passive higher harmonic filters, which are also the source of the capacitive reactive power of the fundamental harmonic. With partial compensation as reactive power sources capacitor banks, passive higher harmonic filters and synchronous compensators, both in the form of unloaded synchronous machines and underloaded synchronous motors or generators are used.
Solutions enabling the compensation of higher harmonics currents through the use of active filters, usually together with appropriately selected set of passive filters, are more and more often implemented [6-11].
With variable loads on the mains due to the operation of multiple loads, central automatic reactive power compensation systems are used to maintain the proper power parameters both at the plant supply point and at selected points of the grid. Automatic reactive power compensation is of particular importance in mining plants where the parameters of the power grid are constantly changing due to changes in its configuration, progress of work in excavations and work organisation.
Hoisting machines are one of the most important electricity consumers in underground mining due to their relatively high power output. The hoisting machines are driven either by AC or DC motors. In Polish mines, DC drives powered by 12-pulse thyristor rectifiers are the most common at present.
Hoisting machines, are restless loads, characterised by continuous load changes during a relatively short duty cycle, which makes them a source of numerous disturbances in the plant’s power grid, such as e.g. fast changing voltage fluctuations. Thyristor rectifiers of the drives are sources of higher harmonics of the variable current [6, 12]. High power surges, especially at start-up, significantly affect the power quality and operating conditions of automatic reactive power compensation systems and are difficult to compensate without active filters.
In addition to the technical aspects, there are also important economic aspects connected with noncompliance with the relevant parameters of power quality at the plant supply points. Failure to maintain the power quality parameters by consumers at the plant supply points, especially the power factor tgφ, results in additional charges being billed by power distribution companies. In order to reduce electricity costs, reactive power drawn from the grid at each of the plant’s supply points should be properly compensated.
The paper considers the possibilities of improving the operating conditions of an automatic reactive power compensation system in a grid with a thyristor hoisting machine by changing the way the thyristors of the rectifier supplying the machine are controlled. The effect of the control change on the generation of higher harmonics of the current was also considered.
Research facility
The object of the research was a skip hoisting machine driven by the separately exited 3.9 MW DC motor with the nominal rotational speed of 76.4 rpm and the driving wheel with the diameter of 5 m. The motor is powered by the 12-pulse rectifier.
Fig.1 shows the time waveforms of active and reactive power on the secondary side of the 110/6 kV transformer at the plant’s supply connection point. The transformer supplies the system from which the hoisting machine is powered. The sampling frequency of the measurements does not allow to present the real shapes of the power waveforms, especially the active and reactive power surges during the operation of the hoisting machine. It can be observed, however, that there are no large cyclic load changes during the hoisting machine off-duty period (13-17 min.). The changes occurring outside this period are mainly due to the cyclic operation of the hoisting machine.
Fig.1. Active and reactive power waveforms on the secondary side of a 110/6 kV supply transformer
Each cycle of the hoisting machine consists of three phases: start-up, steady running and braking [13]. Between the cycles there is an off-duty period to load and empty the skips. The speed control of the thyristor machine is achieved by changing the thyristor firing angle according to the so-called driving diagram taking into account the permissible accelerations and decelerations and speed stabilisation during the steady running. From the point of view of the influence on the grid, the most disadvantageous part of the diagram is connected with the start-up of the machine. This is when the highest level of reactive power consumed by the drive system occurs.
Fig.2 shows the active and reactive power waveforms recorded at the supply point of the hoisting machine during a single cycle of operation. It can be seen that the active power surge during the start-up reaches almost 6 MW, and the reactive power surge exceeds 6.5 MVAr. Such large and relatively fast load changes are difficult to compensate for in an automatic reactive power compensation system without the use of active filters of sufficient power.
Fig.2. The hoisting machine active and reactive power waveforms during a single cycle of operation
The shape of the waveforms shown in Fig.2 is related to the driving trajectory and the motor load. The shape of the waveforms and values of the reactive power are additionally influenced by the control of the 12-pulse thyristor rectifier. The characteristic shape of the reactive power waveform during the start-up of the hoisting machine indicates the symmetrical control of both 6-pulse rectifiers which are the parts of 12-pulse rectifier supplying the hoisting machine motor.
Control of a 12-pulse rectifier
Fig.3 shows a schematic diagram of a 12-pulse rectifier consisting of two 6-pulse rectifiers connected in series on the DC side.
These 6-pulse rectifiers are supplied from separate converter transformers with appropriate connection groups allowing the voltage on the secondary side to be shifted by an angle of 30°.
Fig.3. Schematic diagram of the 12-pulse rectifier supplying the hoisting machine
Symmetrical (common, simultaneous) control is based on the same thyristors firing angle in both 6-pulse rectifiers, one of which is supplied from a transformer with connection group Y/Δ and the other from a transformer with connection group Y/Y, i.e.
A 12-pulse rectifier controlled in this way generates higher harmonics current of the order of
.
where: n =1, 2, 3…
The supply current to the 12-pulse rectifier is equal to twice the current drawn by each of the 6-pulse rectifiers, and the fundamental harmonic reactive power drawn by the 12-pulse rectifier is equal to twice the reactive power drawn by each of the compound 6-pulse rectifiers.
In order to reduce the reactive power consumed by the 12-pulse rectifier, an asymmetrical sequential control of the thyristors can be used [8, 10, 14, 15]. The idea of an asymmetrical sequential control of a 12-pulse rectifier is presented in Fig.4.
Fig.4. Idea of an asymmetrical sequential control of a 12-pulse rectifier
The sequential control consists in firing the thyristors of one of the 6-pulse rectifiers with a fixed angle, and the other 6-pulse rectifier thyristor firing angle is changed to obtain the desired voltage on the DC side. For rectifier operation
.
or
.
and for inverter operation
.
or
.
In Fig.2 only the rectifier operation of the hoisting machine converter occurred in presented cycle.
The sequential control results in an increase of the current higher harmonics in the grid. A 12-pulse rectifier controlled in this way generates current higher harmonics characteristic of both a 12-pulse and a 6-pulse rectifier with values dependent on instantaneous thyristor firing angles.
The maximum reactive power of the fundamental harmonic is less than twice the maximum reactive power consumed by each 6-pulse rectifier, i.e. less than the maximum reactive power consumed by a rectifier with symmetrical control. In practice, due to the limitation of the minimum and maximum the thyristors firing angle, the asymmetric control allows to reduce the reactive power consumption by about 25% [13].
In high power drive systems, asymmetrical sequential control is often preferable, allowing a reduction in reactive power at the expense of generating additional current higher harmonics, especially of orders 5 and 7.
Simulation researches
A complete Matlab-Simulink simulation model of a thyristor hoisting machine is presented in [16]. For the presented research the simplified model shown in Fig. 5 was used.
The simplified simulation model does not take into account the reversible operation of the machine. It was assumed that the motor excitation winding was supplied with the rated current. It was also assumed that the drive system will be powered from a stiff power grid. The motor current was limited to the rated value. It was also assumed that the 12-pulse rectifier will operate only in the rectifier operating area, at αY=αmin=30°.
The simulation model in Fig.5 corresponds to the sequential control of the rectifier. For symmetrical control simulations, the Y Pulse Generator block is eliminated, and the signal from the PY output of the D Pulse Generator block is connected to the g inputs of the YThyrystor Converter block.
Fig.5. Simulation model of a hoisting machine with a sequentially controlled a 12-pulse rectifier
The speed setting is performed in the Speed set block according to the trajectory shown in Fig.6 [13].
Fig.6. Diagram of the speed variation of a single hoist machine cycle
The fixed steady state speed is 16 m/s. During starting and breaking, the maximum speed during entry and exit of the skips from the cams is limited to 1.5 m/s. The acceleration to the fixed speed is 0.8 m/s2, and the deceleration during braking is 1 m/s2.
The simulation experiments were performed for identical working conditions and controller settings in a system with symmetrical and asymmetrical/sequential control of the thyristors in the rectifier. Due to the ratio of the simulation time to the integration step associated with the thyristor switching, the periods of fixed speed driving were shortened. In Fig.7-8 the waveforms of active and reactive power during the cycle of the hoisting machine are shown.
Assuming, based on the measurements in Fig.1, that during an off-duty period of the hoisting machine the average active power of the other loads supplied from the 110/6 kV transformer is 3.5 MW, and the average reactive power is -0.25 MVAr (capacitive reactive power), the waveforms of the power factor tgφ at the secondary side of the supply transformer were determined for both control methods and are presented in Fig.9.
The change in reactive power required to compensate the system for a given power factor tgφ can be determined from the relationship
.
where: ΔQ – required reactive power change, P, Q – current instantaneous value of active and reactive power at the plant’s supply point, tgφz – set value of power factor at the plant’s supply point.
Fig.7. Active power during the single cycle of the hoisting machine operation: a) symmetrical control, b) sequential control
Fig.8. Reactive power during the single cycle of the hoisting machine operation: a) symmetrical control, b) sequential control
Fig.9. Power factor tgφ on the secondary side of the 110/6 kV supply transformer during the single cycle of the hoisting machine operation: a) symmetrical control, b) sequential control
Fig.10. Reactive power that requires compensation after exceeding the permissible range of the power factor tgφ during the single cycle of the hoisting machine operation: a) symmetrical control, b) sequential control
Assuming that the allowable power factor tgφ at the plant’s power supply point should be within the range of 0- 0.4, the waveforms of the reactive power remaining to be compensated after exceeding the allowable range were determined and are presented in Fig.10.
As can be seen from the waveforms obtained from the simulation tests, changing the thyristor control from symmetrical control to sequential control reduces the reactive power consumed by the hoisting machine drive and gives better conditions for the compensation of the plant’s power grid by the automatic reactive power compensation system.
Higher harmonics
The reduction of the reactive power consumed by the rectifier supplying the hoisting machine motor after the change of thyristor control to sequential control is accompanied by the presence of additional higher harmonics of the current consumed by the rectifier.
Based on the rectifier supply current waveform obtained during simulation, an analysis of the higher harmonics of the current drawn by the machine was performed for both control methods. The period of acceleration to a steady fixed speed and steady driving after the transition processes were considered. In Fig.11 the content of characteristic current higher harmonics is shown, and in Fig.12 a comparison of the current THD coefficient is presented. The symbol * denotes the speed during steadystate operation. The content of current higher harmonics at sequential control for different firing angles can also be determined from analytical relations presented in the work [17].
Fig.11. The content of characteristic current harmonics during acceleration and fixed speed operation (*) of hoisting machine: a) symmetrical control, b) sequential control
Fig.12. Values of the current THD coefficient during acceleration and fixed speed operation (*) of the hoisting machine: a) symmetrical control, b) sequential control
On the basis of the analysis of the content of current higher harmonics, it can be observed that with symmetrical control the 11th harmonic is dominant, and during acceleration, i.e. with the change of the firing angle of the thyristors, the values of individual harmonics and THDi practically do not change.
With sequential control, additional harmonics appear (especially 5 and 7, but also 17 and 19) and their values are variable and depend on the thyristors’ firing angle. The current THD coefficient also changes with the firing angle of the thyristors and is greater than that obtained with symmetrical control over the entire considered range of operation.
Simulation studies were carried out with full symmetry of the supply voltage. Due to the sensitivity of multi-pulse systems to asymmetry or distortion of the supply voltage [12], in practice, in power grids with many unstable high power loads, an increase in the content of higher harmonics above the values determined in the simulations should be expected, as well as the appearance of uncharacteristic harmonics of the 5th and 7th order in symmetrical control. For this reason, passive 5th and 7th, and often also 11th and 13th harmonic filters are used when supplying high power loads, even in systems with symmetrical control [18].
Summary and conclusions
The paper presents a comparative analysis of the impact on the power grid of a 12-pulse rectifier supplying a high power thyristor hoisting machine with two methods of controlling the converter thyristors: symmetrical and sequential (asymmetrical). The influence of the control method on the reactive power consumed by the machine and the content of current higher harmonics was shown.
In Polish underground mines, high power thyristor hoisting machines drives are powered by 12-pulse rectifier systems with symmetrical control. The change to sequential control makes it possible to reduce reactive power surges caused by the machine drive system. This change, however, requires that the passive higher harmonic filters be adapted to the new operating conditions, in particular of the 5th and 7th order, in order not to overload them.
Due to the power quality requirements set by the electricity distributors and the technical aspects related to the influence of thyristor hoisting machines on other devices in the company’s internal power grid, the aim is to reduce their impact on the grid as much as possible. However, economic aspects relating to the cost-effectiveness of the modernisation of systems must also be taken into account.
At present, mining plants pay special attention to the possibility of eliminating or reducing the penalty fees charged by power distributors in connection with failure to meet power quality parameters at the plant supply point. In Poland, penalty charges are mainly related to noncompliance with the contracted power factor tgφ at the point of connection to the power grid. For this reason, great attention is paid to the correct operation of automatic reactive power compensation systems.
Reducing the reactive power surges caused by thyristor hoisting machines significantly improves the ability to maintain the power factor at the plant’s supply point within the permissible range, thus minimising the penalty charges associated with exceeding the power factor required by the power distributor.
REFERENCES
[1] Dixon J., Moran L., Rodriguez J., Domke R.: Reactive Power Compensation Technologies: State-of-Art Review, Proc. of the IEEE. vol.93. no.12, 2005, pp.2144-2164 [2] Igbinovia F. O., Fandi G., Švec J., Müller Z., Tlusty J.: Comparative review of reactive power compensation technologies, 16th International Scientific Conference on Electric Power Engineering (EPE), 2015, pp.2-7, doi: 10.1109/EPE.2015.7161066 [3] Fryze S.: Active, reactive and apparent powers in nonsinusoidal systems (in Polish), Przegląd Elektrotechniczny, no.7/1931, pp.193-203 [4] Ortega J. M. M., Payan M. B., Mitchell C. I.: Power factor correction and harmonic mitigation in industry, Industry Applications Conference, 2000. Conference Record of the 2000 IEEE, Rome, 2000, vol.5, pp.3127-3134, doi: 10.1109/IAS.2000.882612 [5] Balci M. E., Hocaoglu M. H.: Comparison of power definitions for reactive power compensation in nonsinusoidal conditions, 11th International Conference on Harmonics and Quality of Power, 2004, pp.519-524, doi: 10.1109/ICHQP.2004.1409408 [6] Matyjasek Ł., Matyjasek K.: Power factor correction systems for mining hoists with special consideration of STATCOM systems, (in Polish) The Scientific Papers of Faculty of Electrical and Control Engineering Gdańsk University of Technology, vol.67, JDEE Scientific – Technology Conference Power Quality of Electricity Supply – joint responsibility of producers, distributors, consumers and prosumers, 2019, pp.153-157, doi: 10.32016/1.67.31 [7] Pogorelov A. V.: Improving Filter-Compensating Devices in Power Supply Systems of Mine Hoists, 2019 International Multi-Conference on Industrial Engineering and Modern Technologies (FarEastCon), 2019, pp.1-4, doi: 10.1109/FarEastCon.2019.8934157 [8] Ahsan F. M., Chatterjee J. K., Das A.: Operation of a 12-pulse converter in closed loop for controlled P-Q operation, 2006 International Conference on Power Electronic, Drives and Energy Systems, 2006, pp.1-6, doi: 10.1109/PEDES.2006.344236 [9] Po-Tai Cheng, Bhattacharya S., Divan D. M.: Application of dominant harmonic active filter system with 12 pulse nonlinear loads, IEEE Transactions on Power Delivery, vol.14, no.2, pp.642-647, April 1999, doi: 10.1109/61.754112 [10] Modi P.S., Joshi S. K.: New combined Hybrid active filter for twelve pulse converter operating under asymmetrical operation, AUPEC 2011, 2011, pp.1-6 [11] Płatek T., Cichomski P., Baranecki A., Biernacik T.: Hybrid system for power factor passive power compensation for supply system of hoisting machine in coal mine, (in Polish), Przegląd Elektrotechniczny, no.10/2014, pp.236-241, doi: 10.12915/pe.2014.10.56 [12] Gała M., Jagieła K., Kępiński M., Rak J.: Influence of high power DC converters drives on operating parameters of induction machines, (In Polish) Zeszyty Problemowe – Maszyny Elektryczne, no.76/2007, KOMEL, 2007, pp.35-40 [13] Siostrzonek T., Chmielowiec K., Piątek K., Dutka M. Firlit A.: The use of multi-pulse systems in the power supply of hoisting machine drives to improve voltage parameters in mining plants, 2020 12th International Conference and Exhibition on Electrical Power Quality and Utilisation- (EPQU), 2020, pp.1-6, doi: 10.1109/EPQU50182.2020.9220301 [14] Das A., Chatterjee J. K., Gaja A. K.: Asymmetrical firing of 12-pulse converter for controlled P-Q operation using PIC microcontroller, 2006 IEEE Power India Conference, 2006, pp.5 doi: 10.1109/POWERI.2006.1632602 [15] Modi P. S., Joshi S. K.: Effect of source inductance on controlled var operation of 12- pulse converter, 2009 International Conference on Control, Automation, Communication and Energy Conservation, 2009, pp.1-7 [16] Pogorelov A. V.: Simulation modeling of DC electric drive for mine hoist, IOP Conference Series: Materials Science and Engineering, 2019, vol.643, pp.1-7, doi: 10.1088/1757-899x/643/1/012037 [17] Hamad M. S., Masoud M. I., Massoud A. M., Finney S. J., Williams B. W.: A new power locus for the p-q operation of series connected 12-pulse current source controlled converters, 2008 IEEE Power Electronics Specialists Conference, 2008, pp.2264-2270, doi: 10.1109/PESC.2008.4592278 [18] Hyla M.: Higher harmonics filtration in the power supply system of thyristor hoisting machine of shaft transport in a mining plant, Przegląd Elektrotechniczny, no.5/2022, pp.43-48, doi: 10.15199/48.2022.05.08
Autor: dr inż. Marian Hyla, Silesian University of Technology, Faculty of Electrical Engineering, Department of Power Electronics, Electrical Drives and Robotics, ul. B. Krzywoustego 2, 44-100 Gliwice, Poland, e-mail: marian.hyla@polsl.pl
Source & Publisher Item Identifier: PRZEGLĄD ELEKTROTECHNICZNY, ISSN 0033-2097, R. 98 NR 9/2022. doi:10.15199/48.2022.09.11
Published by Simon Mugo, EE Power – Technical Articles: 6 Techniques for Controlling Harmonic Distortion, May 15, 2023.
Harmonics–currents or voltages at a multiple of the power systems’ fundamental frequencies– originate from non-linear loads in power systems. This article will introduce six techniques necessary to reduce harmonic distortion.
The earliest method of controlling problems associated with harmonics involved the use of a single-tuned filter which offered a lower impedance path for the harmonic currents. Interestingly, finding a harmonic-producing load in the range of megavolt-ampere in industries that operate without harmonic filters is not difficult. Large producers of harmonics in the industrial sector may still adopt traditional harmonic filtering methods to control the disturbances that arise beyond the system’s metering point that affect sensitive processes and equipment. These filtering methods are not cost-effective for residential and commercial facilities. This article looks at the techniques that can be used to control harmonics and reduce the distortion harmonics cause on the signal flowing in power systems.
1. Network Reconfiguration
Network reconfiguration is one of the measures that can help reduce harmonics. This process starts by identifying the users or sectors that produce a lot of harmonic current to the power system and categorizing them according to the characteristics of the frequency content.
Suppose the use of harmonic filters is not a consideration. In that case, mixing both linear and non-linear electric loads on the feeder can reduce harmonic distortion since linear load works as a natural attenuator controlling the parallel peaks of the resonant.
The top objectives of network reconfiguration include:
• Minimizing network power loss • Minimizing network voltage sag during switching or faulting • Minimizing node voltage harmonic distortion • Minimizing system unbalance
The branch exchange technique is employed during network reconfiguration. This is a design technique where an unenergized tie branch is introduced in the power network. This is demonstrated in Figure 1 below.
Figure 1. Before and after configuration diagram. Image used courtesy of Simon Mugo
Power to node n was flowing through path pqr previously and after configuration, the power path changes to path pst. the advantage of this technique is the automatic maintenance of the radial configuration and no calculations are required to fulfill the purpose.
2. Increase Supply Mode Stiffness
Increasing the ratio between the present short-circuit and the rated load currents mean a more substantial electric supply node. This is common when power suppliers increase the size of their power substations. It also happens when large power consumers like industrial clients add other supportive cogeneration on the main supply bus to improve the peak demand during operations.
The ratio between the short circuit and the load current gives us the source stiffness of the power system. A stiff AC supply increases the chances of short-circuit current being available.
With a strong supply node, be assured that you have a better chance of absorbing transient disturbances present in the network and help attenuate the effects of the large inrush currents of the transformer, cable energizing, and large motor loads starting.
With high short-circuit currents, expect low impedance sources, which in turn form an inverse function of the size of the transformer. We can illustrate this by computing the impedance change when an old worn-out transformer-rated MVA1 is substituted with a new transformer-rated MVA2.
By using the transformer impedance fundamental expression
.
We end up with
.
Assuming that all the parameters in the equation are the same reduces the equation above to:
.
This equation gives us the impedance ratio for how the new transformer to the old transformer varies. For example, a 60-MVA transformer will give an impedance twice as smaller as a transformer of 30-MVA will give and increase the short-circuit by double, where the assumption is that the two transformers suffer the same leakage current problem.
At the harmonic frequency, capacitive and inductive impedances of the power system vary according to the frequency function.
For the inductive load
.
For the capacitive load
.
Inductive components of the power system are primarily affected by a stiffer power source. Harmonic currents generate a voltage drop that is affected by the system’s inductive reactance, which is made of the feeder and the components of the substation.
For short feeders, the dominant component is the source impedance. In such situations, expect harmonic currents to reach the system’s substation creating harmonic distortion. With stiffer systems, expect smaller harmonic distortion.
3. Adding Multi-pulse Converters for Harmonic Cancellation
Here, we can employ half-wave and full-wave rectifiers. For half-wave rectification, it produces the DC output that saturates a transformer, and this can be limited by the use of full-wave rectification.
Six-pulse unit is the most basic available polyphase converter. 12-pulse unit is used to eliminate harmonics of a lower order that is 5th and 7th.
Figure 2 below is a pulse converter connection.
Figure 2. Pulse converter connections. Image used courtesy of Simon Mugo
If you want to reduce other harmonic currents, you carry out a phase multiplication. For example, a 24-pulse unit is constructed from a combination of four-six pulse full-wave rectifier bridges, each having a 15 degrees phase shift as compared to other rectifying units. This is made possible by utilizing phase-shifting transformers that separate the additional windings that are connected in a zig-zag. See Figure 3 below.
Figure 3. Pulse converter connection. Image used courtesy of Simon Mugo
See the following conditions for harmonic elimination using a six-pulse rectifier:
• Transformers used in the connection have the same leakage impedances and transformation ratio. • The load is divided into equal parts among the available converters • All converters have similar firing angles •The difference in phase between transformers is 60/N degrees, where N is the number of sections
The equation for the characteristic harmonic reduction can be written as
h = kq±1
where
h is the systems harmonic order, N is the available number of the six-pulses rectifier, q is 6×N and K is an integer given by 1,2,3,…..,n
4. Series Reactors
In industries, series reactors have been incorporated into the control of short circuits for a long time. They are used in smelting industries, power substations, and steel plants. Sometimes in industries, the series reactors are perfectly used in attenuating harmonics.
The current waveforms that are nonlinear have harmonic distortion. Introducing line reactors limits the number of inrush currents moving into the drive rectifiers. This reduces the peak current, rounds off the waveform, and minimizes the harmonic distortion. the distortion of the current is reduced to approximately 30%. If the current distortion is severe, it also distorts the system powering voltage. If the system drains too much harmonic current, it causes a flat topping on the waveform of the voltage. Introducing a reactor is a way of controlling the composition of the current, and this way, the harmonic distortion occurring on the voltage is reduced. See Figure 4 below.
Figure 4. Series and shunt compensated transmission system. Image used courtesy of MathWorks
5. Phase Balancing
Variations in the single-phase electric loads can lead to an imbalance of current in the three-phase conductors, creating a dissimilar drop in the voltage, which induces an unbalanced phase-to-phase voltage.
This unbalanced phase-to-phase voltage is hazardous to the distribution feeder, especially when there are poor measures for compensation of the stray voltage. A perfectly balanced system is hard to attain but always try as best to balance the phases, which reduce harmonics.
Phase Voltage Unbalance
To determine the unbalance voltage most efficiently, you need to know how to calculate it.
Start by calculating the deviation using the formula below:
.
If the system operates under an unbalanced phase, the following will happen:
• Overheating of the cables due to unbalanced line currents. • Unprotection of the MCB, MCCB, fuses, etc. • Faults in the underground cables.
Phase balancing leads to uniform distribution of the load across the three-phase power lines of the system. If the system is unbalanced, there will be wrong utilization of the feeder capacitor for the system’s future load demand. With good current balancing, there will be the eradication of the extra current stress on the overloaded line or phase and placed on the underloaded line or phase, thus creating room for future demand. The phase balancing also improves the system’s feeder capacity and voltage quality and reduces losses. See Figure 5 below, a diagram for a basic balanced three-phase power.
Figure 5. Basic balanced 3-phase power. Image used courtesy of Simon Mugo
6. Load Grouping
Too many electric networks may come with nonlinear loads that contain different spectral content. Grouping these loads to classes made of a similar harmonic spectrum helps optimize the location, installation, sizing, and selection of the harmonic filters.
Several electricals can exist in a circuit network resistive loads, inductive loads, and capacitive loads, all having different levels of harmonics introduction into the power systems. All these loads find use in various sectors. In domestic or residential loads, modest power is consumed. Commercial, industrial, and municipal loads are other areas where electricity is utilized. All these areas consume power of different harmonics and can be classified to help reduce how harmonic from one sector is spread to the other.
We have different loads consuming different types of voltages. Some consume 208 V, others 120 V, some 240 V, and so on, and these loads have to be grouped well. See the voltage consumption system in Figure 6 below, which has different power loading.
Figure 6. 120/240 V, 3-phase, 4-wire, open-delta system. Image used courtesy of Simon Mugo
Takeaways of Reducing Harmonics
The article has introduced the six techniques engineers can employ to minimize harmonics in power systems. They include:
• Network reconfiguration helps reduce harmonics, which is the process where the users that produce large harmonics are identified and categorized according to the type of harmonics they produce.
• An increase in supply mode stiffness means a more robust electric supply node which is the ratio between the short circuit and the load current. The stiffer the AC means a higher probability of short circuit availability.
• Adding multi-pulse converters for harmonics cancellation through the employment of half and full-wave converters helps eliminate harmonics. Here six-pulse is the most available polyphase converter.
• Series reactors minimize harmonics in smelting and steel plants.
• Phase balancing is another method suitable to minimize harmonics. Remember unbalanced phase is a source of harmonic.
• Load grouping is where similar loads are placed together. Nonlinear loads with different spectral content are available in electrical systems, and grouping these loads helps select and size harmonic filters.
Author: Simon Munyua Mugo is a Mechatronic Technical Tutor and Head of Research and Innovation at Mumias West Technical and Vocational College, Kenya. He has a Bachelor of Science in Mechatronic Engineering from Dedan Kimathi University of Technology, Kenya.
Published by Marek JAWORSKI, Politechnika Wrocławska, Katedra Energoelektryki ORCID. 0000-0002-6537-050X
Abstract. The article presents issues related to choosing an overhead line route in the aspect of landscape protection. The possibility of using nonstandard supports, which task is to replace traditional electricity pylon and better integration into the surrounding landscape, was pointed out. The paper describes the advantages and disadvantages of such constructions, including compact overhead lines with special insulation cross-arms. Calculations of electric and magnetic field distributions in the vicinity of several selected supports of this kind were carried out and compared with field distributions in the vicinity of a traditional electricity pylon. The areas of the electric and magnetic components of the field for various supports of the line were determined.
Streszczenie. W referacie przedstawiono zagadnienia związane z wyborem trasy linii napowietrznych w aspekcie ochrony krajobrazu. Wskazano na możliwość zastosowania niestandardowych konstrukcji wsporczych, których zadaniem jest zastąpienie tradycyjnych słupów kratowych oraz lepsze wkomponowanie w otaczający krajobraz. Opisano wady i zalety takich konstrukcji, w tym kompaktowych linii napowietrznych ze specjalnymi poprzecznikami izolacyjnymi. Przeprowadzono obliczenia rozkładów pola elektrycznego i magnetycznego w otoczeniu kilku wybranych tego rodzaju konstrukcji wsporczych oraz porównano je z rozkładami pola w otoczeniu słupów kratowych. Określono obszary odziaływania składowej elektrycznej i magnetycznej pola dla różnych konstrukcji wsporczych linii najwyższych napięć. (Niestandardowe rozwiązania konstrukcji wsporczych linii napowietrznych wysokiego napięcia w aspekcie ochrony krajobrazu oraz oddziaływania pola elektromagnetycznego)
Keywords: overhead power lines, supports, electromagnetic fields, exposure, landscape Słowa kluczowe: linie napowietrzne, konstrukcje wsporcze, pole elektromagnetyczne, oddziaływanie pola, krajobraz
Introduction
Over the past 20 years, Poland’s energy consumption has increased by over 23%, and its generation by just over 14%. The upward trend in energy production continued until 2018 and amounted to 165,21 TWh. In the same year, the electricity demand exceeded the value of 170 TWh for the first time [1]. In 2020, a decrease in production was recorded to 152,3 TWh while consuming 165,5 TWh of energy.
The highest voltage transmission networks (400 and 220 kV) should be prepared for connecting new generation sources, including offshore wind farms, or integration within the common European electricity market. Recently adopted regulation, the “Clean Energy for all Europeans” package [2], sets ambitious standards, defining required transmission capacity levels for cross-border exchange. Meeting these standards requires European operators to develop national networks.
The transmission network of the national transmission system operator (PSE S.A.) at present has a little over 15300 km long. Most transmission lines were built in the 1970s and 1980s. Over the past 15 years, the number of 400 kV lines increased by 63%, but at the beginning of 2021, the length of all these lines per circuit was 7822 km. Some 400 kV transmission lines can still be used for several years, but in the case of 220 kV lines (with a total length of 7380 km), this time is short. Therefore, they require urgent modernization and reconstruction to 400 kV. The need to expand the network also results from new generation sources construction, mostly renewable (RES) and so-called intervention sources.
In 2020-2030, PSE SA intends to implement one of the most ambitious investment programs in Europe in electricity transmission infrastructure. It intends to spend 14 billion PLN for this purpose, of which about 90 per cent will cover the expansion and modernization of the network. As a result of the plan’s implementation, over 3500 km of new high-voltage networks will be built over the next nine years, and over 1600 km of existing lines will be modernized [3].
Construction of overhead transmission lines in the aspect of landscape protection
The investment process, that goal is to build a transmission line, begins a thorough technical and economic study, in the course of which the basic parameters of the line are determined, which are essential for the smooth functioning of the power system: transmission capacity, voltage and line work system (single-circuit, double-circuit or multi-circuit line). The mentioned parameters are subject to a detailed analysis during the forecasting works, mainly from the economic and reliability point of view. In Poland, under the current conditions (high power transmitted over considerable distances), new transmission lines are built for 400 kV voltage. In addition, 1200 kV lines (experimental section of the line in India) and 1000 kV lines (640 km long line with 3000 MW transmission capacity in China) are being built worldwide [4].
The electromagnetic field’s impact and noise generated by an overhead line can be estimated before being built based on computer simulations. At the design stage, however, it is challenging to assess whether and to what extent the overhead line will reduce the value of the landscape, the more so because the personal feelings of individual people are subjective in this respect and often differ significantly from each other. Landscape protection is understood as a resource of visual and aesthetic values resulting from natural factors. Human activity is one of the most important tasks undertaken as part of spatial planning. According to the European Landscape Convention [5], the landscape is one of the essential elements shaping people’s quality of life, so it must be adequately protected and shaped. Aesthetic assessment of the landscape, however, is subjective and unverifiable. One person’s perception of the scenery may change depending on the time of day or atmospheric conditions. It may evolve or depend on tight to define mood swings, which was fully confirmed by the study’s findings [6]. In the visual assessment of the landscape, it is also significant to determine the assessment’s subject. Landscape can be understood as a specific view or area with defined boundaries containing many views. Despite the methodological difficulties, there have been more or less successful research attempts to evaluate geographical space aesthetics and visual attractiveness for years. One of them is the valorization of assessing Polish mesoregions’ visual attractiveness based on the assessment of the relief, surface water, and vegetation [7].
The use of overhead high voltage lines has been and remains the dominant way of transmitting electricity. Overhead transmission lines have permanently become surroundings part and a widespread element of the cultural environment, both in Poland and worldwide. Despite this universality, overhead line pylons are considered a spatial element that reduces protected areas’ landscape values to the greatest extent [6]. They are also usually the worst-rated anthropogenic element of the cultural landscape. These steel traditional electricity pylons with heights from 30 m (Y25, F series) to about 80 m (E33 series), visible from a distance of several kilometres, affect the landscape quite negatively.
This article presents several custom support structures that are already or may be used to construct new overhead power lines. In addition, the levels of electric and magnetic fields produced by such lines were also assessed and compared with the values of fields generated in the vicinity of existing overhead lines. The application of these innovative solutions may, according to the author, lead to increased social acceptance during the construction of overhead lines.
Innovative solutions for supports of overhead lines
Over the past dozen or so years, many innovative support structure designs have been created to construct overhead lines. These issues became the topic of meeting representatives of 17 countries as part of the CIGRE Studies Committee. The B2-08 Working Group’s work ended with the publication in February 2010 of the CIGRE TB Technical Brochure No. 416 [8] and a 64-page annexe a few months later [9]. The publication [9] presents numerous photos of non-standard support structures erected in Denmark, Finland, France, and Iceland, which were supposed to be more visually attractive and better blend in with the surrounding landscape. Notably, the works of a Danish architectural and design company founded in 1994 by Erik Bystrup [10]. The company’s projects focus on aesthetics, functionality, economics, and ecology. In 2001, a structure called Design Pylon (Fig. 1a) designed by Bystrup received the first prize in an international competition organized by Energinet – the Danish national operator of the electricity and natural gas transmission system. In 2006, a 27-kilometre section of the overhead line was built in Denmark using 80 Design Pylon poles. The advantage of these columns was to limit visual interference in the landscape. The pole has been reduced to a few simple elements, and the pole’s height does not exceed 31.5 m.
Another solution for the double-circuit line is Eagle pylon designed by Bystrup (Fig. 1b). It uses Eagle series columns that a double-circuit 400 kV line with a length of approx. 175 km was built in Denmark in 2014, which replaced the singlecircuit line. This line now forms the mainstay of the Danish transmission network, connecting Germany with Norway and Sweden.
The Bystrup company offers a range of other support designs. These include Sky Pylon, that surface is clad with polished stainless steel [10,11]. Therefore, the pole blends into the surroundings and reflects the landscape, sky, and light. In addition, reducing the distance to 6 m between the phases enabled the pole’s design in which all phases are suspended in one horizontal plane, and its height does not exceed 29.1 m.
A few years ago, Bystrup’s research and development team designed a pylon to introduce a new transmission line industry era. The pylon is made entirely of composite materials with a pair of arms to which two 400 kV lines can be attached [10,11]. The shaft of the pole is attached to a monopole driven into the ground. This pole can be folded in place and erected in one day. Its mass constitutes about 30% of the mass of traditional steel lattice columns. It can be transported by helicopter and set up using light equipment. A 22.5 m high composite pole prototype was created in cooperation with the Danish Technical University and Aalborg University [11].
Fig.1. Scheme of innovative electricity pylons (a) the Design Pylon, (b) the Eagle Pylon, based on data from [10,11]
In 2011, the Royal Institute of British Architects (RIBA), Department of Energy and Climate Change (DECC), and National Grid in the United Kingdom announced a competition to design pylons of the future to replace worn steel supports [10]. The T-Pylon design developed by the Danish company Bystrup won the international competition. The pole is T-shaped and resembles a street lamp (Fig. 2a). The first constructions of these poles were erected in 2015 at the National Grid training academy in Eakring, Nottinghamshire. The approx. 35 m high T-pylon has an estimated service life of 80 years. These poles will be used to construct new overhead lines in Great Britain.
All support structures presented above are based on monopole solutions. However, the experience of Denmark and Great Britain [10] in the construction of such lines and the opinions carried out among the population prove the community’s increased acceptance of the construction of overhead lines with non-standard supports.
Fig.2. Scheme of innovative electricity pylons (a) the T-Pylon, (b) monopole pylon, (c) compact monopole pylon, based on data from [10,11]
Thousands of kilometres of lines have been built around the world using monopole poles. These constructions also appeared in Poland, but mainly in 110 and 220 kV lines. So far, the only 400 kV line made on monopole supports is the Pasikurowice-Wrocław line with a length of about 48 km [12]. On one section, this line was built as a single-circuit 400 kV, and on the other as a three-circuit, 1×400 kV + 2×110 kV.
In European countries, compact lines are often used. Compact lines are those in which the dimensions have been minimized while maintaining all required mechanical and electrical parameters. It became possible due to eliminating traditional pylons’ cross members and their replacement with insulating cross members. Composite insulators made of glass fibre reinforced epoxy resin are most commonly used as insulating elements of the crossbeams. The first crossbar solutions using composite insulators for 400 kV were developed in 1997 by Pfisterer [13]. Pfisterer offers the third generation of insulating crossbars to construct the highest voltage compact lines, which with their parameters, ensure both electrical and mechanical safety for voltages up to 525 kV [13].
Many monopole support designs in the world are made of concrete or steel, adapted to compact lines. One of the suggestions is a pylon called (The Needle) [13].
Calculation of distributions of electric and magnetic fields in the vicinity of 400 kV lines
All the electromagnetic field distributions presented in this chapter have been prepared based on the PolE-M v.1.0.2.0 computer program developed by the article’s author. The algorithm used in the program is based on the superposition and mirroring method.
The PolE-M software enables calculations and distributions of the electric and magnetic field intensity in a cross-section perpendicular to the axis of a line equipped with up to 16 wires. In this way, the electric and magnetic field levels that may occur in the vicinity of overhead lines built using traditional and non-standard supports were checked and compared. The calculations were made for single-circuit 400 kV lines made on Y25, W33, Design Pylon (Fig.1a), and double-circuit 400 kV lines made on E33, T-Pylon (Fig.2a), Eagle Pylon (Fig. 1b), and monopole series support with metal (Fig.2b) and insulating crossbars (Fig.2c).
All calculations have been made for the most unfavourable operating conditions of the power lines. The maximum voltage, the maximum load of the line conductors, and the conductors’ minimum distance from the ground were assumed. In order to be able to compare the obtained field distributions in the vicinity of different lines, the following assumptions were made in the PolE-M program:
• conductors suspension coordinates according to the series and type of pylons,
• minimum distance from phase conductors to earth hmin = 10.0 m (the most common distance between conductors and ground when designing a 400 kV line in Poland),
• maximum line operating voltage Urmax = 420 kV (maximum value of the voltage on the lines of 400 kV,
• for single-circuit lines – steel-aluminium conductors type 2xAFL-8 525 mm2, with a diameter of 3.15 cm and a maximum load of circuit 2500 A,
• for double-circuit lines – steel-aluminium conductors type 3xAFL-8 350 mm2 with a diameter of 2.61 cm and a maximum load of circuit 2500 A,
• for double-circuit lines, the calculations were made for two different phase systems: symmetrical and opposite.
The list of calculated maximum electric and magnetic field strengths that occur in the vicinity of 400 kV single-track lines is in Tab.1, during the corresponding electric field strength distributions in Fig.3a and magnetic field – in Fig.3b. The calculated values were compared with the Polish regulations concerning the protection against the electromagnetic field in the environment.
Table 1. Calculated maximum values of electrical and magnetic field existing in the vicinity of single-circuit 400 kV line
.
Fig.3. The electric field intensity distributions in the vicinity of three 400 kV single-circuit lines, at the most adverse operating conditions of the line (Umax= 420 kV)
Fig.4. The magnetic field intensity distributions in the vicinity of three 400 kV single-circuit lines, at the most adverse operating conditions of the line (Imax= 2500 A)
The list of calculated maximum electric and magnetic field strengths that occur in the vicinity of 400 kV doubletrack lines is shown in Tab.2. Figure 5 shows the distribution of electric and figure 6 – magnetic field strength in the vicinity of lines made on traditional E33 series poles, T-Pylon and Eagle Pylon, with symmetrical phase arrangement.
To show that the distribution of electric and magnetic fields in the vicinity of double-track lines is influenced not only by the type of supports, resulting in a change in the geometry of the distribution of wires, but also by the arrangement of conductors, a series of calculations were carried out for double-track lines built on E33 and monopole pylons (including compact lines).
Table 2. Calculated maximum values of electrical and magnetic field existing in the vicinity of double-circuit 400 kV line
.
Fig.5. The electric field intensity distributions in the vicinity of three 400 kV double-circuit lines, at the most adverse operating conditions of the line (Umax= 420 kV) and symmetrical arrangement of conductors
Fig.6. The magnetic field intensity distributions in the vicinity of three 400 kV double-circuit lines, at the most adverse operating conditions of the line (Imax= 2500 A) and symmetrical arrangement of conductors
Conclusion
The advantage of using non-standard supports is the reduction of visual interference with the landscape. The calculation results show that lower electric and magnetic field strength values occur in the area located under such lines, compared to lines built using standard supporting structures. Considering the population’s fears about the impact of the electromagnetic field accompanying the operation of overhead lines and the loss of landscape values of the area through which the line route runs, it is the lines built using non-standard pylons that may gain greater social acceptance.
Lines made based on non-standard monopole pylons, including compact monopole pylons, generate in their surroundings an electric field with values not exceeding 6.3 kV/m and a magnetic field with values no more than 34.1 A/m. In the vicinity of this type of line, the area where the electric field intensity may exceed the value of 1 kV/m is very narrow and, depending on the pole’s construction, is between 43 and 39 m wide.
Based on the performed calculations, it can be concluded that the conductors’ geometry on the tower structure has a significant impact on the electric and magnetic field distribution under the overhead lines. With the same assumptions, the same values of voltage, load current, and distance of conductors from the ground for different pole structures are obtained different distributions of the two components of the electromagnetic field. As a result, the difference between the maximum values of the electric field strength under the different lines is over 2.8 kV/m. Between the maximum values of the magnetic field, strength is over almost 14 A/m.
The experience of countries such as Denmark and the United Kingdom in the construction of overhead lines using non-standard supports (T-Pylon, Design Pylon) is a positive example that such solutions are usually accepted by local communities living in areas through which such lines run. These lines can have an environmentally friendly status due to a significantly reduced impact on the landscape and lower electric and magnetic field strength values in the vicinity of lines made on a traditional electricity pylon. Innovative monopole pylons must meet the serviceability limit states specified in the standard [15]. For poles of the height H, the maximum deflection values are permissible H/50. These requirements are met by the lattice structure of the height H, which are commonly used in the construction of overhead lines in Poland. Meeting these strict strength requirements significantly limits the construction of lines based on monopole pylons in our country.
LITERATURA
[1] Energetyka, Dystrybucja i przesył, Raport PTPiREE, Poznań, (2021) [2] Clean Energy for all Europeans, Luxembourg, Publications Office of the European Union, (2019). [3] https://www.pse.pl/obszary-dzialalnosci/krajowy-systemelektroenergetyczny/informacje-o-systemie [4] Rakowska A., Linie elektroenergetyczne WN i NN – światowerekordy, Przegląd Elektrotechniczny, 92 (2016), nr 10, s.1-4 [5] European Landscape Convention, Council of Europe, ETS no.176, (2000) [6] Protecting the Irish Environment and Landscape, A critical Issue for Irish Tourism, Position Paper, ITIC, (2014) [7] Śleszyński P., Ocena atrakcyjności wizualnej mezoregionów Polski. Znaczenie badań krajobrazowych dla zrównoważonego rozwoju, WGiSR UW, (2007), s. 697-714. [8] Innovative solutions for overhead line supports, CIGRE TB (2010), nr 416 [9] Innovative solutions for overhead line supports, Annexe CIGRE TB (2010), nr 416 [10] https://www.powerpylons.com [11] https://sinopa.ca/products/electricity-transmission-pylon [12] Linia elektroenergetyczna 400 kV Pasikurowice-Wrocław zaprojektowana i zbudowana na słupach rurowych, Folder firmy KromissBis, (2011) [14] https://sinopa.ca/obj/the-needle [15] PN-EN 50341-2-22:2016-04, Elektroenergetyczne linie napowietrzne prądu przemiennego powyżej 1 kV – Część 2-22: Krajowe Warunki Normatywne (NNA) dla Polski
Autor: dr inż. Marek Jaworski, Politechnika Wrocławska, Katedra Energoelektryki, Wyb. Wyspiańskiego 27, 50-370 Wrocław, e-mail: marek.jaworski@pwr.edu.pl
Source & Publisher Item Identifier: PRZEGLĄD ELEKTROTECHNICZNY, ISSN 0033-2097, R. 98 NR 3/2022. doi:10.15199/48.2022.03.05
Published by Joanna KOZIEŁ1, Michał MAJKA1, Andrzej WAC- WŁODARCZYK1, Krzysztof NAGLAK2, Department of Electrical Engineering and Electrotechnology, Faculty of Electrical Engineering and Computer Science, Lublin University of Technology(1), Faculty of Electrical Engineering and Computer Science, Lublin University of Technology(2), ORCID: 1. 0000-0003-1682-2589, 2. 0000-0002-7153-040X 3. 0000-0002-6272-9249
Abstract. The article presents methods of wind farm optimization through the use of PV installations and the use of pumped storage power plants. Optimization criteria are listed. The method of arranging a PV installation on a wind turbine and the way of arranging it as a separate installation are presented. Existing solutions in the German city of Galidorf with a water reservoir and in the Spanish Albacete are presented. Polish pumped storage power plants and their capacities were presented.
Streszczenie. W artykule przedstawiono metody optymalizacji farmy wiatrowej poprzez zastosowanie instalacji PV i wykorzystanie elektrowni szczytowo- pompowych. Wymieniono kryteria optymalizacji. Zaprezentowano sposób ułożenia instalacji PV na turbinie wiatrowej, oraz sposób ułożenia jako oddzielna instalacja. Przedstawiono istniejące rozwiązania w niemieckim mieście Galidorf ze zbiornikiem wodnym, oraz w hiszpańskiej Albacete. Wymieniono polskie elektrownie szczytowo-pompowe oraz ich moce. (Optymalizacja struktury farmy wiatrowej poprzez zastosowanie instalacji PV i wykorzystanie elektrowni szczytowo-pompowych).
Słowa kluczowe: odnawialne źródła energii, farmy wiatrowe, instalacja fotowoltaiczna, elektrownie szczytowo- pompowe. Keywords: renewable energy sources, wind farms, photovoltaic installation, pumped storage plants.
Introduction
The developing technology provides access to new solutions, replacing the existing possibilities and improving many factors taken into account during the operation of the device through optimisation. Optimisation is taking action to get the best results. It consists in improving the structure, construction elements or equipment parameters to achieve greater benefits. Optimisation may involve the use of the latest technological solutions or the use of innovative projects. The idea behind making improvements is to improve profits to the highest degree possible with a small financial contribution. When optimising, we can take into account many criteria why it is worth introducing changes.
The criteria include: • cost minimisation, • reduction of equipment wear, • exclusion of unnecessary activities, • improving the efficiency and performance of devices, • shortening the production process, • work load balancing.
Optimisation aims to improve working conditions with minor changes, the cost of which will pay off in a short time, and the solution will bring profits. Optimising the structure of a wind farm may be based on increasing production with the use of cheap or advantageous facilities [1]÷[5]. When optimising the structure of a wind farm in order to improve energy supply, the aim is to store kinetic energy in order to obtain stable operation of wind turbines [6]. Wind turbines are powered from the grid when production is zero. The reason for the poor operation of the turbines may be a weak wind, insufficient for the energy production process, or a failure of the windmill. During this time, the wind turbine receives power from the power grid to maintain measuring and control components. The network is heavily loaded when the machine is started up. A sudden and heavy load during start-up can cause voltage drops or even a failure of the power grid. In order to improve the transmission of electricity in the grid so that it is only based on the delivery of power from the operation of wind turbines, a form of optimisation may be energy storage while production outweighs consumption. As electricity storage, we can use small power plants to supply our own wind turbines.
The construction of wind turbines has its negative sides, in terms of the environment and other factors [7]÷[9].
• the wind farm causes the natural views to be obscured by devices, against the background of the natural landscape, huge turbines are the main point that draw observer attention from a distance of up to 7 km,
• windmills generate noise that may disturb local residents, wind farms are built at a distance from inhabited areas so that they do not interfere with the level of urban noise,
• a problem for birds, tall structures and moving shovels often stand in the way of bird migration and can be a dangerous obstacle for large flocks of birds,
• vibrations caused by the movement of the wings, the movement of the rotor (hub and blades) measuring up to 150 m in diameter may cause vibrations felt at a short distance [16],
• windmills have a negative impact on radars due to electromagnetic disturbances that arise during energy production,
• shading of the area, turbines are placed in places distant from cities. These are mostly agricultural areas where the sun is essential for vegetation,
• hazards related to mechanical failures, fires from lightning strikes or icing of moving parts, do not provide jobs. After completion of the wind farm construction phase, the station is only operated by a specially trained technician. This person is responsible for the diagnosis of failure in the event of its occurrence, draws up reports on the operation of turbines and keeps documentation,
• the service life of the turbine established by the regulations is 25 years, after which the turbine is disposed of.
Production from energy storage can support the grid during the highest electricity consumption by users during the day. Photovoltaic panels and pumped storage power plants can optimise electricity production by providing power to turbine systems and a system for relieving or supporting the power grid. In Poland, wind energy is the best developed method of producing electricity using renewable energy sources. Fig. 1 shows how to install a photovoltaic installation.
Fig.1. Layout of the PV installation on a wind turbine[3],[24]
After calculating the places in the tower that will be obscured by the moving blades, sunlight will be blocked, and we have an area of approx. 800 m2 for the installation of a PV system on the pillar casing. Panels are installed on each tower and connected directly to the wind turbine installation. Photovoltaic panels in the form of a strip with dimensions of 5986×308 mm were used. The thickness of the panels does not exceed 1 mm [25]. They are easy to install. The modules attached to the side walls of the tower do not interfere with the environment and landscape of the already constructed turbines by using subsequent structures.
Optimisation of the wind farm structure through a PV installation
The National Power System of the Polish Power System is sensitive to power fluctuations arising during the supply of energy from wind turbines. Variation in the direction of the energy flow is unfavorable for the power line, makes it difficult to prepare a power balance and does not ensure the stability of the devices operation. The diversified level of turbine energy production or sudden load caused by the start of the device are the cause of negative actions affecting the power grid [1]. Belong to them:
• fluctuations in power and voltage due to changes in wind speed. Voltage drops can be compensated by reactive power regulation by capacitor banks,
• flicker, mostly old installations. Switching on the generators and rapid changes in power can cause voltage drops, which are the source of flickering lighting,
• the higher harmonics produced by the generators are a source of protection and control disturbance. When stopped, the turbine produces no electricity. At the time the energy needed to maintain the turbine is taken from the grid. This condition is called zero generator production. The auxiliary power consumption includes the power supply of selected systems (Tab. 1). The most advantageous solution for wind farms is to design a photovoltaic installation as a source of maintenance for all turbine units. PV installation (PhotoVoltaic) has been recording a high increase in installed active power for several years.
The active power needed to maintain the turbine is approx. 100 kW.
A PV plant capable of supporting a wind turbine has a total power of 10 kWp (kilowatt pic). For a selected wind farm consisting of 16 turbines, the demand for turbine power is 160 kWp. In Polish climatic conditions, 1000 kWh can be produced annually from 1 kWp of a PV installation. Installing 1 kWp without subsidies in Poland amounts to an average of PLN 4764.2 gross [18].
Table.1. Systems and values of active power consumption from the power grid during generator zero production [7]
.
Fig.2. Active power installed from individual renewable energy sources in Poland [28]
Fig.3. Arranging the PV installation as a separate installation [3],[24]
The total investment cost for the selected wind farm is PLN 762,272 gross. 160 kWp of installed power from photovoltaic panels will amount to an annual production of close to 150 MWh. The annual profit from electricity production using the photovoltaic installation on the wind farm will amount to PLN 96,000, with the rate of PLN 0.64 per 1 kWh of electricity. The investment will pay for itself within 8 years. The service life of wind turbines is 25 years. The energy produced from the photovoltaic panels will improve the efficiency of the wind farm, increasing the production with active power that will be generated with the simultaneous operation of the wind turbine and the photovoltaic installation, and powering the units in the wind turbine during its zero production. The benefits of installing photovoltaic modules make the PV installation a very popular solution in households and single-family houses [25]. Fig. 3 shows the method of mounting the photovoltaic installation. After calculating the places of the tower that will be covered by the moving blades, sunlight will be blocked, and we have an area of approx. 800 m2 for the installation of a PV system on the pillar casing.
Panels are installed on each tower and connected directly to the wind turbine installation. The Heliatek company offers photovoltaic panels in the form of a strip with dimensions of 5986×308 mm. The thickness of the panels does not exceed 1 mm [25]. They are easy to install. The modules attached to the side walls of the tower do not interfere with the environment and landscape of the already constructed turbines by using subsequent structures. The photovoltaic installation can be installed as a separate installation on the site of a wind farm or it can be an element of the structure by placing it on turbine poles. One of the first implemented solutions of this type is still operating in Spain in Albacete (Fig. 4.).
Fig.4. Wind turbine in Albacete, Spain [3],[21]
The installation with a capacity of 9.36 kWp satisfies the wind turbine’s own needs. All wind turbines are connected to a PV installation. In the area of the wind farm, an area will be designated for the construction of a photovoltaic installation that will allow for the maintenance of power to all turbines during operation and downtime of the wind turbine.
Farm optimisation through the use of pumped-storage power plants
Another solution for wind farm optimisation is the combination of a pumped-storage power plant with wind turbines. The solution is not suitable for all wind farms as it requires access to a natural water reservoir. The reservoir into which the water is pumped is located higher than the main body of water. The high production of the wind turbine was used to power a water pump that pumps water to the water storage facilities. The support of the energy system is done by emptying the water tanks during poor production of wind turbines. The flow of water produces electricity.
In Poland, the solution may be used in the West Pomeranian Voivodeship. There are many wind farms in this area due to the area’s vicinity to the coast and characterised by the highest average wind speed in Poland.
The solution will increase the share of renewable energy in the country. Water tanks can be built in as part of the tower, a separate water tank next to the turbine, or a tank directly below the turbine, buried in the ground. Figures 5 and 6 show a diagram of the use of water as an energy storage using a water pump.
Fig.5. Example of a diagram of the use of water as an energy store with the use of a tower as an element of a reservoir [3],[24]
Fig.6. Example of a diagram of the use of water as an energy store with the use of a separate water tank [3],[24]
The stored water tank is part of the turbine system or the tank is located next to the tower. The pump is connected to the turbine’s energy system. Based on the measurements from the nacelle, the system adjusts the operation of the water pump in order to ensure stable operation of the network. Water is supplied through a pipeline from a standing water tank. The power equipment necessary to maintain the turbine is supplied from the energy storage when the power grid is heavily loaded and there is no production during windless weather. The solution discussed was presented in the German town of Gaildorf.
Table 2. Pumped-storage power plants in Poland [data for 2020] [23]
.
The tanks of four turbines can hold 160,000 m3 of water. This amount of water allows to store energy up to 70 MWh [10],[11], [21]. In Poland, there are pumped-storage power plants with a total capacity of 1800 MW for turbine operation. These are the 6 power plants in Żarnowiec, Porębka-Żar, Solina, Żydowo, Niedzica and Dychów. They do not cooperate with power plants producing electricity using a different method. They can be open to modernisation with wind turbines [23].
Conclusions
The main advantages of optimising the structure of a wind farm include: an increase in the share of renewable energy sources in energy production, stable operation of the power grid and improved efficiency of wind turbines. The main advantages of connecting a wind turbine with a photovoltaic installation are the operation of the power grid based only on the supply of energy from the turbines and the reduction of active power drops and voltages in the power grid. Advantages of PV installations as a source of maintenance of wind farm turbine units [23]: easy and cheap construction cost, installation of photovoltaic modules, inverter, AC and DC side protection, cabling, surge arresters, grounding and assembly with delivery of modules. (The cost will be PLN 40-50 thousand for the selected turbine).
• low maintenance costs related to the repair of panels during failure, versatile installation options, • lifetime of photovoltaic modules is 25-35 years, • the user gets a 10 to 20-year product warranty.
REFERENCES
[1] Kozieł J. et al., Analysis of the impact of a wind farm on the quality of electricity in the distribution grid, Przegląd Elektrotechniczny 97(12), p.202-205,DOI: 10.15199/48.2020.12.43. [2] Kozieł J. et al Analiza pracy wybranej instalacji odnawialnych źródeł energii, Przegląd Elektrotechniczny, 97(12), p.198-201,DOI: 10.15199/48.2020.12.42. [3] Naglak K., Optymalizacja struktury farmy wiatrowej – magazynowanie energii kinetycznej w celu poprawy niezawodności dostaw energii elektrycznej, Praca dyplomowa inżynierska, Wydział Elektrotechniki i Informatyki Politechniki Lubelskiej, Lublin 2021. [4] Bandzul W., Energetyka Wiatrowa w Polsce, Polskie Sieci Elektroenergetyczne SA, Nr 3/2005(54) [5] Bogacz P. et al, Poradnik Małej Energetyki Wiatrowej, Olsztyn, maj 2011 [6] Czachor A. et al., Przegląd istniejących technologii w dziedzinie energetyki wiatrowej- obecnie stosowane rozwiązania pozwalające na pozyskanie energii z wiatru, Politechnika Śląska, Katedra Technologii i Urządzeń Zagospodarowania Odpadów. [7] Specyfikacja ogólna V112–3.0 MW 50/60 Hz, Class 1 Nr dokumentu: 0011-9181 V06 26.08.2011 [8] Polskie Sieci Elektroenergetyczne, Instrukcja ruchu i eksploatacji sieci przesyłowej, Cześć ogólna Wersja 1.1 Tekst jednolity po decyzji Prezesa URE nr DPK-4320-2(16)/2010÷2013/LK z dnia 29 stycznia 2013 r. [9] Raport WWF Polska, Dostępne i Przyszłe Formy Magazynowania Energii, opracowanie na zlecenie fundacji WWF Polska, Warszawa 2020. [10] German Wind Energy Association, Installed wind power capacity in Germany, (https://www.windenergie.de/eninfocenter/statistiken/deutschland/installed-wind-powercapacity-germany) [11] Pfaffel S et al, IWES Annual Report, Windenergie Report Deutschland 2011, 54 [12] Alpha Ventus, Federal Ministry for Economic Affairs and Energy (https://www.alphaventus.de/english/) (accessed 02-01-2021) [13] Internation Electrotechnical Commission standard DIN EN 61400-1, design requirements, Release 2015. [14] Roscher B. et al, Modelling of Wind Turbine Loads nearby a Wind Farm, Center for Wind Power Drives, RWTH Aachen, Campus Boulevard 61, 52074 Aachen, Germany. [15] Internation Electrotechnical Commission standard DIN 50100:2015, Load controlled fatigue testing – Execution and evaluation of cyclic tests at constant load amplitudes on metallic specimens and components, Release 2015, [16] Fradsen S, Turbulence and Turbulence-generated structural loading in wind turbine cluster, Riso-R-1188, Roskilde, Releas [17] Michałowska J. et al, Monitoring of the Specific Absorption Rate in Terms of Electromagnetic Hazards, Journal of Ecological Engineering, vol. 21, issue. 1, 2020, DOI: 10.12911/22998993/112878 [18] http:// globenergia.pl/ [19] Komarzyniec G. et al, The calculation of the inrush current peak value of superconducting transformers, 2015 Selected Problems of Electrical Engineering and Electronics, WZEE 2015 27 January 2016 Article number 7394042 Selected Problems of Electrical Engineering and Electronics, WZEE 2015, Kielce, 17 September 2015 – 19 September 2015, DOI 10.1109/WZEE.2015.7394042 [20] https://fotowoltaikaonline.pl/ [21] http://www.instsani.pl/ [22] Michałowska J. et al, Prediction of the parameters of magnetic field of CNC machine tools, Przegląd Elektrotechniczny.- 2019, vol. 95, no. 1, p. 134-136, doi:10.15199/48.2019.01.34 [23] http://wysokienapiecie.pl/ [24] http://app.diagrams.net/ [25] http://www.heliatek.com/ [26] Korzeniewska E., et al. Resistance of metallic layers used in textronic systems to mechanical deformation, Przegląd Elektrotechniczny , Volume 93, Issue 12, Pages 111 – 114, 2017 vol.19, no. 24, DOI: 10.15199/48.2017.12.28 [27] Shepherd D. et al, Wind Farms: Noise, 2020, DOI: 10.1201/9781003043461-22 [28] https://globenergia.pl/moc-zainstalowana-mikroinstalacjefotowoltaika-36-gw-energetyka-pse/ [29] Agrawal M. ,Rao K. V. S. Harnessing Solar Energy from Wind Farms: Case Study of Four Wind Farms, Springer Nature Singapore Pte Ltd. 2022, Sanjeevikumar et al. (eds.),Advances in Renewable Energy and Electric Vehicles,Lecture Notes in Electrical Engineering 767, DOI/10.1007/978-981-16-1642-6_17
Authors: dr inż. Joanna Kozieł, Department of Electrical Engineering and Electrotechnology, Faculty of Electrical Engineering and Computer Science, Lublin University of Technology, Nadbystrzycka Street 38A, 20-618 Lublin, e-mail: j.koziel@pollub.pl, dr hab. inż. Michał Majka, prof. LUT, Department of Electrical Engineering and Electrotechnology, Faculty of Electrical Engineering and Computer Science, Lublin University of Technology, Nadbystrzycka Street 38A, 20-618 Lublin, e-mail: m.majka@pollub.pl, prof. dr hab. inż. Andrzej Wac-Włodarczyk, Department of Electrical Engineering and Electrotechnology, Faculty of Electrical Engineering and Computer Science, Lublin University of Technology, Nadbystrzycka Street 38A, 20-618 Lublin, e-mail: a.wac-wlodarczyk@pollub.pl, inż. Krzysztof Naglak, Faculty of Electrical Engineering and Computer Science, Lublin University of Technology, Nadbystrzycka Street 38A, 20-618 Lublin, e- mail: krzysztof.naglak@pollub.edu.pl
Source & Publisher Item Identifier: PRZEGLĄD ELEKTROTECHNICZNY, ISSN 0033-2097, R. 98 NR 1/2022. doi:10.15199/48.2022.01.14
Published by Alex Roderick, EE Power – Technical Articles: Combining Waveforms in a Power System to Cancel Harmonic Components, August 23, 2021.
Harmonics can cause transformers to fail, motors to burn out, circuit breakers to trip (nuisance tripping), and neutral conductors and other parts of a power distribution system to overheat. Severe overheating leads to electrical fires.
Harmonics are caused by nonlinear loads that draw current in pulses, resulting in a distorted waveform. Harmonics is a source of power quality problems that lead to overheating of circuit components. Harmonics mitigating transformers are used to reduce harmonics in power distribution systems.
When harmonics are present, distorted voltage and current waveforms are present on the lines. The distorted waveforms must be analyzed to determine the type and quantity of harmonics that are present. When harmonics are present, the higher-order harmonics add together with the fundamental to produce the resultant waveform. The resultant waveform is the waveform measured by a power quality analyzer and can include different harmonics. Fourier analysis is used to analyze the waveforms. There are many types of Fourier analysis, but the simplest concept is the Fourier transform.
The Fourier Transform
The resultant waveform must be analyzed with the Fourier transform to learn about the harmonics present. The Fourier transform is the mathematical method of converting a time-based waveform, like a sine waveform, into frequency-based information. This is equivalent to breaking down (decomposing) a periodic waveform into a series of sine waveforms that can be added together to reproduce the original waveform (see Figure 1). The Fourier transform is used to find the frequency and magnitude of the harmonics present on the lines. The output of a power quality analyzer gives the relative magnitude of each harmonic.
Figure 1. Fourier analysis is used to decompose a distorted wave into its component harmonics. Image courtesy of SALICRU
Combining Waveforms
The waveforms from different loads combine on the lines at any point where two or more wires come together in a junction. This typically happens at the connection points of the windings within a transformer or at a common bus feeding two or more transformers.
When sine waveforms combine, they add together, and the resultant waveform has a value equal to the sum of the individual values. If one of the waveforms is positive and the other is negative, and both are at the same numerical value, they are said to cancel. If two current waveforms are exactly out of phase with each other, with one equal to +10 A and the other equal to –10 A, the resulting current at that instant has a value of 0.
Note: Jean Baptiste Joseph Fourier developed the idea behind Fourier analysis. Fourier analysis takes a time-varying signal, such as a source with harmonics, and transforms it into the frequency components that make up the signal.
If two current waveforms are out of phase with each other and they do not exactly cancel, the resultant waveform will have a non-zero value. When an SMPS draws current in pulses, the pulses are separated from each other. If one of these waveforms is shifted 60° relative to the other and the waveforms are added, the resultant has two peaks for every peak of the original waveform (see Figure 2). This is the type of waveform shift and recombination that happens in transformers with a standard delta-wye winding or a wye-zigzag winding. The combined waveform is found on the line side of either a standard delta-wye or wye-zigzag transformer that feeds single-phase, line-to-neutral, nonlinear loads. This results in the cancellation of the triplen harmonics.
Figure 2. Waveforms add together when combined at a wiring junction. A 60° phase shift cancels triplen harmonics.
The combination waveform created by a delta-wye or a wye-zigzag transformer can be combined with two other waveforms with appropriate phase shifts to create a new waveform (see Figure 3). This waveform is a result of canceling the 5th, 7th, 17th, and 19th harmonics in addition to the triplen harmonics that were canceled by the initial phase shift. This additional phase shift can be accomplished with delta-zigzag transformers in parallel with wye-zigzag or delta-wye transformers. The combined waveform will be seen at the power busbar upstream of the transformer pair.
Figure 3. Further waveform shifts are used to cancel higher-order harmonics.
If the load on a transformer changes, the waveforms get out of balance and do not cancel. Additional combinations of phase shifts could be designed to eliminate more harmonics, but the benefits would be very small. The transformer bank would have to be modified every time the load changes. This can happen whenever a computer is turned on or off, or the load on a variable-speed motor drive changes. It is not practical for this type of transformer bank to be modified with every load change.
Author: Alex earned a master’s degree in electrical engineering with major emphasis in Power Systems from California State University, Sacramento, USA, with distinction. He is a seasoned Power Systems expert specializing in system protection, wide-area monitoring, and system stability. Currently, he is working as a Senior Electrical Engineer at a leading power transmission company.