Published by Daniel McDermit1, David D. Shipp2, Thomas J. Dionise3, Visuth Lorch4,
1Sr. Project Manager Turner Construction Company Chicago, IL
2PE Eaton Electrical Group Power Systems Engineering Warrendale, PA Fellow, IEEE
3PE Eaton Electrical Group Power Systems Engineering Warrendale, PA Senior Member, IEEE
4Eaton Electrical Group Power Systems Engineering Warrendale, PA
Abstract— During commissioning of a large data center, while switching medium voltage circuit breakers without any appreciable load, several potential transformers failed catastrophically. A detailed investigation, including computer simulation was performed. Ferroresonance produced by switching transients associated with opening and closing the vacuum breakers, was determined to be the cause. The analysis also determined that the close-coupled power transformers were also in jeopardy. Field inspections involving grounding improvements coupled with solution simulations were made. High speed switching transient measurements were performed to verify the analysis and the surge protective devices solution (arresters and snubbers). This paper walks the reader through problem recognition, simulation, field measurements and solution implementation. Special focus will be made on the field measurements verification.
Keywords- switching transients, vacuum breakers, potential transformers, ferroresonance, EMTP simulations, surge arresters, RC snubbers.
I. INTRODUCTION
A. Facility Description
The ultimate build out of this facility strategically located in the midwest is approximately 400,000 sq. ft. of colocation (CoLo) data center white space and containers that will be supported by 250,000 sq. ft. of Central Utility Building (CUB) and approximately 25,000 sq. ft. of office and support space. The data center will ultimately support approximately 59.4 MW of critical load.
The first completed phase of the facility, Phase I, is approximately 200,000 sq. ft. of data center space, which consisting of 95,000 sq. ft. of standard CoLo type white space and 96,000 sq. ft. of container based data facility, as well as 125,000 sq. ft. of utility/mechanical plant space. The utility/mechanical plant consists of 1) 12 chillers and cooling towers and associated equipment, 2) thermal storage tanks, 3) air handlers, and 4) critical electrical support equipment including 12 generators, UPSs and PDUs. This equipment supports four CoLo rooms of data center white space. The mechanical and electrical infrastructure also supports the equivalent of seven CoLo rooms of critical load in approximately 50 to 60 containers (each container is capable of supporting 350 kW of critical load).
B. Commissioning History
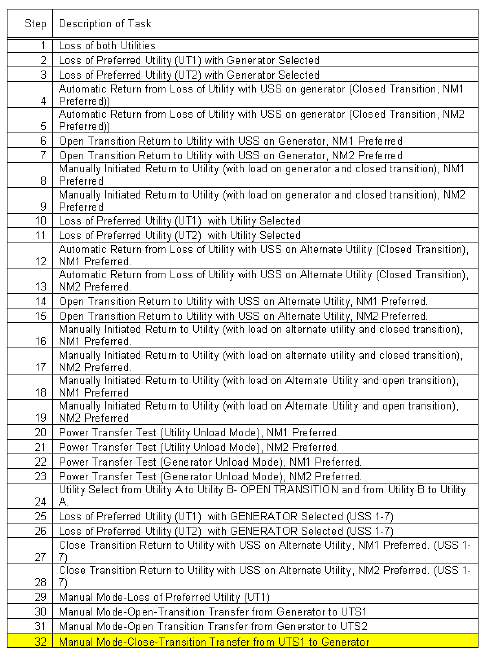
On February 18, 2009 the construction team, commissioning team, testing engineers and contractors were performing manual open transition testing from one of the data centers three main utility feeds to Generator power. The Appendix gives an excerpt from the Sequence of Operation testing that was being performed when the first Unit Sub Station (USS) had an event where a Potential Transformer (PT) failed. The Appendix describes each step in detail.
The technician performing the aforementioned sequence of operations, specifically Step #32, noticed that there was an issue with the generator kW reading on the digital feeder protection relay which caused him to stop and investigate with the NM1 (Normal Main – Primary Unit Supply) closed, the GM (Generator Main) open and the water-cooled load banks at 600 kW. During his investigation in the Unit Substation Room, smoke began to appear from the bus PT truck, Phase A. The PT was easily de-energized by opening NM1 in manual mode. A quick investigation indicated that there were no primary or secondary fuses blown on the PT.
A similar incident occurred two days later while the technician was setting-up to perform the same testing sequences on another USS. The technician had the generator tags cleared and started the associated USS generator to verify parameters. In manual mode the technician open-transitioned the source back to Utility A. Within a matter of minutes the technician heard something “pop” and then noticed smoke appearing through the vents in the NMI (Utility A) section. Upon investigation of the USS, it was noted that there was a PT failure in NM1.
C. Recognition of a Problem
The project team experienced a series of PT failures that occurred while the commissioning team and equipment vendors were performing open transition sequence testing while utilizing the feed from UTS-A and the feed from UTS-C. The stress on the project team became heightened and everyone from the end user down to the technicians working on the equipment were driven to discover the reason for the PT failures. The question arose, had anyone on the project experienced such an event or had knowledge of similar events? A few of the team members recalled similar events while working on their last data center project which reminded them of the PT failures experienced here. In summary, on the previous data center project, the authors performed an engineering analysis at their facility to simulate the problem observed at the present jobsite.
In the previous report, the authors stated “We are very much aware of how vacuum breaker induced switching transients can cause transformer failure. We have been doing many computer simulated switching transient studies recently to quantify the problem and to verify the solution. A key element to the failure mechanism is short cables between the vacuum breaker and the transformer”. This immediately sent up a red flag to the team electrical manager and others on the team, since all of the PT failures occurred around the time of open transition (switching) operations. Additionally, the distance between the NM1 breakers and the primary side of the transformers is relatively short (contained within the substation itself). We discovered that this facility was potentially experiencing a phenomenon called “Transient Voltage Restrike”. In transient voltage restrike, the combination of variables that can cause transformer failures usually involve a vacuum circuit breaker interrupting inductive loads that are supplied by cast resin power class transformers.
D. Failures of PTs During Vacuum Breaker Switching
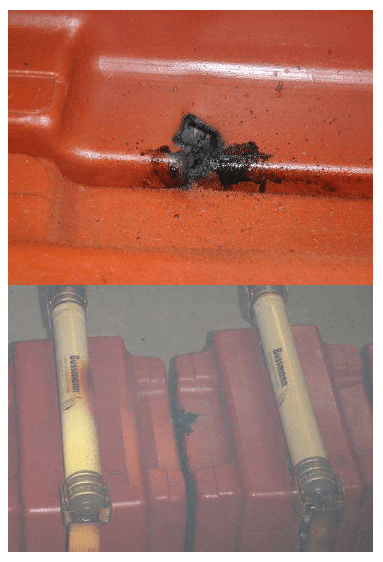
Fig. 1 shows the PTs which failed during vacuum breaker switching. The photo shows the PT sustained the damage. The fuses did not blow and remained intact. Typically, a PT may have on the order of 8000 turns per winding. Close examination of the PT shows the damage consisted of a series arc. Such damage is indicative of ferroresonance. When the breaker opens, a DC charge is trapped on the stray capacitance of the cable, which is imposed on the primary winding of the PT. The DC trapped charge saturates the iron of the PT, which fatigues the winding insulation. The frequency of the PT ferroresonance observed at this facility was about 20 Hz. In this special case of ferroresonance called PT saturation, the PT may draw only 0.1A which is not enough to blow the fuse on the PT primary. Consequently, the series arc could last for hours or up to weeks until the insulation breaks down, at which point ionized gases are produced, and a complete fault occurs blowing the fuse. In the worst case, the ionized gasses contained in this confined space develop an arc phase-to-phaseto- phase, i.e. a three-phase fault. This three-phase fault would cause significant damage to the switchgear. Such a failure would result in significant downtime, reducing the reliability of the power delivered to the mission critical loads.
Fortunately, the PT failure mode at this facility was not catastrophic. Instead, after vacuum breaker switching, the following was observed on two separate occasions: 1) the fuse did not blow, but smoke came out of the PT compartment, and 2) the fuses blew before the ionized gasses could take out the entire cell.
E. End User Response
Although the PT failures did not result in massive failure, the end user was concerned the PT failure could have escalated into severe damage of the switchgear. The end users response was to investigate the event, develop a test procedure to investigate the root cause of the failed PTs, and to ultimately recommend a solidly engineered correction to the sequence of operation or a re-engineering of the electrical gear itself.
II. SWITCHING TRANSIENT THEORY
A. Decision to do a Study
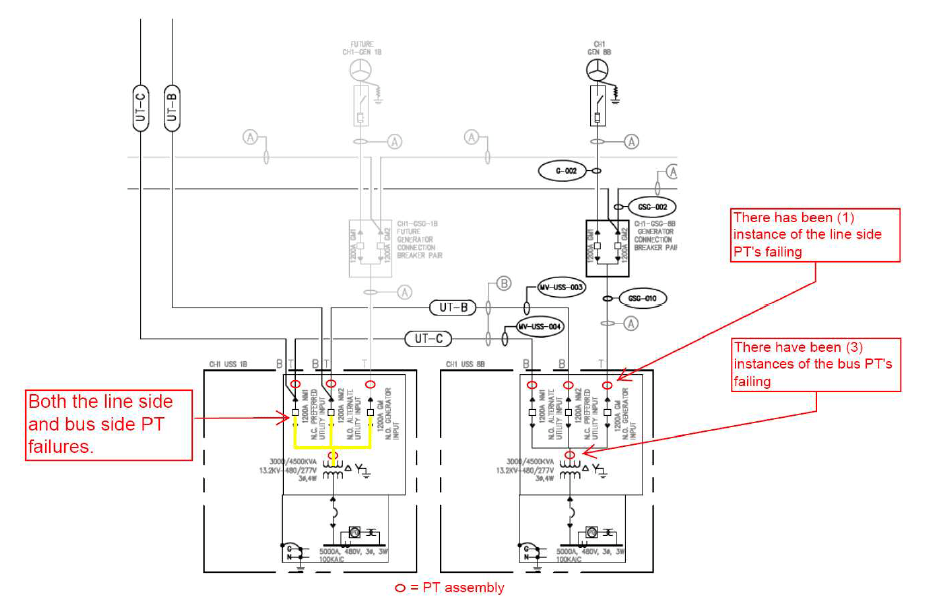
Fig. 2 summarizes the PT failures at Substations USS1B and USS8B on the line-side and load side of the 1200A vacuum circuit breakers. At USS1B, there were both line-side and load-side PT failures. At USS8B, there was one line-side PT failure and three load-side PT failures. The figure calls attention to the issues: 1) a large number of PT failures at two different substations, 2) the failures involved both line-side and load-side failures, and 3) the failures occurred with regularity during switching of the 13.2 kV feeders when transitioning from utility to generator. For these reasons, it was decided to create a model of the power system and conduct a switching transients study to determine the root cause of the PT failures. The decision to conduct a switching transients study permitted simulation of a variety of switching events, determination of sensitivity of parameters contributing to the failures and demonstration of the effectiveness of proposed solutions. Further field testing was placed on-hold until the study was completed and the system response understood.
B. Background on Ferroresonance
The primary focus of this study was ferroresonance. ANSI/IEEE Std 100-1984 defines ferroresonance as “a phenomenon usually characterized by overvoltages and irregular wave shapes and associated with the excitation of one or more saturable inductors through a capacitance in series with the inductor.” The key elements are saturable inductors in series with capacitance. The nonlinear inductance (XL) is usually associated with the core of a transformer. The transformer core will saturate with flux as voltage increases. The transformer has a saturation curve, which gives flux as a function of voltage. XL has high value for nonsaturation, and XL has low value when the core saturates. The saturation curve has a “knee” where the change takes place. Transformers are designed to operate near the “knee”. In the ferroresonant circuit, the capacitance (XC) can be the capacitance of cable, overhead line, or stray capacitance of transformer windings or bushings.
Under normal operation, XC is smaller than XL. However, if some switching event causes the voltage to increase, then the transformer core may be pushed into saturation and XL lowered. It is possible at some higher voltage this lower saturated value of XL may equal XC, forming a series resonant circuit called ferroresonance. As in the normal series resonant circuit, the source voltage (VS) does not change much, but the voltage for nonlinear inductance (VL) and voltage for stray capacitance (VC) increase and oppose each other. Since ZL is nonlinear, the voltages VL and VC become distorted or irregular.
Some type of system disturbance is needed to “jolt” the transformer XL into a lower saturated value equal to the system capacitance XC. This “jolt” allows XL = XC and ferroresonance starts. Ferroresonance can continue for a long time (minutes, hours or even days) since little resistance (R) is in the circuit to damp the oscillations.
In the case of this medium voltage distribution system, the nonlinear inductance is either the 14,400/120 V PT or 13.2/0.48 kV, 3000/4500 kVA power transformers. The capacitance is dominated by the stray capacitance of the cables. The “jolt” needed to initiate the ferroresonance is the opening of the vacuum circuit breaker which feeds downstream PTs and the power transformer.
C. Modeling Ferroresonance
In modeling this medium voltage distribution system for such ferroresonance analysis, it was important to accurately represent the opening of the primary vacuum breakers, stray capacitance of the cable, and nonlinear inductance of the transformer being switched, i.e. transformer saturation. The authors modeled these critical circuit components in the Electromagnetic Transients Program (EMTP).
The authors’ study approach was to first model the steadystate conditions with the transformer (PT or power transformer) energized. In this way, it was possible to show the normal excitation current drawn by the transformer to magnetize the nonlinear inductance. Next, the authors simulated the actual switching conditions which produced ferroresonance during transition from utility source to generator source. These opening conditions produced ferroresonance, as evidenced by erratic voltage and current waveforms shown later in the paper. Finally, the authors added mitigation in the form of RC snubbers to provide damping and mitigate the PT ferroresonance.
The actual switching conditions consisted of opening the 13.2 kV utility feeder to USS8B, and closing the 13.2 kV generator feeder breaker. The worst case for ferroresonance occurs with an unloaded transformer. Either a PT or power transformer may experience ferroresonance. On this basis, Eaton examined the electrical distribution system and selected the worst case conditions to check for PT and power transformer ferroresonance. Snubbers sized for this worst case will protect the PT and power transformers during less severe switching operations.
D. Computer Simulations of Actual Conditions
Switching transients simulations were conducted in the electromagnetic transients program (EMTP) to investigate the possible failure of the PT due to transient overvoltages during the circuit switching of the vacuum circuit breakers. The circuit model developed in EMTP consisted of the source, breaker, cable, PT, and Transformer T-8B. The cable was represented by a Pi model consisting of the series impedance and half of the cable charging at each end. (In some cases, multiple Pi models are used to represent the cable.) The vacuum breaker was represented by a switch with different models for opening (current chop of 5A), re-strike (excessive magnitude of TRV), re-ignition (excessive frequency of TRV) and closing (pre-strike). The three phase transformer model consisted of the leakage impedance, magnetizing branch, winding capacitances from high-to-ground and low-to-ground. The PT model included saturation effects. Actual switching scenarios that resulted in PT failures were simulated, and the results of these simulations are described below.
a) Open utility-side 13.2 kV feeder to USS8B followed by closing generator-side feeder (open transition to generator)
Case N6 simulates the actual case during the testing even though the transition time in the simulation is much shorter than the actual time. Case N7 is the same as Case N6 but with a snubber installed. Fig. 3 compares the study results for Cases N6 and N7 for the primary voltage at the 3,000 kVA dry type transformer T-8B. The application of the snubber circuit (Case N7), greatly reduced the transient overvoltage (TOV) magnitude at the 13.2 kV bus and the oscillation frequency. The oscillation frequency of roughly 22,000 Hz (Case N6) can be reduced to 2,000 Hz (Case N7) and the resistor in the snubber circuit will damp the oscillation within 3 milliseconds.
A closer examination of the transient overvoltage is given in Fig. 4. Fig. 4 compares the study results for Cases N6 and N7 for the primary voltage at the 3,000 kVA dry type transformer T-8B zoomed from 0 to 30 milliseconds. The figure illustrates the opening of the utility side circuit breaker.
The application of the snubber circuit (Case N7) reduced the transient overvoltage from 170 kV peak with an oscillation frequency of 1,594 Hz to 26.6 kV peak with an oscillation frequency of 215 Hz. The study also shows a high DC offset for Case N6 due to the energy transfer between the stray capacitor and inductance in the Transformer T-8B and PT. The magnitude of the transient overvoltage may be smaller due to the operation of the surge arrester, however the oscillation frequency will remain the same.
Similarly, Fig. 5 compares the study results for Cases N6 and N7 for the primary voltage at the 3,000 kVA dry type transformer T-8B zoom from 90 to 120 milliseconds. The figure illustrates closing of the generator side circuit breaker. The application of the snubber circuit (Case N7) reduced the oscillation frequency from 20,000 Hz (Case N6) to 2,000 Hz (Case N7) and the period of transient can be was reduced from oscillatory down to 3 milliseconds. The oscillatory condition may cause the PT failure over a long period.
2) Close generator-side 13.2 kV feeder to USS8B (enhanced model of open transition to generator)
Case N8 simulates closing the generator-side feeder breaker with an enhanced model of open-transition. Case N9 is the same as Case N8 but with the snubber installed. Fig. 6 compares the study results for Cases N8 and N9 for the primary voltage at the 3,000 kVA dry type transformer T-8B. The application of the snubber circuit (Case N9), reduced the oscillation frequency from 22,700 Hz (Case N8) to 1,486 Hz (Case N9) and the resistor in the snubber circuit will damp the oscillation within 3 milliseconds. Again, the oscillatory condition may cause the PT failure over a long period.
Fig. 7 illustrates the study results for Case N8 for the primary voltage at the 3,000 kVA dry type transformer T-8B. The figure was zoomed from 5 milliseconds to 10 milliseconds and the resonance condition is clearly illustrated in the figure. The simulated ferroresonance condition in Fig. 7 is a near match for the ferroresonance condition captured with the highspeed power quality meter in Fig. 9.
Fig. 8 compares the study results for Cases N8 and N9 for the bus voltage at USS-1B. Since this location is only 10 feet from Bus USS-8B, the results will be similar to the primary voltage at the 3,000 kVA dry type transformer T-8B. The application of the snubber circuit (Case N9), reduced the oscillation frequency from 22,700 Hz (Case N8) to 1,485 Hz (Case N9) and the resistor in the snubber circuit will damp the oscillation within 3 milliseconds. Again, the oscillatory condition may cause the PT failure over a long period.
3) Comparison of PT connections – Open utility-side 13.2 kV feeder to USS8B
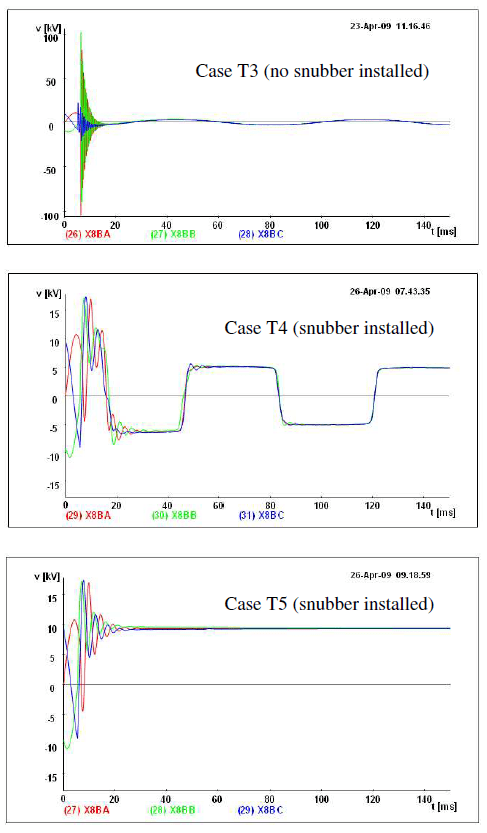
The PTs that failed were connected wye-grounded wyegrounded (Yg-Yg). The analysis was expanded to consider the benefit, if any, of the open delta PT connection. In Case T3, there is a nominal load of 100 kW with 0.97 lagging power factor on Transformer T-8B. The 13.2 kV circuit breaker is opened on the utility side feeding transformer T-8B. First, the Yg – Yg PT connection was considered with no snubber. Fig. 9a shows the Transformer T-8B primary voltage. After breaker opening, the transient overvoltage was as high as 103.61 kV with an oscillation frequency of 1,378 Hz. Such a TOV will result in re-ignition of the breaker and a higher TOV.
Next, in Case T4 the Yg – Yg PT connection with a snubber was considered. Fig. 9b shows the transformer T-8B primary voltage. After breaker opening, the TOV was reduced from 103.61 kV (Case T3) to 17.413 kV (Case T4). The oscillation frequency was reduced from 1,378 Hz (Case T3) to 214 Hz (Case T4). However, the PT Ferroresonance is not eliminated due to the PT connection of Yg-Yg in the temporarily ungrounded circuit during open transition.
Finally, in Case T5 the open-delta PT connection with a snubber was considered. Fig. 9c shows transformer T-8B primary voltage. After breaker opening, the TOV was reduced from 103.61 kV (Case T3) to 17.416 kV (Case T5). The oscillation frequency was reduced from 1,378 Hz (Case T3) to 214 Hz (Case T5). With the PT connected open delta, the PT Ferroresonance is eliminated. Adding a resistor to the PT equal to 50% of the burden will assist in damping the ferroresonance.
E. Solutions involving snubbers, grounding and ferroresonance elimination
1) Snubbers
Once the need for snubbers was determined, the surge capacitor was selected. The surge capacitorwas selected based on system voltage. Years of experience has shown the industry that certain values work well for given applications. For example, 0.25 micro-Farad surge capacitorworks well for most 15 kV class applications. This value does a good job of slowing down fast transients to be within the dV/dt rating of 15 kV class transformers, switchgear, motors, generators, etc. The capacitor industry makes these surge caps with standard available values. Alternatively, one could carefully evaluate the ring waves and fine tuned the natural frequency to meet a special value, but such an fine tuned approach generally requires a custom build, i.e. special capacitance values with long delivery times. Such custom values are not required, and the long lead times did not meet the schedule of the project. Once the need for snubbers was determined, the first attempt was to use standard available surge caps for that voltage level.
First, the resistor was sized to match the surge impedance of the source cable feeding the circuit. In this case, two (2) cables were address. The surge impedance of the utility source cables was about 30 ohms while the generator cables was about 20 ohms. Since the snubber must take care of both conditions, 25 ohms was selected as a compromise. The authors have found that a perfect match is not required, but rather a few ohms difference is effective. By matching the resistor to the cable surge impedance, the high frequency waveform impinging on the circuit will not double due to reflection. The resistor cancels the reflection as well as provides damping, especially for the DC offset voltage, that causes ferroresonance.
Next, the snubber values were entered into the computer model in EMTP. (EMTP is recognized world-wide as the premier tool for transient analysis of power systems.) In ETMP, the switching transients were simulated to ensure that the selected snubber components actually accomplished their objective. The discharge current through the resistor was evaluated for three criteria: 1) the Joule (or equivalent watt rating) must be well within thermal ratings, 2) the switching transient voltages must be well below BIL and 3) the dV/dt must be well below transformer limits. All three criteria must be satisfied. For 15 kV transformers, if the ring wave frequency can be reduced to between 250 Hz and 1000 Hz, then there will be no problem. This final simulation also proves that the natural frequency is not too low to cause other problems. Once the surge capacitor was added, its capacitance dominated over the other capacitances in the entire circuit, and reduced the oscillation frequency to an acceptable value.
The specifications for the RC snubber circuit are given in Fig. 10. The resistor average power rating is 750 W at 40 °C, and the peak energy rating is 16,000 Joules. This snubber was applied at other locations in the system. Although cable surge impedance varies somewhat from location to location, this snubber circuit provides adequate mitigation of the voltage transients produced by the vacuum breaker at this location. Selection of one set of RC snubber values simplifies the design and installation, i.e., only one type of resistor and capacitor must be used. The 13.2 kV RC snubber circuit is required at every 13.2 /0.48 kV transformer.
2) Grounding
The wiring methods and grounding means for the 13.2 kV system were inspected. The evaluation included the method of grounding, effectiveness of all connections, presence of ground loops, and compliance with the NEC, FIPS 94, and other applicable standards. The evaluation determined both the utility substation and the generation plant had well designed ground mats that provided effective grounding for their respective electrical equipment. However, it was noted that the ground mats were not tied together. Conduit was relied upon to make this connection, but the use of PVC in several locations broke the continuity.
As a result, ground mats would be exposed to transferred earth potentials during switching and lightning, imposing a potential difference on such components as surge arresters, cable shields, and Yg-Yg PTs. Transferred earth potentials refers to the phenomena of the earth potential of one location appearing at another location where there is a contrasting earth potential. The transfer of potentials may occur over conductors that have been purposely placed between the two locations. For example, consider the situation of Fig. 11. A ground fault occurs at the remote substation between the primary transformer busing and its respective ground mat. The return path for the ground fault current is through the earth back to the main substation ground mat and its respective system ground.
This earth return path will have a finite amount of impedance Zg = Rg + j Xg where Rg is the earth resistance and Xg is the earth reactance between the two substation ground mats. The potential difference between the mats is given by:
ΔEg = IgZg (1)
Any electrical conductors, which may extend from within one substation to within the other, may be subject to this potential difference ΔEg. When ΔEg is high, due to excessively high ground fault currents or excessive earth impedance Zg, that serious voltage stresses may be imposed upon various system components never designed to withstand them. For this facility with independent ground mats, high frequency impulses on vacuum circuit breaker closing may cause momentary voltage differences between the ground mats. This imposes a potential difference on the PTs well above the rated line-to-ground voltage, forcing the PT into saturation.
III. MEASUREMENTS
A. Before Solutions
Prior to the installation of the snubbers, several transients were captured on one of the Unit Sub Stations. One of these is shown in Fig. 12. It was noted that the lower load levels resulted in higher over-potential and higher dV/dt signals being developed from the breaker operations. Before installing snubbers, the captured screen shot of Fig. 12 was obtained when utility feeder NM-1 was opened at 300 kW showing a high level of dV/dt signal. It was noted that the duration and peak voltage of the transient had increased from previous test sequences at higher load levels. The peak voltage measured was 49.6 kV, and the duration was 876 μsecs.
B. Test Equipment Selection
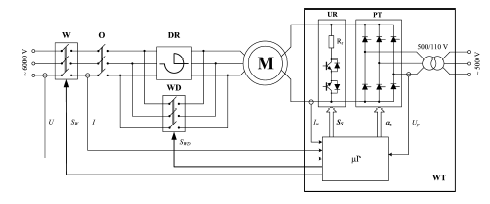
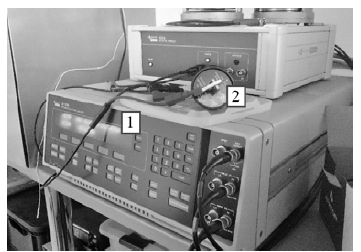
The system under test consisted of a 4.5 MVA dry transformer connected delta-wye with PTs connected Yg-Yg. The medium voltage power transfers were performed by vacuum breakers. Three (3) 13.2 kV sources power the substation: 1) utility source UTS-A to the NM1 breaker, 2) UTS-C to NM2, and 3) GEN11B through the generator output breaker (GM1) to the substation breaker GM. Test probes were installed on each phase of the line side of each substation breaker, and one set at the line side of the transformer. Each test set consisted of a laptop, a power quality meter, three voltage divider (100/1 ratio) probes, and connecting wires as shown in Fig. 13 and described further in Table I.
C. Personnel Safety Issues at 13.2 kV
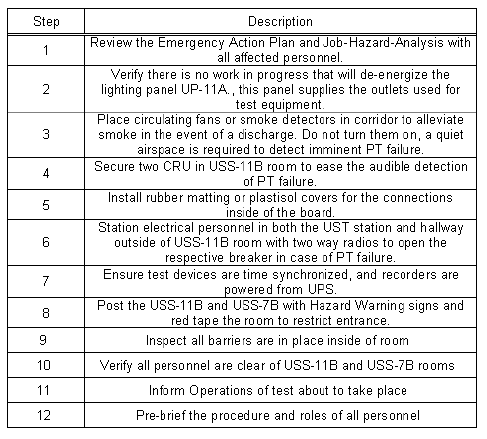
To perform this test, the specialized test equipment was installed at USS-11B. The installation of these devices significantly changed the hazard in the area. Specialized pretest briefings were implemented to verify all participants were aware of their roles, as well as the hazards of the test procedure. Additionally, steps were implemented to isolate the USS-11B from USS-7B. This simplified the test and the model. Table II gives the most important prerequisites and precautions.
TABLE I. EQUIPMENT FOR SWITCHING TRANSIENTS MEASUREMENTS
TABLE II. TEST PREREQUISITES AND PRECAUTIONS
D. Test Procedures to Assure Testing will not Fail the PT or 3 MVA transformer (sneak up on problem)
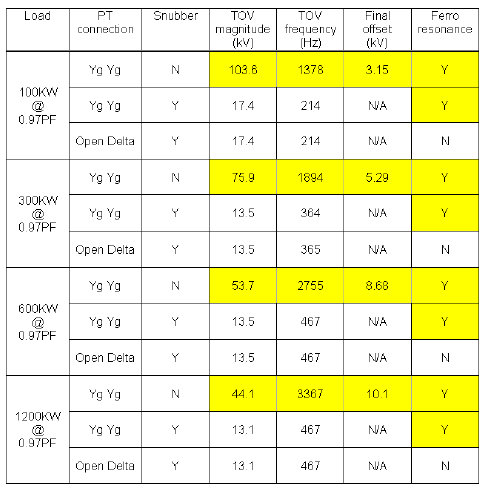
A testing scheme was developed to create individual breaker closing and opening electrical transients at four discrete load levels on USS-11B: 1200, 600, 300 and 100 kW. These events were evaluated by all parties involved, and concurrence was given to proceed to the next test step. This test was designed to approach the potentially more damaging conditions in a deliberate manner. Prior to conducting the actual tests, each test condition was simulated in EMTP. Table III summarizes the results of the simulations of the test conditions. As can be seen in the results, as the load level on the transformer was reduced, the severity of the switching transient overvoltage, ring frequency and ferroresonance condition increased. This advance knowledge of the system response enabled careful tracking of the field test results. Should the field results depart dramatically from the predicted response, the test could be stopped. In this way, it was possible to “sneak-up” on the problem.
E. Confirmed Problem Existed
Testing began with no snubbers and the 1200 kW load and proceeded down to the 300 kW load. The test sequences prior to the snubber installation were terminated at this point at the concurrence of the design engineers, facility operators and the authors because the symptoms of TOVs and dV/dt were worsening with each lower load increment. Fig. 12 shows the worst of transient overvoltage captured at the PT. All parties were satisfied the root cause of the PT failure was determined without actually failing a PT. Next, the snubbers were installed, and the captured screen shot of Fig. 14 was obtained when utility feeder NM-1 was opened at 300 kW load. The snubbers eliminated the dV/dt transient response, and no TOVs occurred at the PTs as shown in the voltage waveforms of Fig. 14. All parties involved were satisfied the snubber was effective in mitigating both the dV/dt and TOV problem. The client was confident that system reliability would not be compromised.
IV. SOLUTIONS
TABLE III. SUMMARY OF TEST CONDITION SIMULATIONS
Given that the facility was in the final stages of commissioning, a solution had to be both economical and timely. Using this criteria, three technically sound solutions were proposed and evaluated. Ultimately two of three proposed solutions were implemented as explained below.
A. Change to Different PT Connections (rejected)
The PTs that failed were connected Yg-Yg. In fact, all of the PTs on the 13.2 kV circuits were of the same configuration. The analysis has shown the benefit of the open-delta PT over the Yg-Yg PT, even when the snubber is applied in both configurations. With the open delta PT, the ferroresonance was completely eliminated. However, with the Yg-Yg PT ferroresonance of about 20 Hz persists. The authors discussed replacing the existing the Yg-Yg PTs with open delta PTs. However, it became apparent this would be cost prohibitive for several reasons: 1) the relays would have to be changed, 2) the metering would have to be changed, 3) the commissioning would have to be repeated because the commissioning was in the final stages, and 4), the project was nearly completed and such a change-out would add significant delay. For these reasons, the possibility of changing to different PT connections was rejected.
B. Tie Ground Mats Together (implemented)
As explained, the different ground mats, i.e. utility substation ground grid and generation plant ground grid were not tied together resulting in transferred earth potentials. Such transferred earth potentials would occur during switching and lightning, imposing a potential difference on such components as surge arresters, cable shields and Yg-Yg PTs. One solution was to increase the insulation strength of the affected equipment. Another option was to tie the ground mats together. The former option would require replacement of equipment which was undesirable for many of the same reasons mentioned in regard to changing the PT connections. The latter option required minimal investment in an equipment grounding conductor (EGC) and the labor to install the EGC. For these reasons, the authors recommended tying the ground mats together to minimize the transferred earth potential. An EGC was installed outside the conduit runs between the utility substation and the generation plant, and the EGC was bonded to the corresponding ground mats.
C. Add Snubbers as Study Dictated (implemented)
The study showed that the application of the snubber circuit greatly reduced the transient overvoltage magnitude and oscillation frequency at the 13.2 kV PT and Transformer T-8B primary winding. The resistor in the snubber circuit damped the oscillation and reduced the DC offset of the transient overvoltage to within acceptable levels. Further, the study showed the snubber reduced the ferroresonance of the Yg-Yg PT by providing a source of damping that would otherwise not be present. The snubber, in combination with the existing surge arrester, provided the maximum surge protection for the PT and the Transformer T-8B. The snubber components were of relatively low cost and readily available. The snubbers did not require any modifications to the PT circuit, relaying or meters. The performance of the snubbers was proved by measurements and did not require repeating the commissioning tests. For these reasons, it was decided to install the snubbers.
D. Prove Solution with After-the-Fact Measurements
Following installation of the snubbers, power quality measurements were taken to ensure the proper operation of the snubbers. A high speed power quality meter and capacitive voltage dividers were used to measure the transient overvoltage waveforms at the PT and transformer primary produced during switching of the primary vacuum circuit breaker. The voltage dividers were made of capacitive and resistive components with a bandwidth of 10 MHz. The power quality meter was capable of transient voltage waveshape sampling, 8000 Vpeak full scale, 200 nsec sample resolution (5 MHz sampling). This test equipment ensured accurate capture of the high frequency transients. The measurements verified the waveforms did not exhibit excessive high frequency transients (magnitude, rate-ofrise and frequency). The measurements also verified the PT ferroresonance condition was damped-out.
E. Typical Snubber Installation
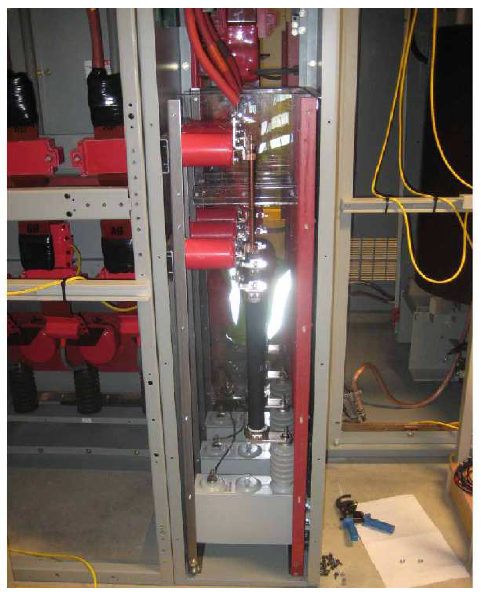
Fig. 15 shows the side view of the custom snubber circuit. The custom design was required to fit the snubber in the bottom of the transition section, between the No. 3 breaker section and the transformer. The snubber was field installed in the bottom of the transition section. The surge capacitor serves as the base. The resistor is bonded to the surge capacitor bushing and the bus bar, where the cables to the transformer are secured. The flanges on each end of the resistor provide a solid support for the fragile resistors. The capacitor was grounded to the ground bus through a flat-braided highly-stranded strap. The snubber was treated like a lightning arrester, i.e., no fuse was installed.
V. CONCLUSIONS
This paper provided a detailed investigation of several PTs that failed catastrophically during switching medium voltage circuit breakers to transition from utility to generator. Switching transient simulations and field measurements determined the root cause of PT failure was ferroresonance as well as switching transient overvoltages associated with opening and closing the primary vacuum breakers. The analysis determined that the close coupled power transformers were also in jeopardy. The study showed that the application of the snubber circuit greatly reduced the transient overvoltage magnitude and oscillation frequency at the PT and power transformer primary winding. The resistor in the snubber circuit damped the oscillation and reduced the DC offset of the transient overvoltage to within acceptable levels. Further, the study showed the snubber reduced the ferroresonance of the Yg-Yg PT by providing a source of damping that would otherwise not be present. Also, grounding improvements were made by tying together the ground mats in the utility substation and generator plant, to minimize the transferred earth potentials imposed on the PT primary winding. High speed switching transient measurements verified the analysis and proved the surge protective devices solution (arresters and snubbers) were effective.
VI. ACKNOWLEDGMENTS The authors wish to thank Turner Facilities Management Solutions as well as Eaton Power Systems Engineering for their collaboration in the presentation of this work: Dan Wilder, Tim McConnell, and Rashad Hammoudeh of Turner as well as Bill Vilcheck of Eaton. Additionally, we thank Scott Seaton.
REFERENCES
[1] IEEE Standard Dictionary of Electrical and Electronics Terms, ANSI/IEEE Std 100-1984.
[2] Hopkinson, R.H., “Ferroresonant Overvoltage’s Due to Open Conductors,” General Electric, 1967, pp. 3 – 6.
[3] Westinghouse Distribution Transformer Guide, Westinghouse Electric Corp., Distribution Transformer Division, Athens, GA, June 1979, revised April 1986, Chapter 4 Ferroresonance, pp. 36 – 40.
[4] IEEE Guide for Application of Transformers, ANSI/IEEE C57.105-1978, Chapter 7 Ferroresonance, pp. 22 – 28.
[5] Distribution Technical Guide, Ontario Hydro, Ontario, Canada, May1999, original issue May 1978, pp. 72.1-1 – 72.1-10.
[6] Greenwood, A., “ Electrical Transients in Power Systems”, Wiley & Sons, 1971, pp. 91-93.
[7] Kojovic, L., Bonner, A., “Ferroresonance – Culprit and Scapegoat”, Cooper Power Systems, The Line, December 1998.
[8] Shipp, Dionise, Lorch and MacFarlane, “Transformer Failure Due to Circuit Breaker Induced Switching Transients”, IEEE Transactions on Industry Applications, April/May 2011.
[9] ANSI/IEEE, A Guide to Describe the Occurrence and Mitigation of Switching Transients Induced By Transformer And Switching Device Interaction, C57.142-Draft.
[10] D. Shipp, R. Hoerauf, “Characteristics and Applications of Various Arc Interrupting Methods,” IEEE Transactions Industry Applications, vol 27, pp 849-861, Sep/Oct 1991.
[11] ANSI/IEEE, Standard for AC High-Voltage Generator Circuit Breakers on a Symmetrical Current Basis, C37.013-1997.
[12] ANSI/IEEE, Application Guide for Transient Recovery Voltage for AC High-Voltage Circuit Breakers, C37.011-2005.
[13] D. Durocher, “Considerations in Unit Substation Design to Optimize Reliability and Electrical Workplace Safety”, ESW2010-3, 2010 IEEE IAS Electrical Safety Workshop, Memphis.
[14] D. Shipp, N. Nichols “Designing to Avoid Hazardous Transferred Earth Potentials,” IEEE Transactions Industry Applications, July/August 1982.
[15] Shipp, Dionise, Lorch and MacFarlane, “Vacuum Circuit Breaker Switching Transients During Switching of an LMF Transformer”, IEEE Transactions on Industry Applications, January/February 2012.
APPENDIX Table IV gives an excerpt from the Sequence of Operation testing that was being performed when the first Unit Sub Station had an event where a Potential Transformer (PT) had a failure. The PT failure occurred during the performance of Step #32 described in the table below.
TABLE IV. SEQUENCE OF OPERATION TESTING
Source & Publisher Item Identifier: 48th IEEE Industrial & Commercial Power Systems Conference. DOI: 10.1109/ICPS.2012.6229608