Published by 1. Aleksander CHUDY1, 2. Paweł MAZUREK1, 3. Korneliusz PAWLAK2, Lublin University of Technology (1), Ball Packaging Europe Lublin Sp. z o.o. (2) ORCID: 1. 0000-0002-3183-8450, 2. 0000-0002-7098-2084
Abstract. In the present study, power quality parameters across two residential blocks, a single-family house, and an industrial facility were studied and evaluated. Compliance was generally satisfactory, with occasional voltage harmonic exceedances in residential and industrial areas and exceedances in THDV and long-term flicker perceptibility in the industrial setting, highlighting the need for continued monitoring and potential mitigation strategies.
Streszczenie. W badaniu dokonano oceny parametrów jakości energii elektrycznej w dwóch blokach mieszkalnych, domu jednorodzinnym oraz obiekcie przemysłowym. Zgodność była zadowalająca, choć sporadyczne przekroczenia harmonicznych w obszarach mieszkalnych oraz krótkotrwałe przekroczenia THDV i współczynnika długotrwałego migotania światła obiekcie przemysłowym podkreślają konieczność ciągłego monitorowania i potencjalnych strategii łagodzących. (Analiza parametrów jakości energii w obiektach przyłączonych do miejskiej sieci elektroenergetycznej)
Keywords: power quality, residential power supply, industrial power supply, harmonic distortion
Słowa kluczowe: jakość energii, zasilanie budynków mieszkalnych, dystrybucja energii dla przemysłu, zniekształcenia harmoniczne
Introduction
Nowadays, the necessity for reliable and high-quality power is vital across various sectors, ranging from residential to industrial settings. Ensuring the stability and efficiency of power supply networks is essential to satisfy the demands of occupants and sustain the productivity of industrial facilities [1, 2]. With this necessity in mind, this study gives an analysis of power quality parameters in networks providing apartment blocks, a single-family house, and an industrial facility.
For apartment blocks, the primary concern often revolves around managing diverse and fluctuating loads from multiple units within the same building. Issues such as harmonic distortion, voltage fluctuations, and power factor imbalance can arise due to the collective impact of various appliances and equipment used by residents [3].
In single-family houses, while the scale may be smaller compared to apartment blocks, similar concerns regarding load diversity and quality persist. Additionally, factors such as renewable energy integration, electric vehicle charging, and smart home technologies further complicate the energy quality landscape. Addressing these complexities requires tailored approaches to monitoring, analysis, and mitigation strategies [4].
Industrial facilities present a distinct set of challenges, often characterized by high-power loads, sensitive equipment, and stringent reliability requirements. Energy quality issues such as voltage sags, transients, and power interruptions can have significant operational and financial implications for these establishments. Therefore, comprehensive analysis of power quality parameters Is essential to minimize downtime, enhance productivity, and ensure regulatory compliance.
Furthermore, advancements in technology and regulatory frameworks play a crucial role in shaping the landscape of power quality management. The recent changes in Polish regulations regarding power quality parameters limits were introduced in Regulation of the Minister of Climate and Environment of 22 March 2023 on detailed conditions for the operation of the power system [5] partially based on the PN-EN 50160 standard. These updates replaced the previous regulation from 2007, reflecting ongoing efforts to ensure the effectiveness and relevance of standards within the power distribution sector. From this point forward in the article, the term regulation will refer to the 2023 regulation. Integration of renewable energy sources, deployment of smart grid technologies, and adherence to stringent quality standards are integral components of modern power supply networks.
The study [6] monitored and analysed various power quality parameters in a typical commercial building with non-linear loads like computers, printers, and compact fluorescent lamps. The proliferation of non-linear loads their harmonic current injections was identified as the root cause behind most of the major power quality issues observed.
In [3] issues such as voltage/current unbalance, harmonics, and power factor in residential loads (lights, fans, AC/DC drives) and a real-time system with multiple single-phase AC servo motors were analysed. Experimental results showed significant voltage unbalance, current total harmonic distortion (THDi) reaching 120%, and poor power factors ranging from 0.25 to 0.75 due to the non-linear nature of the loads. The authors highlighted the need for mitigation techniques like active power filters to reduce harmonics and improve power quality when operating multiple non-linear household/industrial loads.
The study [4] presents one-minute resolution measurements of voltage, THDi, active/apparent power, and power factor for 17 common household appliances like lights, fans, AC units, washing machines. Key results include maximum THDi reaching 120%, THDV up to 3%, and poor power factors from 0.25 to 0.8 across different residential loads.
Methodology
Measurements of power quality parameters were carried out using different devices and lengths of averaging time for each kind of location.
a) Residential Blocks
Power quality measurements were undertaken utilizing the Sonel PQM-711 power quality analyser equipped with F-5A current clamps. The measurements encompassed a distribution transformer serving two residential blocks in lubelskie voivodeship, each comprising 77 flats. Opting for a measurement duration of 2 days, an averaging time of 3 seconds was implemented to enable the analysis of current harmonics in compliance with the IEEE 519-2022 standard.
b) Single-Family House
The power quality measurements were conducted using the Chauvin Arnoux 8336 power quality analyser paired with MA193 current clamps. Given the lower complexity of the load profile, the measurements were conducted for a duration of 4 hours. The averaging time for measurements was set to 1 minute to achieve a balance between obtaining detailed data and decreasing measurement duration.
c) Industrial Facility:
The power quality measurements were conducted within an industrial facility located in Lublin, part of the city’s economic zone. The facility, established in 2008, initially intended to produce food cans but later shifted its focus to manufacturing aluminium lids. The production process is highly automated. High-tech components such as PLC controllers, frequency converters, servo drives, and realtime plant visualization systems are integral to the production modules.
The measurements were performed using the Sonel PQM-711 power quality analyser. Due to the higher complexity of the industrial load and the need for comprehensive data collection, the measurements were conducted over a two-week period. The averaging time for measurements was set to 10 minutes.
During the first week, the measurements were exclusively performed at substation R4, while in the second week, attention shifted to substation R2. Substation R4 serves critical functions, including powering machinery supporting the third production module and supplying compressor with a capacity of 200 kW. Additionally, it provides power to another substation, responsible for one of the production modules. On the other hand, substation R2 is tasked with powering essential systems for facility maintenance, such as internal and external lighting, server rooms, UPS emergency power supplies, cooling for production presses, heaters, ventilation, waste disposal presses, and other 2 compressors each with a capacity of 200 kW.
The Sonel PQM-711 analyser adheres to the IEC 61000-4-30 Class A standard, while the Chauvin Arnoux 8336 analyser complies with the IEC 61000-4-30 Class B standard.
These specific measurement setups and durations enabled for complete investigation of power quality parameters in varied circumstances, guaranteeing reliable data collection and valuable insights into the functioning of the individual power supply networks.
Results
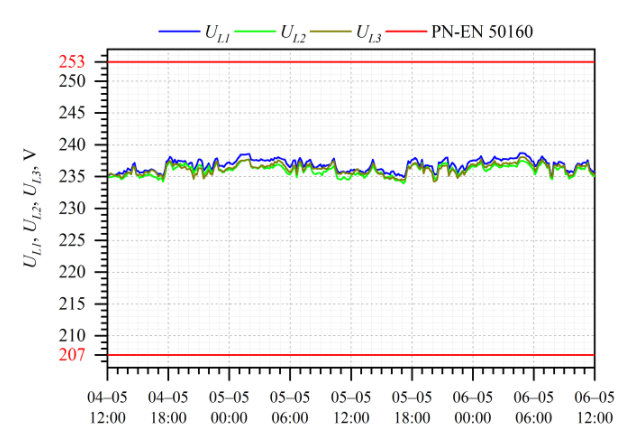
a) Phase voltage profile and voltage unbalance The voltage profile diagram (Fig. 1.) shows the RMS voltage values for the three phases (UL1, UL2, and UL3) over a two-day period concerning residential blocks. The red lines in the diagram represent the voltage limits specified by the PN-EN 50160 standard, which allows for a ±10% deviation from the nominal voltage of 230V. Based on the diagram, the voltage values for all three phases remain within the upper and lower limit, indicating that the voltage magnitudes comply with the PN-EN 50160 standard requirements.
In each graph presented within this article, the red line serves as a clear indicator of the permissible values defined in the PN-EN 50160 standard.
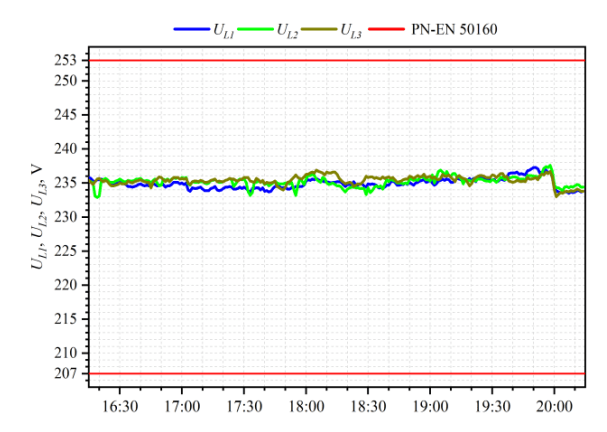
The RMS voltage profile measured at a switchboard in a single-family house over a 4-hour period is presented in Figure 2. The highest peaks are around 235–237 V for all three phases (maximum value: 237.6 V, phase L2) which is still within the PN-EN 50160 standard limit. The lowest measured voltage value was 232.9 V for phase L2.
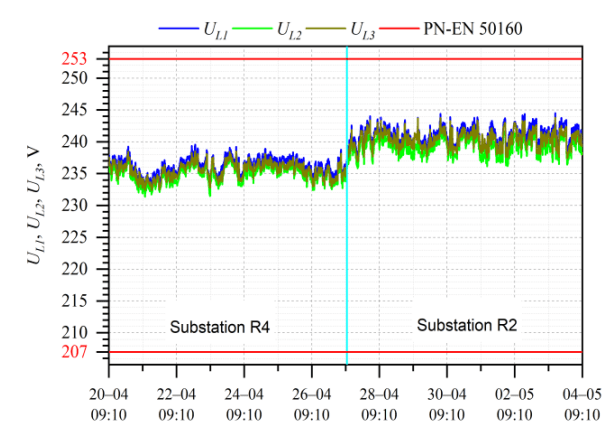
Figure 3 illustrates voltage fluctuations measured in distribution substations R4 and R2. The cyan line demarcates the division between measurements from substations R4 and R2. For distribution substation R4, the RMS voltage fluctuates between a minimum of 232 V and a maximum of 242 V meeting regulatory requirements. In the case of distribution substation R2, the RMS voltage ranges from a minimum of 235 V to a maximum of 246 V.
The 95th percentile of voltage unbalance factor was found to be 0.29%, 0.33%, and 0.31%/0.31% for the residential blocks, single-family house, and industrial facility (R4/R2), respectively. This indicates that the measured voltage unbalance falls well within the limits established by the PN-EN 50160 standard.
b) Total harmonic distortion of voltage
The 95th percentile values for phases L1, L2, and L3 were obtained for the distribution substation supplying two residential blocks and the switchboard at a single-family house. Additionally, diagrams illustrating THDV levels were provided for the industrial facility.
At the distribution substation supplying two residential blocks, THDV levels were within acceptable limits according to limit established by PN-EN 51060 standard. The 95th percentile values for phases L1, L2, and L3 were 2.86%, 2.66%, and 2.95%, respectively. Similarly, the THDV measurements at the switchboard of the single-family house indicated relatively low levels of harmonic distortion, with 95th percentile values of 2.2%, 2.1%, and 2.0% for phases L1, L2, and L3, respectively.
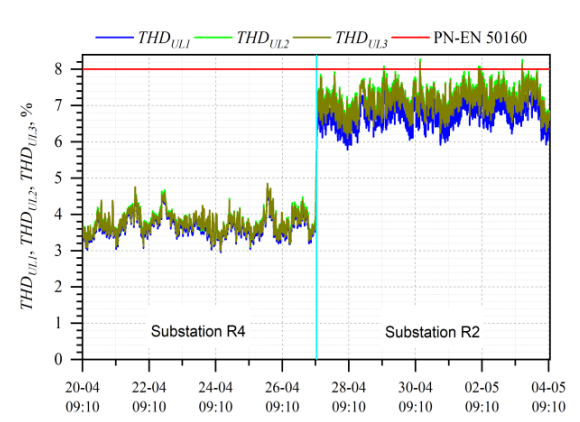
For the industrial facility, analysis of THDV revealed noteworthy findings. At substation R4, THDV values ranged from a minimum of 2.75% to a maximum of 5%. The values of 95th percentile were 4.23%, 4.34%, 4.32% for phases L1, L2 and L3, respectively. Well within the criteria specified in the previously mentioned standard (8%). Conversely, substation R2 exhibited significantly higher THDV values, the values of 95th percentile were 7,28%, 7,77%, 7,68%. Disturbances introduced by frequency converters and electric motors were observed in substation R4, while anomalies from energy-efficient LED lighting throughout the facility were noted in substation R2.
Figure 4 presents THDV levels at the distribution substations at the industrial facility.
c) Voltage harmonics
One significant change introduced by the 2023 regulation [5] is the requirement to analyse voltage harmonics up to the 50th harmonic order, doubling the previous scope of analysis which only extended to the 25th harmonic. This expanded scope reflects advancements in power system monitoring and the recognition of the impact of higher-order harmonics on system performance and equipment operation.
By extending the analysis to the 50th harmonic order, a more comprehensive assessment of voltage harmonics can be achieved, enabling a deeper understanding of potential harmonic distortion effects on the power supply network. This enhanced analysis is essential for ensuring compliance with regulatory standards, optimizing power system performance, and mitigating risks associated with harmonic distortion.
At a distribution substation supplying two residential blocks it was observed that the 15th harmonic order for phase L3 exceeded the prescribed limit of 0.5%. The measurements revealed 95th percentile values of 0.5%, 0.41%, and 0.55% for phases L1, L2, and L3, respectively. The examination revealed no additional exceedances beyond the 15th harmonic order, with the 5th and 7th harmonics emerging as the most prominent. Figure 5 depicts voltage harmonic values from the 2nd to the 25th order. Harmonic values from the 26th to the 50th order were negligible, warranting their exclusion from further analysis.
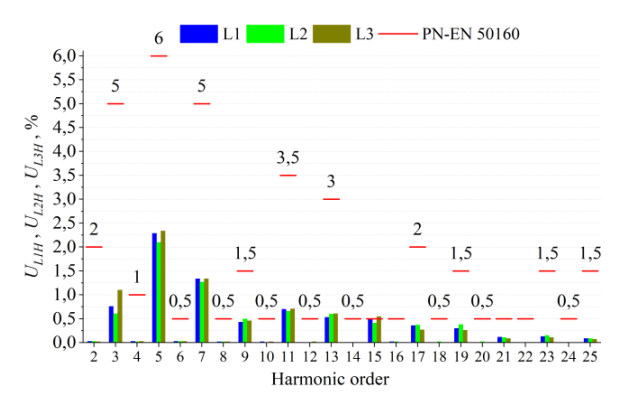
In the single-family house, values of voltage harmonics across phases were below standard thresholds. For instance, the 3rd harmonic showed values of 1%, 0.6%, and 0.6% across phases L1, L2, and L3, respectively, below the limit of 5%. Similarly, the 5th harmonic displayed values of 1.5%, 1.6%, and 1.6%, below the limit of 6%. Harmonics like the 7th, 9th, and 11th also stayed within acceptable limits, with slight variations across phases. Voltage harmonics values beyond the 15th order up to the 50th were negligible, indicating minimal impact on power quality.
At substation R2, the 95th percentile values for the 5th harmonic across phases L1, L2, and L3 were 6.09%, 6.56%, and 6.38%, respectively, exceeding the specified limit of 6%. This indicates a potential issue with power quality at the substation that warrants further investigation and mitigation measures. However, at substation R4, the corresponding values were 3.67%, 3.84%, and 3.81%. Further analysis identified the most dominant voltage harmonics observed, including the 5th, 7th, 9th, 11th, 13th, 17th, 19th, 23rd, and 25th harmonics. Despite variations in their magnitudes, all of these harmonics remained within the specified limits, indicating satisfactory power quality conditions at the industrial facility.
d) Long-term flicker perceptibility
At the distribution substation supplying two residential blocks, the 95th percentile PLT values for phases L1, L2, and L3 were 0.6, 0.31, and 0.3 respectively, all falling within the limit (1) of PN-EN 50160 standard.
At a single-family house switchboard, the 95th percentile PLT values for the same phases were observed to be 0.82, 0.88, and 0.81, also adhering to the standard. At this point, the PLT calculation was updated in a two-hour window every 10 minutes due to the short duration of measurement, with most values falling within the range of 0.3 to 0.45.
In the industrial facility, the PLT values fluctuated mostly within the range of 0.3 to 0.45 phases L1, L2, and L3, respectively. However, it is worth mentioning that two events occurred where the PLT value exceeded 1, with one event recorded at substation R4 (1.34 – phase L2) and another at substation R2 (1.39 – phase L3). Nevertheless, it did not cause non-compliance with the PN-EN 50160 standard.
e) Power frequency
In all points of measurement – the values of power frequency were well within the acceptable limits with a significant margin of the limit (50 Hz ± 1%). Therefore, further consideration of this parameter is deemed unnecessary for the analysis in this article. The 99.5th percentiles for frequency were measured as 50.03 Hz, 50.04 Hz, and 50.03 Hz for residential blocks, single-family house, and industrial facility, respectively, reaffirming the stability of the parameter.
f) Current harmonics
In the assessment conducted for the case involving two residential blocks, an analysis of current harmonics was undertaken. While the PN-EN 50160 standard and the regulation do not explicitly address current harmonics, the requirements outlined in IEEE 519-2022 were employed.
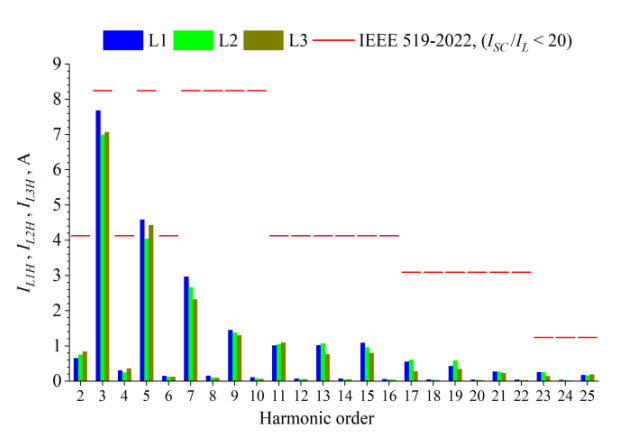
The analysis was divided into two separate periods of 24 hours each to analyse variations in load profiles. The daily limits specified for the short-circuit current (ISC) to the maximum demand load current (IL) ratio less than 20 were considered (99th percentiles values; very short time, 3 s, harmonic currents). The maximum demand load current was determined as the highest average fundamental current across all recorded current channels during the measurement period (103.1 A). The values of the 99th percentiles of current harmonics for the 3rd harmonic were recorded as 7.69 A, 7 A, and 7.07 A for phases L1, L2, and L3, respectively.
These values were compared against the IEEE 519-2022 limit of 8.25 A, which corresponds to 8% of IL. These measurements approached the limit, particularly in the case of phase L1, indicating a potential proximity to the threshold for acceptable harmonic distortion. Further examination revealed that the remaining values of 99th percentiles across the harmonic spectrum were lower, with significant decreases observed, especially in the 26th to 50th order region.
Figure 6 presents the 99th percentile values of current harmonics recorded during the first 24 hours of measurements.
Conclusions
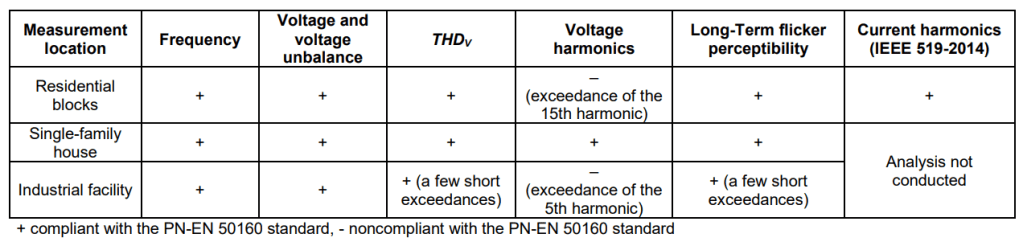
In summary, the power quality assessment across residential blocks, the single-family house, and the industrial facility reveals satisfactory compliance in most parameters. However, the presence of the 15th voltage harmonic exceedance in residential blocks and the 5th voltage harmonic in the industrial facility, as well as occasional short exceedances in THDV and long-term flicker perceptibility in the industrial facility, warrant further attention. Table 1 presents the compliance status of each parameter, emphasizing the need for ongoing monitoring and potential mitigation strategies to ensure sustained power quality.
Table 1. Power quality parameters assessment (results by location)
This work was supported by Lublin University of Technology grant no. FD-20/EE-2/403.
REFERENCES
[1] Chudy A., Mazurek P., Electromobility – the Importance ofPower Quality and Environmental Sustainability, Journal of Ecological Engineering, 20 (2019), No. 10
[2] Chudy A., Hołyszko P., Mazurek P., Fast Charging of an Electric Bus Fleet and Its Impact on the Power Quality Based on On-Site Measurements, Energies, 15 (2022), Nr 15, p. 5555
[3] Thentral T. T., Palanisamy R., Usha S., Bajaj M., Zawbaa H. M., Kamel S., Analysis of Power Quality issues of different types of household applications, Energy Reports, 8 (2022), 5370-5386
[4] Garabitos Lara E., Electrical dataset of household appliances in operation in one apartment, Data in Brief, 51 (2023)
[5] Minister of Climate and Environment. Regulation of the Minister of Climate and Environment of 22 March 2023 on detailed conditions for the operation of the power system, 2023
[6] Ojo A., Awodele K., Sebitosi A., Power Quality Monitoring and Assessment of a Typical Commercial Building. In: 2019 IEEE AFRICON; IEEE, 92019, 1-6
Author: dr inż. Aleksander Chudy, dr inż. Paweł Mazurek, Department of Electrical Engineering and Smart Technologies, Lublin University of Technology, Nadbystrzycka Street 38A, 20-618 Lublin, e-mail: a.chudy@pollub.pl, p.mazurek@pollub.pl; mgr inż. Korneliusz Pawlak, Ball Packaging Europe Lublin Sp. z o
Source & Publisher Item Identifier: PRZEGLĄD ELEKTROTECHNICZNY, ISSN 0033-2097, R. 101 NR 2/2025. PRZEGLĄD ELEKTROTECHNICZNY, ISSN 0033-2097, R. 101 NR 2/2025

