Published by Marta BĄTKIEWICZ-PANTUŁA, Wrocław University of Science and Technology. ORCID: 0000-0002-1628-1818
Abstract. Receivers such as power electronic devices, due to their widespread use and non-linear characteristics, are the most common cause of poor quality electricity. The share of non-linear receivers in the overall balance of power installed at a single customer increased to the level that the power supply voltage was affected by such phenomena as: overload of the neutral conductor, higher harmonics, and asymmetry. The article presents the assessment of electricity quality parameters based on measurements carried out at consumers. The assessment was based on the Regulation of the Minister of Economy of. May 4, 2007. On the detailed conditions for the operation of the power system and the PN-EN 50160: 2010 standard – Parameters of the supply voltage in public power networks. The analysis was carried out on the example of real measurements of electricity quality parameters. The assessment of electricity quality parameters was carried out on the basis of the analyzes discussed.
Streszczenie. Odbiorniki jakimi są urządzenia energoelektroniczne ze względu na swoje powszechne zastosowanie i charakterystykę nieliniowa są najczęstszą przyczyna złej jakości energii elektrycznej. Udział odbiorników nieliniowych w ogólnym bilansie mocy zainstalowanej u pojedynczego odbiorcy wzrósł do poziomu, że w napięciu zasilającym pojawiły się zjawiska takiej jak: przeciążenie przewodu neutralnego, wyższe harmoniczne, asymetria. W artykule zaprezentowano ocenę parametrów jakości energii elektrycznej pozyskiwaną od odbiorców. Ocena została oparta na Rozporządzeniu Ministra Gospodarki z dnia. 4 maja 2007 r. W sprawie szczegółowych warunków funkcjonowania systemu elektroenergetycznego i normy PN-EN 50160: 2010 – Parametry napięcia zasilającego w publicznych sieciach elektroenergetycznych . Analiza została przeprowadzona na przykładzie rzeczywistych pomiarów parametrów jakości energii elektrycznej. Ocena parametrów jakości energii elektrycznej została przeprowadzona na podstawie omówionych analiz (Zakłócenia występujące w instalacji elektrycznej, ze szczególnym uwzględnieniem negatywnego oddziaływania odbiorników nieliniowych na sieć zasilającą).
Keywords: power quality, non-linear loads, negative impact on the electricity grid
Słowa kluczowe: jakość energii elektrycznej, odbiorniki nieliniowe, negatywny wpływ na sieć
Introduction
The power quality is a concept that is difficult to define. This is due to how electricity is defined. It can be defined as a physical phenomenon resulting from the transformation of energy from e.g. mechanical, thermal or chemical form into electricity, or it can be understood as a commodity, a product that can be produced and sold to recipients who need this energy [1]. And it is in this aspect that the power quality is usually defined because each product, through its physical properties, should be able to determine whether it is good or not. The definition of electricity quality also depends on the entity that describes it. Different meanings of quality will be defined by electricity suppliers, different by manufacturers of electronic equipment, and still different by electricity consumers, because everyone has their own individual needs regarding this issue [2].
Currently, the most accurate description of the power quality is the definition proposed by the Advisory Committee on Electromagnetic Compatibility IEC, which says that the power quality is the parameters that describe the properties of electricity supplied to the consumer during normal operation [3]. They determine the continuity of the supply, i.e. short and long interruptions in the supply, and describe the supply voltage, namely its value, asymmetry, frequency and shape of the waveform.
The power quality in question is not only dependent on the power supply conditions, but also on the electronic equipment used, which may be more or less susceptible to electromagnetic interference, and may also generate and send it into the grid. Therefore, for the poor power quality cannot be blamed solely on the service provider, because the quality of energy also depends on the manufacturers of electrical devices, which should comply with applicable standards and regulations, as well as on the user, who should use the equipment purchased in accordance with the attached instructions for use.
Power Quality Parameters
Charging The parameters characterizing the power quality include easily measurable quantities that can be parameterized and normalized [4]. These are:
• frequency,
• voltage changes,
• asymmetry,
• harmonics voltage.
All these parameters are standardized by the relevant normative documents, which include:
• EN 50160 Voltage characteristics of electricity supplied by public electricity networks [5].
• Regulation of the Minister of Economy of Poland dated. May 4, 2007 on detailed conditions of functioning of the power system (Journal of Laws of 29 May 2007, item 623) [6].
• Distribution Network Operation and Operation Manual applicable to a given distribution system operator.
The above legal acts normalize the permissible values of given parameters in normal conditions, in power connectors of consumers supplied from public power grids. The PN-EN 50160:2010 standard explains in detail what normal conditions mean, namely it describes them as a state of equilibrium in which the electrical energy demand is equal to the generated energy and switching operations are performed, and all disturbances are automatically removed by means of protection automation.
For the professional power industry, the biggest problem is to ensure the reliability of power supply [7]. The most sensitive to the poor quality of electric energy are recipients from industries such as:
• hospitals,
• airports,
• chemical industry,
• refineries,
• metallurgical industry,
• IT sector,
• plastics industry.
Depending on the type of facility, in the event of an unplanned failure, there may be threats in the form of material damage, e.g. damage to the installation, production losses, poor quality of the product, or human risk, e.g. damage to the health of employees and bystanders, and in extreme cases even death (chlorine, propylene/ethylene and other hazardous media), and environmental hazards, e.g. environmental pollution.
Receivers such as power electronic devices, due to their widespread use and non-linear characteristics, are the most common cause of poor quality electricity.
The share of non-linear receivers in the overall balance of installed power at a single customer increased to the level that the following phenomena appeared in the supply voltage:
• harmonics voltage,
• asymmetry,
• overload of the neutral conductor
The most common disturbances are harmonics of the supply voltage, therefore they will be discussed in the following paper.
On their example, the average levels of supply voltage disturbances encountered in the distribution network were discussed, starting from 110 kV voltage (point P1, Fig. 1) through medium voltage (point P2, Fig. 1) to low voltage (point P3, Fig. 1) in the city municipal network.
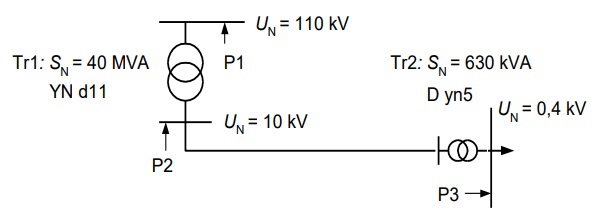
From the UN = 10 kV switching station, apart from the analyzed T2 transformer, also many other loads in the city municipal network were supplied, including the tram network converter station equipped with six-pulse rectifiers. The only building powered by the T2 transformer was a large office building.
Harmonics voltage in the supply
The main reason for the presence of higher harmonics in the supply voltage is the consumption of currents distorted from the sinusoidal waveform by non-linear receivers connected to the network. These currents cause the appearance of voltage drops on the elements of the transmission system not only for the fundamental harmonic, but also for the next higher harmonics of the current, as a result of which there is a distortion of the voltage at the considered supply point [8-10]. Standard [5,11,12] and regulation [6] specify the acceptable levels of harmonic content in such a way that they are calculated according to the relationship (1) up to h = 25 and according to (2) up to h = 40 as averaged values for a 10-minute time window .
The standard time for assessing the voltage quality according to [5] and [6] is 1 week, i.e. 1008 such 10-minute measurement sections.
The permissible levels are determined in such a way that for normal working conditions, during each week, 95% according to [5] and 100% according to [6] of measurements should not exceed the given limit values.
The measurement results presented in the paper are primarily intended to illustrate typical waveforms at various voltage levels (P1, P2, P3, Fig. 1) in the city municipal network.
Measurements on both sides of the T1 transformer (Fig. 1) were made as a simultaneous 4-day measurement, while the measurements in the low-voltage switchgear as a 1- week measurement at a different time than the high-voltage measurements.
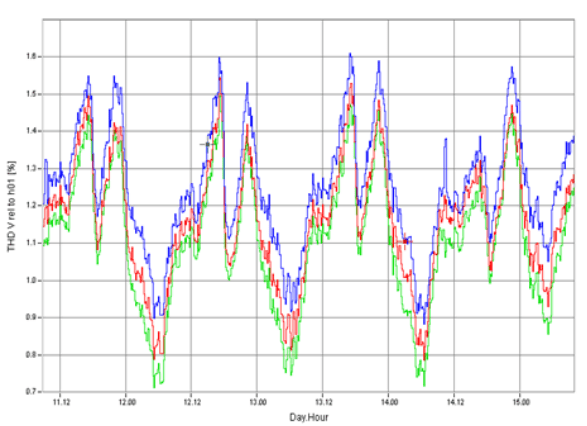
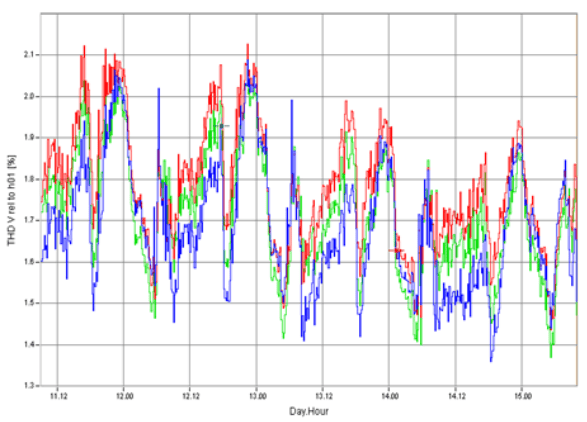
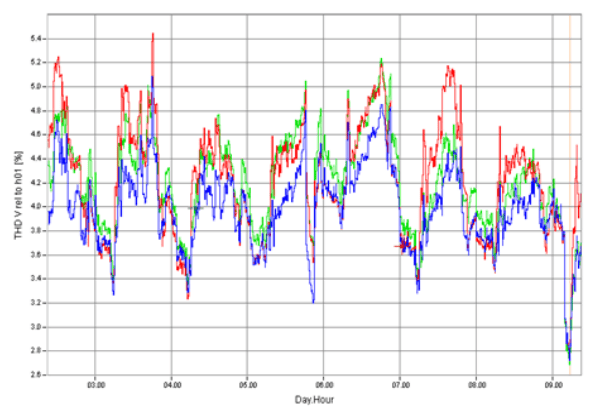
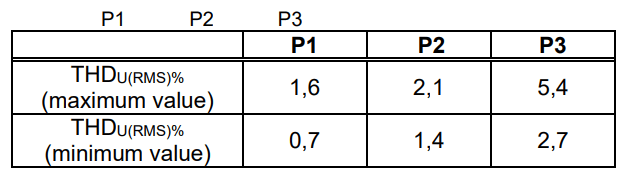
Fig.2,3,4 presents three waveforms of changes in the THDU(RMS)% coefficient, successively for points P1, P2 and P3 (Fig. 1). Approximate values of the range of changes of this indicator are listed in Table 1.
Table 1. Approximate ranges of coefficient changes THDu(rms)% for points P1, P2 i P3 (fig. 1)
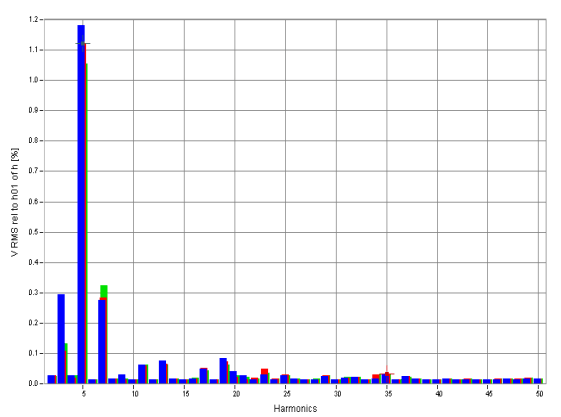
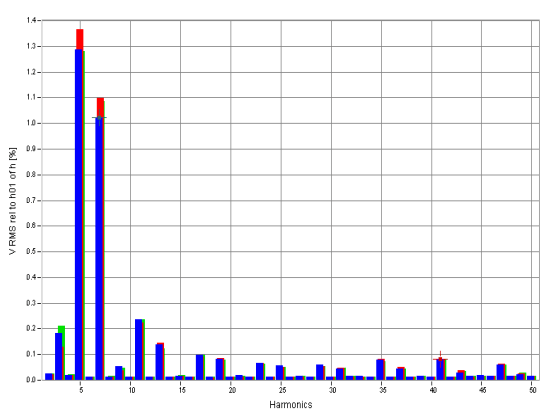
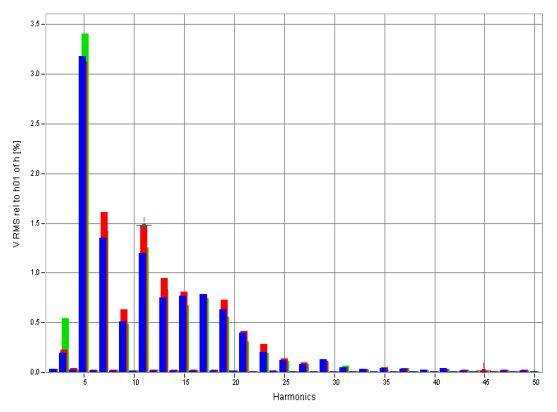
In turn, Figure 5,6,7 presents three spectra of voltage harmonics for points P1, P2 and P3, respectively.
The analysis of the presented waveforms allows to conclude that:
• the range of changes and values of the voltage distortion coefficient are the greatest for the supply network at the low voltage level, and decrease with increasing network voltage; it follows that the main source of voltage harmonics are non-linear low voltage receivers,
• in the 110 kV network harmonics of the 3rd, 5th and 7th order dominate, while at lower voltage levels the share of other harmonics is much larger; a kind of surprise is the higher harmonic level of the 3rd order in the 110 kV network than in the 10 kV network, despite the fact that the medium voltage winding of the T1 transformer is delta connected; it follows that the source of such a high level of the 3rd harmonic in the 110 kV network is not the loads in the 10 kV network, but the source is in the 110 kV network, e.g. it may result from earth current resulting from load asymmetry,
• the source of harmonics 5 and 7, clearly distinguishable in measurements at 10 kV voltage, is the converter station supplying the tram network, connected to this substation,
• characteristic daily changes of the coefficient are visible on all waveforms, however they differ depending on the voltage level; these differences are mainly due to the local nature of the supplied loads, which may be the subject of a separate, detailed analysis; the regularity of daily changes and the symmetry of the load of individual phases along with the decrease of the rated voltage of the network are characteristic; the minima of the runs fall on the night and late-afternoon hours, while the maxima on the evening and morning hours; these changes are related to daily load changes,
• the values of all measured parameters are within the acceptable levels specified in [3] and [4], except for the voltage of the 15th harmonic at point P3, which exceeded the permissible level of 0.5% and was 0.8%.
Summary
It is possible to observe the presence of higher harmonics in the presented waveforms, which distort the signal from the sine wave. With the exception of one harmonic, all parameters met the requirements of the standard. The reason for this is mainly converter devices, such as computer power supplies located in the building, as well as LED light sources that have replaced traditional light bulbs and are present in all rooms. Their construction is based on semiconductor elements such as thyristors, diodes, etc. whose task is to adjust the network parameters to such that the devices work properly, i.e. converting alternating voltage to constant and reducing its value in order to properly power supply. Another type of equipment causing visible interference is the high-powered motors installed to drive elevators that facilitate the movement of the building.
In order to eliminate poor quality electricity faster, a good solution is to use, among others:
• System for monitoring electricity quality parameters.
• Enabling the collection of statistical information about disturbances that occur in the plant. Each disruption entails greater or lesser financial losses.
• Recording and cost analysis of poor quality electricity – faster dispute and complaint resolution process.
• Application of more stringent requirements specified in the PN EN 50160 standard, in particular for two parameters, i.e. voltage dips and swells. Reducing or completely eliminating the problem of poor quality electricity should consist in:
• continuous measurement and analysis of electricity quality parameters – more measurement points,
• eliminating sources interfering with the operation of the system, e.g. by separating the circuit, adding receivers with high short-circuit power, applying good engineering practice,
• the use of appropriate devices for the designed conditions aimed at increasing the resistance of receivers to disturbances, e.g. by using input filters,
• limiting the impact of interference source emission by using passive or active filters, react
REFERENCES
[1] Kowalski.Z.: Power quality. Monographs of the Lodz University of Technologyj. Łódź 2007.
[2] Fuchs E., Masoum M.: Power Quality in Power Systems and Electrical Machines. Elsevier Inc., 2008. 205
[3] Z. Hanzelka, Quality of electricity supply, Krakow: Publisher AGH Krakow, 2013
[4] A.Klajn, M.Bątkiwicz-Pantuła, Application Note – Standard EN 50 160: Voltage characteristics of electricity supp
[5] EN 50160:2010. Voltage characteristics of electricity supplied by public electricity networks.
[6] Regulation of the Minister of Economy of Poland dated. May 4, 2007 on detailed conditions of functioning of the power system (Journal of Laws of 29 May 2007, item 623).
[7] Biernacik T., Skliński R. Negative impact of non-linear receivers on the power supply network and its reduction using passive filters of higher harmonics, Wiadomości Elektrotechniczne, 2020, R. 88, nr 11, 3-6
[8] Baggini A., Hanzelka Z., Voltage and Current Harmonic, Handbook of Power Quality, Whiley, 2008, 200-236
[9] Kamuda K., Klepacki D., Kuryło K., Sabat W. Statistical analysis of influence of the low-power non-linear loads on deformation of supply voltage, Przegląd Elektrotechniczny, R. 91 Nr 8/2015, 19-22
[10] Kuśmierek Z.: Harmonics in power systems, Przegląd Elektrotechniczny, 82 (2006), nr 6, 8-19
[11]PN-EN 61000-3-11:2020-01 Electromagnetic compatibility (EMC) – Part 3-11: Limits – Limitation of voltage variations, voltage fluctuations and flicker in public low-voltage power
supply networks – Equipment with a nominal current < or = 75 A subject to conditional connection
[12] PN-EN IEC 61000-3-2:2019 Electromagnetic compatibility (EMC) – Part 3-2: Limits – Limits for harmonic current emissions (phase supply current of the receiver ≤ 16 A)
Authors: dr inż. Marta Bątkiewicz-Pantuła, Wrocław University of Science and Technology, Faculty of Electrical Engineering, Power Electrical Department, ul. Wybrzeże Wyspiańskiego 27, 50-370 Wrocław, e-mail: marta.batkiewicz-pantula@pwr.edu.pl
Source & Publisher Item Identifier: PRZEGLĄD ELEKTROTECHNICZNY, ISSN 0033-2097, R. 101 NR 1/2025. doi:10.15199/48.2025.01.52

