Published by 1. Magdalena UDZIK1, 2. Krzysztof ŁOWCZOWSKI1, 3. Józef Jacek ZAWODNIAK2,
Politechnika Poznańska, Instytut Elektroenergetyki (1), Stowarzyszenie Elektryków Polskich Oddział Gorzowski (2) ORCID: 10000-0002-4959-2751.; 2. 0000-0002-4196-0492 Scopus: 3. 36620039300
Abstract. The article is the second part of the analysis of the impact of connecting PV sources to the low voltage distribution network on the risk of overloading the transformer station. Based on the simulations, the problem of overloading MV/LV transformers by connecting a large number of photovoltaic sources was characterized. The model was used to assess the degree of load of the distribution transformer for different values of its rated power. The results of the simulations and analyzes are presented in this article.
Streszczenie. Artykuł stanowi drugą część analizy wpływu przyłączenia źródeł PV do sieci dystrybucyjnej niskiego napięcia na ryzyko przeciążenia stacji transformatorowej. Na podstawie przeprowadzonych symulacji scharakteryzowano problem przeciążenia transformatorów SN/NN poprzez przyłączenie dużej liczby źródeł fotowoltaicznych. Model posłużył do oceny stopnia obciążenia transformatora rozdzielczego dla różnych wartości jego mocy znamionowej. Wyniki symulacji i analiz przedstawiono w niniejszym artykule. (Przyłączenie źródeł fotowoltaicznych do sieci dystrybucyjnej niskiego napięcia a ryzyko przeciążenia stacji transformatorowej. Część 2: Analiza symulacyjna).
Keywords: MV/LV transformer stations, photovoltaic home system, overloading transformers, distribution network
Słowa kluczowe: stacje transformatorowe SN/nN, przydomowe elektrownie PV, przeciążanie transformatorów, sieć dystrybucyjna
Introduction
This article is a second part of the analysis of the impact of connecting PV sources to the low voltage distribution network on the risk of overloading the MV/LV transformer station. Due to significant amount of material to be presented, the paper is divided into two parts.
The second part discusses the performed simulations and presents the analysis of the obtained results.
Micro-installations in Poland in numbers
The number of micro-installations in Poland is constantly growing, photovoltaics has become one of the fastest growing type of Renewable Energy Sources (RES). Each year brings new records in terms of the number of connected PV installations.
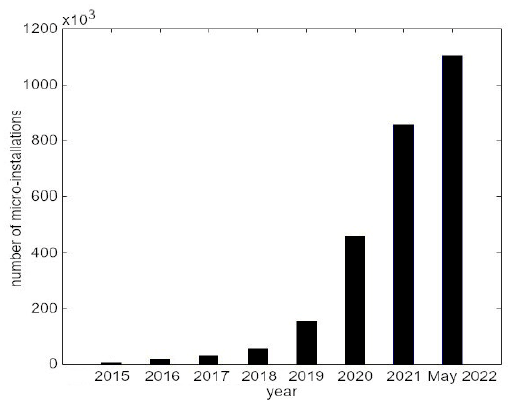
According to the report of the Polish Electricity Transmission and Distribution Association (PTPiREE) [1], at the end of 2021, nearly 854,000 micro-installations were connected to the grid in Poland, the source of which are almost 100% photovoltaic panels (exactly 99.19%). Only in 2021 alone, over 396,000 prosumers were connected to the network, almost twice as much as in previous years in total. The cumulative number of PV micro-installations in particular years is presented in Figure 1, the chart was compiled based on data from PTPiREE reports from individual years [1-7].
The total capacity of connected micro-installations in May 2022 was 8.177 GW So currently, the power of micro-installations connected by Distribution System Operators (DSO) already exceeds 7 GW, which, according to the assumptions of the “Poland’s Energy Policy until 2040” was to be achieved in 2030. The increase in the number of PV installations in Poland may soon be halted due to new regulations and the problem to adapt the current power infra-structure to bidirectional energy transmission. Another issue is the installation by prosumers of modules with a power significantly exceeding their demand and expanding installations without reporting them . More and more energy companies refuse to connect photovoltaic power plants or expand existing installations for this reason. A large number of micro-installations may cause overloading of network elements (lines, transformers) and excessive voltage increase – there are areas where PV installation inverters are turned off for this reason. On April 1, 2022, an amendment to the Energy Law [8] came into force, which introduces changes to the prosumers settlement system. The Discount System for PV Micro-installations was withdrawn. The new net-billing system, introduced from June 30, 2022, consists in selling energy at the price from the wholesale market of all prosumers and is consistent with the requirements of the EU directive regarding separate billing of energy introduced and taken from the grid. The proposed change reduces the profitability of investments in a home PV installation – prosumers buy energy from the operator at a price much higher than the selling price (at the peak of demand, the market price of energy is higher). The new system is more demanding for prosumers in terms of installation awareness and being an active participant in the PV market. On the other hand, it should increase the safety and stability of the power grid – abandoning the oversizing of installations, encouraging prosumers to increase the self-consumption of the PV energy, cessation of treating the network as a commonly available almost free, energy storage.
Influence of PV sources on MV / LV stations
A significant and rapid increase in the number of photovoltaic installations in the LV grid increases voltage asymmetry (especially when a large number of single-phase inverters are connected to one of the phases, even despite limiting the power of such an installation to 3.68 kW [9]) and exceeds the permissible voltage levels (voltage increases in grid nodes) in the period of the highest generation and low energy consumption electricity. The voltage drop in a line where no additional generation occurs can be expressed by the equations (1). In turn, equations (2) shows the dependence on the voltage drop in the line to which consumers with additional sources were connected, e.g. PV micro-installations (Fig. 2).

where: P2 is active and Q2 is reactive power of load, RL and XL are line parameters (for line LV XL = 0), UL is the line voltage.
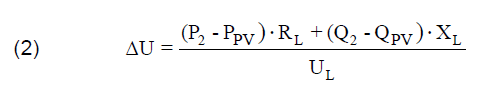
where: PPV is active and QPV is reactive power of PV source.

Excessive saturation of the grid with PV installations leads to the problem of reverse power flow. Changing the direction of the power flow in accordance with the above relationship and the Figure 2 causes a change in the sign of the voltage drop. The final voltage level will be determined by the superposition of the interactions of distributed sources and loads, so the sources will increase the voltage value, while the loads – its decrease. In the event of a significant difference between the production and consumption of energy, a situation may arise where a voltage higher than the voltage on the busbars of the supply station occurs at the point of power input. The greater the difference between the energy generated and consumed by the recipient, the greater the chance of exceeding the permissible voltage values.
The summary of energy produced by photovoltaic panels and energy consumed during the year for an example of a PV installation is shown in Figure 3. The electricity produced by photovoltaic sources depends on the value of insolation. When analyzing the chart, it is possible to notice overproduction in the summer months and a shortage of this energy in the winter. Additionally, in the period May-July the greatest differences between generated and consumed energy are visible. Pursuant to the regulations, prosumers connected before April 1, 2022 consume excess energy production in the winter months (settlement of prosumers producing energy in installations up to 10 kWp is settled in the ratio of 1 to 0.8 for larger installations, up to 50 kWp, in a ratio of 1 to 0.7 [8]), e.g. for heating purposes, which further complicates the operation of the network.

The Figure 4 shows the summary of the instantaneous power of the real PV installation and the power consumed during the day, the day with the highest energy export to the grid has been selected.

When analyzing the graph, it can be noticed that the largest amount of electricity is transferred to the LV grid between 11:00 and 15:00. The amount of energy generated by PV installations is difficult to predict due to the high unpredictability of weather conditions. In the case of connecting more photovoltaic installations to the same MV/LV transformer station, there is a risk of overloading the circuits of the station, the transformer installed in it and the line supplied from it due to the sum of the currents flowing through the transformer towards the MV network. Based on the above charts, it can be concluded that the greatest probability of such a situation occurs in the summer months in the midday hours. The problem of the influence of PV sources on the line load is described in [11].
Simulation analysis
Based on the characteristics of the low-voltage distribution network and the profiles of consumers and sources in the form of home photovoltaic installations, a simplified network model was developed as shown in Figure 5. The model was used to assess the degree of load of the distribution transformer for various unit power values: 40, 63, 100 and 160 kVA.
The simulations were made on the basis of real 15-minute data from April from the existing MV/LV station and the PV installation located in Greater Poland. It was assumed that the line was made with a YAKY cable with a 70 mm2 cross-section. Figure 6 depicts the load level of a station with a 100 kVA transformer depending on the number of connected 9.9 kWp prosumer installations. Figure 7 shows the results obtained for the standard profiles from the Instructions for the Movement and Operation of the Distribution Network (IRiESD) of the Energa Operator company assuming 20 customers of the G12 tariff group [9]. In the presented analyses, a prosumer was simultaneously included as a producer and a consumer (e.g. 20 consumers + 10 prosumers was understood as 20 consumers, of which 10 have an installed PV micro-installation).
When analyzing the obtained graphs, it can be noticed that the connection of one prosumer installation with a capacity of 9.9 kWp resulted in a reduction of the load level of the transformer station. Increasing the number of connected prosumers or the power of PV installations causes a noticeable increase in the station load due to the transformation of electricity from low voltage to medium voltage. Based on the weather archive for the place of installation of the sources [12], it was found that the highest loads were recorded on sunny days (high electricity production by PV installations), while in the case of significant cloud cover (e.g. at the beginning of the month – Fig. 6), the transformer load in network, to which was connected a significant number of prosumer installations, is lower than in the absence of photovoltaic sources. The greater the difference between the amount of energy produced and its consumption, the greater the load on the transformer.
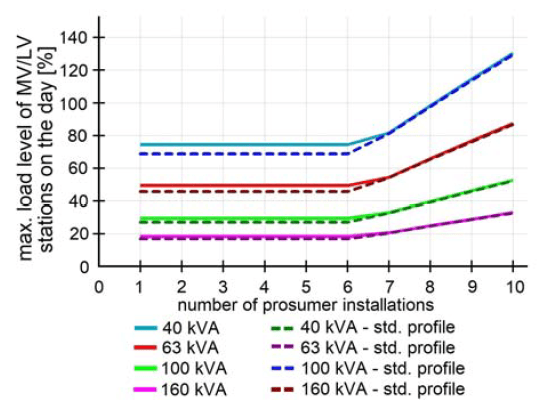
Figure 8 shows the load change of MV / LV stations with oil transformers with the capacity of 40, 63, 100 and 160 kVA depending on the number of connected prosumer installations with a unit capacity of 9.9 kW. The worst case in the analyzed month was considered – the day when the difference between electricity production and consumption is the greatest. The simulation results were presented both for real data from balancing counters (Advanced Metering Infrastructure) and for data from standard profiles.
The Figure 9 shows a diagram of voltage changes on LV busbars at the point of coupling of consumers. The performed simulations allow to conclude that in the case of connecting a significant power of the PV installation to the LV grid, there is a risk of overloading the transformers and substation circuits. The greater the number of prosumers connected, the greater the risk becomes. In addition, the risk of exceeding the permissible voltage values, voltage fluctuations or the flicker factors defined in the power quality norms is also increased. The problem of voltage increase caused by the intensive development of photovoltaics is described in more detail in [13, 14], while the impact of PV sources on voltage flicker and fluctuations in [15].
Too high a voltage value (above 1.1Un) can, for example, be reduced with the transformer’s tap-changer, however, as shown in Figure 10, this will increase the load on the station. The presented model is simplified and does not take into account a number of real factors influencing the change of currents flowing in the network (e.g. decreasing / increasing the value of the current generated by the PV in the case of a higher / lower voltage value in order to transmit the appropriate power).
Conclusions
The article presents selected issues related to MV/LV transformer stations to which local energy sources are connected in the form of home PV installations. In this part of the article risk of overloading stations to which PV installations are connected in large numbers is presented.
IT tools allow to assess the impact of connecting additional PV installations. Performing simulations and analyzes allows you to estimate how the newly connected installation will affect the transformer or line, which may prevent reaching a critical load level.
According to the authors, a correct analysis of the problem of overloading MV/LV transformers, taking into account the new operating conditions, will allow for the extension of their operation time and better management of network assets. During further considerations, the influence of various factors on the transformer aging process should be assessed, e.g. environmental factors (ambient temperature, the influence of insolation, wind speed, etc.), harmonic content, phase load irregularity. It is also necessary to take into account the assessment of the degree of degradation of transformers, taking into account dynamic temperature increases, e.g. during short-circuits or starts.
It should be borne in mind that in the case of PV electricity production (the direction of power flow from LV to MV), the value of the current flowing through the MV/LV station is equal to the sum of the values of the currents flowing to the station from the low-voltage circuits connected to this station. The more so that the simultaneity factor for the station load (PV energy production) in such cases is practically always equal to 1, and not less than 1 as it is commonly assumed when determining the power demand (transformer power).
REFERENCES
[1] PTPiREE report – Energetyka Dystrybucja i Przesyl, Raport opracowany w oparciu o dane liczbowe z 2021r., Poznań, July 2022 r.
[2] PTPiREE report – Energetyka Dystrybucja i Przesyl, Raport opracowany w oparciu o dane liczbowe z 2016r., Poznań, May 2017 r.
[3] PTPiREE report – Energetyka Dystrybucja i Przesyl, Raport opracowany w oparciu o dane liczbowe z 2017r., Poznań, May 2018 r.
[4] PTPiREE report – Energetyka Dystrybucja i Przesyl, Raport opracowany w oparciu o dane liczbowe z 2018r., Poznań, May 2019 r.
[5] PTPiREE report – Energetyka Dystrybucja i Przesyl, Raport opracowany w oparciu o dane liczbowe z 2019r., Poznań, May 2020r.
[6] PTPiREE report – Energetyka Dystrybucja i Przesyl, Raport opracowany w oparciu o dane liczbowe z 2020r., Poznań, August 2021r.
[7] Micro-installations in Poland as of August 30, 2022. http://www.ptpiree.pl/energetyka-w-polsce/energetyka-wliczbach/mikroinstalacje-w-polsce – accessed August 2022
[8] The Energy Law https://isap.sejm.gov.pl/isap.nsf/download.xsp/WDU19970540348/U/D19970348Lj.pdf – accessed July 2022
[9] Instructions for the Movement and Operation of the Distribution Network https://www.operator.enea.pl/dlafirmy/uslugidystrybucyjne/iriesd – accessed August 2022
[10]Data from a PV installation with a capacity of 9.9 kWp. https://pvmonitor.pl//i_user.php?idinst=10195&od=2021-06-01&do=2021-06-01#/sumapv – accessed April 2022,
[11] Zawodniak J, Łowczowski K, Czerniak M., Connection of PV Sources Into transmission Grid vs. Thermal Overload Risk of Wires and Cables, Automatyka, Elektryka, Zakłócenia (2021); 12(2): 28-36,
[12] The weather archive. https://www.ekologia.pl/pogoda/polska/wielkopolskie/pila/archi wum,zakres,01-04-2020_30-04-2020,calosc – accessed April 2022
[13] Kacejko P, Pijarski P., Mitigation of Voltage Rise Caused by Intensive PV Development in LV Grid., 7th Solar Integration Workshop, October 2017
[14] Pijarski P, Kacejko P, Wancerz M. Voltage Control in MV Network with Distributed Generation—Possibilities of Real Quality Enhancement, Energies 2022; 15(6):2081
[15] Łowczowski K, Nadolny Z., Voltage Fluctuations and Flicker in Prosumer PV Installation, Energies (2022); 15(6):2075
Authors: mgr inż. Magdalena Udzik, Politechnika Poznańska, Instytut Elektroenergetyki, ul. Piotrowo 3a, 61-138 Poznań, E-mail: magdalena.udzik@put.poznan.pl; dr inż. Krzysztof Łowczowski, Politechnika Poznańska, Instytut Elektroenergetyki, ul. Piotrowo 3a, 61-138 Poznań, E-mail: krzysztof.lowczowski@put.poznan.pl; Józef Jacek Zawodniak, Stowarzyszenie Elektryków Polskich Oddział Gorzowski, Grobla 9, 66-400 Gorzów Wielkopolski, E-mail: jj.zawodniak@wp.pl
Source & Publisher Item Identifier: PRZEGLĄD ELEKTROTECHNICZNY, ISSN 0033-2097, R. 99 NR 8/2023. doi:10.15199/48.2023.08.32

this simulation‑based analysis really brings into focus the rising risk of MV/LV transformer overloading as rooftop PV penetrations increase. The authors’ exploration of transformer sizing, prosumer counts, and tap‑changer effects clearly shows that what initially reduces loading may, beyond a threshold, significantly stress the system.
LikeLiked by 1 person
This simulation-based follow-up is a valuable extension to Part 1, grounding the theoretical framework in real numeric results. The authors clearly demonstrate how increasing numbers and capacity of rooftop PV prosumers can push MV/LV transformers beyond their ratings, especially under peak‐generation conditions, and how corrective actions like tap-changer adjustments further stress the equipment.
LikeLiked by 1 person
This is a very timely and well-done simulation study. It clearly shows that while rooftop PV has many benefits, beyond a certain saturation point it introduces real risks for MV/LV transformer overloading — especially during peak production times. I appreciate how the authors quantified effects of number of prosumers, transformer size, and tap-changer settings. It underlines the need for careful planning and regulation around PV deployment so that power quality and asset lifespan aren’t compromised.
LikeLiked by 1 person
This post provides a very clear and timely simulation-based examination of how increasing numbers of photovoltaic prosumers can strain MV/LV transformer stations—especially under peak generation conditions. The authors do a good job showing that while small additions of PV capacity may ease transformer loading, there’s a threshold beyond which voltage rise, transformer overloading, and degraded power quality become real risks. Their use of both real consumption/PV data and standard profiles makes the findings more robust, and their suggestions around tap-changer adjustments and careful network planning feel quite practical.
LikeLiked by 1 person
Thank you for this insightful simulation study. It really highlights how distributed PV deployment—while beneficial—can tip the balance and stress MV/LV transformers when saturation is high. The quantitative treatment of prosumer counts, transformer ratings, and tap‐changer behavior adds a lot of value. It underscores the need for more dynamic planning and smarter control strategies in distribution networks.
LikeLiked by 1 person