Published by 1. Krzysztof KRÓL1,2, 2. Grzegorz KŁOSOWSKI1,2, 3. Monika KULISZ3, 4. Arkadiusz MAŁEK2, Research and Development Center, Netrix S.A, Lublin (1), WSEI University, Lublin (2), Lublin University of Technology (3) ORCID:1. 0000-0002-0114-2794; 2. 0000-0001-7927-3674; 3. 0000-0002-8111-2316, 4. 0000-0001-7772-2755
Abstract. This article will introduce the concept of analyzing and detecting defects on production lines, paying attention to acceleration, temperature and humidity sensors. A system has been prepared to supervise the work. For this purpose, a prototype production line with intelligent sensors has been prepared. We present a comprehensive approach based on combining these three types of data, which enables early detection of potential problems.
Streszczenie. W tym artykule zostanie przedstawiona koncepcja analizy i wykrywania uszkodzeń na liniach produkcyjnych zwracając uwagę na czujniki przyspieszenia, temperatury i wilgotności. Przygotowany został system do nadzorowania pracą. W tym celu została przygotowana prototypowa linia produkcyjna z inteligentnymi czujnikami. Przedstawiamy kompleksowe podejście oparte na połączeniu tych trzech rodzajów danych, które umożliwia wczesną detekcję potencjalnych problemów. (Opracowanie systemu eksperckiego do analizy uszkodzeń na liniach produkcyjnych)
Keywords: cyber-physical systems sensors,analyse defects, fuzzy logic.
Słowa kluczowe: czujniki systemów cyber-fizycznych, analiza defektów, logika rozmyta
Introduction
In today’s dynamic industrial environment, the efficiency and reliability of production lines are critical to the success of any business. Damage and failures in production processes can lead to delays, loss of quality and costly repairs. That’s why increasing attention is paid to systems for detecting and identifying defects on production lines.
Acceleration, temperature and humidity sensors have become indispensable tools in monitoring the condition of machines and production processes. Multifaceted data analysis from these sensors allows early detection of potential problems and avoidance of more serious failures. With today’s data collection, processing and analysis technologies, it is possible to create advanced monitoring systems that help identify subtle signs of damage [1-5].
In the first section, we discuss the importance of monitoring production lines and the effects of failures on production processes and the company as a whole. In the next section, we describe the acceleration, temperature and humidity sensors used and how they are integrated into the monitoring system. We then discuss data processing techniques, including filtering, normalization and aggregation, which are key to obtaining reliable analysis results.
In the main part of the article, we focus on presenting different approaches to analyzing sensor data. We describe the use of statistical techniques to identify deviations from the norm and the creation of predictive models based on historical data.
In addition, we discuss the advantages of using machine learning, including neural networks and classification algorithms, in automatic pattern recognition in data. In the conclusion of the article, we summarize the benefits of implementing advanced monitoring systems based on sensor data analysis. We point out the significant reduction in the risk of failure, improvement in the efficiency of production processes and reduction in maintenance costs. We emphasize that modern data analysis and artificial intelligence technologies create new perspectives in the field of maintenance and quality management in the manufacturing industry.
Acceleration sensors are particularly useful in detecting machine vibration and oscillation. An increase in vibration amplitude or the appearance of unusual vibration patterns can indicate impending damage to mechanical components or improper machine settings. On the other hand, temperature monitoring can reveal overheating of components, which can lead to accelerated wear and tear of materials and a shorter service life. Humidity also plays an important role, especially in processes that require specific environmental conditions, such as the production of moisture-sensitive electronic products [6-9].
System description
For this purpose, a prototype production line with intelligent sensors has been prepared. The construction of the solution makes it possible to improve the management of the company’s intelligent structure in many aspects of its operation. Thanks to the extensive system, all data from smart sensors goes into the system, where it can be used in the analytical system, which is used to monitor and optimize problematic processes [10- 11].
To guarantee optimal system functionality, including all system parameters in the configuration settings is necessary. For production lines, it is also important to establish safety procedures to be followed during operation. Among these are emergency procedures, safety procedures and protective measures for production line operators.
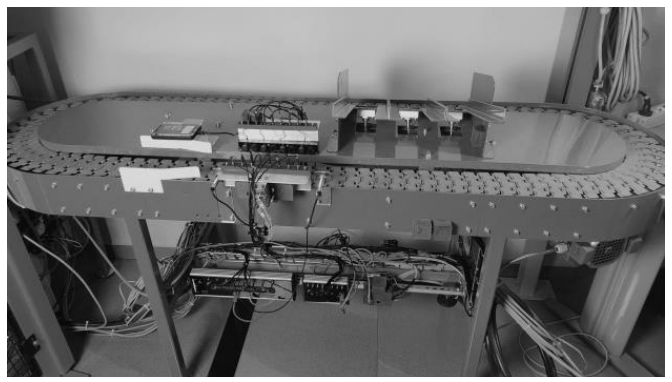
The prototype line was prepared as a closed line in an oval shape. Elements move along the line. The line has the ability to control the speed of belt travel. Smart sensors have been deployed to collect data. The sensors have been placed on various parts of the system. The sensors were placed on the motor, the clamping jaws, and the line itself [12-13].
Model construction
To enable fault detection, a fuzzy logic controller model has been developed. In a typical fuzzy logic controller, four basic modules can be distinguished: the fuzzification module, the inference module, the rule base and the sharpening module. The process in the controller begins with transforming input data from a sharp form to a fuzzy form using the blurring module. The blurring is done through the membership function, where sharp values are converted to fuzzy. In the blurring process, fuzzy membership values are assigned to certain sharp parameters. Then, the fuzzy values are processed according to the rules of the inference mechanism, which are stored in a knowledge base. This database contains predefined rules. Fuzzy inference is a knowledge-processing process in which fuzzy logic is applied. During inference, decision-making is mimicked by properly interpreting the knowledge held. This process uses rules stored in a rule or knowledge base [14].
The rule base is an interpretation of the expert’s knowledge of the possible values of the state variables of an object. In order for the processed information to be used practically, it is necessary to convert it back to sharp values using the sharpening module. The sharpening process converts the fuzzy data into exact values to be used in practice. The results of the membership function are reduced to a single numerical value by sharpening.
The input parameters for the expert model being created are processed line data from sensors:
– temperature and humidity,
– acceleration, and angular velocity,
– atmospheric pressure.
Prepare data and model
A line was run to collect data and test the rules built. Production items moved on the line. Sensors collected data while operating under normal (no-fault) conditions. The measured data was saved to a database. Based on the collected data, the built fuzzy logic model was tested. Then, modifications were carried out on the line in such a way as to signal that some failure might occur. Many different algorithms are used for data analysis and optimization [14- 24]. The collected data was used to build a model for detecting failures on the production line [25].

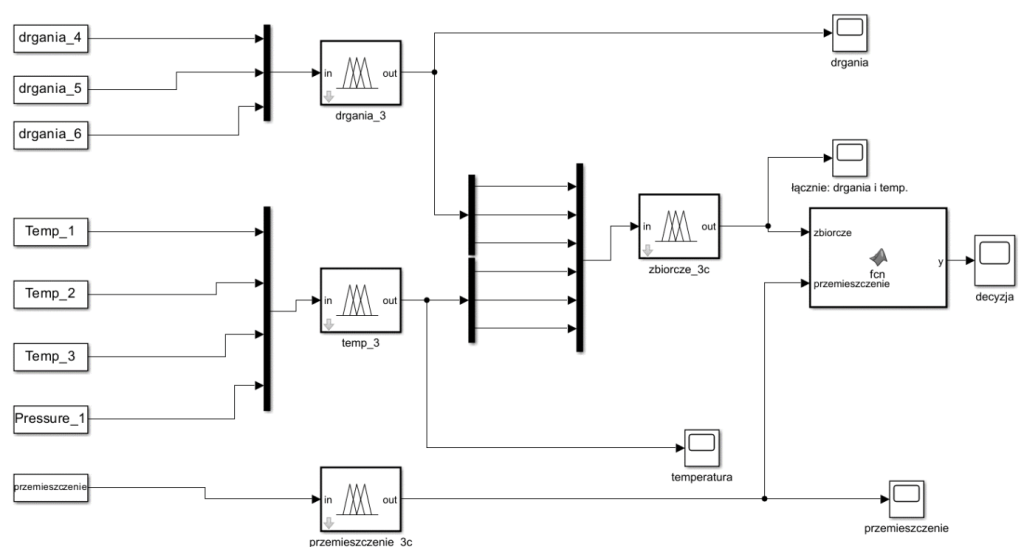
The inputs to the first fuzzy controller are the resultant vibration on the motor housing (vibration_4), resultant vibration on the jaws (vibration_5); resultant vibration on the production line (vibration_6). Mamdani’s logical inference rules were analyzed. Input data to the second fuzzy controller: temperature at the central unit (Temp_1), temperature at the motor housing (Temp_2); temperature at the jaws (Temp_3); atmospheric pressure (Pressure_1). Input to the third fuzzy controller: the displacement of the jaws in the Z-axis (displacement). The inputs to the fuzzy collective controller are the outputs from the fuzzy controllers for vibration and temperature: probability of failure on the engine – vibration, probability of failure on the jaws – vibration, probability of failure on the production line – vibration, probability of failure on the central device – temperature, probability of failure on the engine – temperature, and probability of failure on the jaws – temperature.
The purpose of creating a model based on fuzzy logic is to indicate whether a fault is present or not in the area of vibration sensors. A total of four fuzzy models were built. The first model was built from nine vibration rules. The second model concerns temperature. The third model concerns the clamping jaws’ preparation. The fourth model is an aggregate model for temperature and vibration.
The first six columns in the figure 2 are the input variables, and the last column is the rule results. The last (bottom) figure in the last column in row 5 shows the determination of the result using the center of mass (centroid) method. The rules are designed so that results closer to 0 mean no fault occurs, and results closer to one mean a fault occurs.
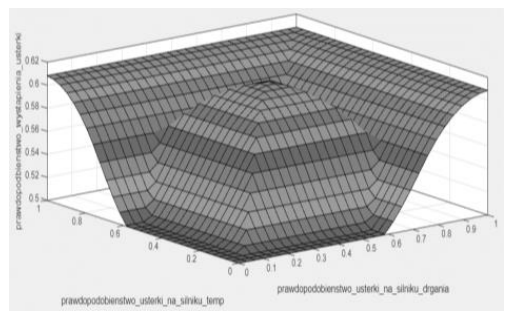
An example of the response surface implemented by the defuzzification rules depending on the probability of a fault on the engine (temperature) and the probability of a fault on the engine (vibration) is shown in Figure 3
Results
The model consists of 8 inputs, also inputs to fuzzy controllers. At the output of the model, we get a decision – whether a fault is present or not. The model contains fuzzy controllers. Displays have been placed at the output of each controller, where it is possible to monitor the results.
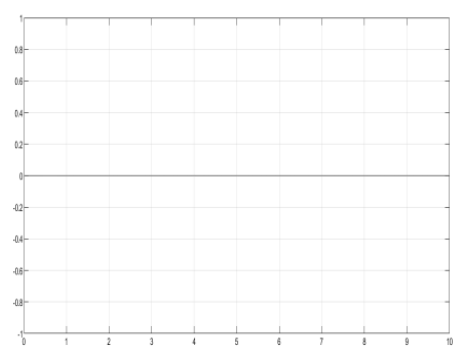
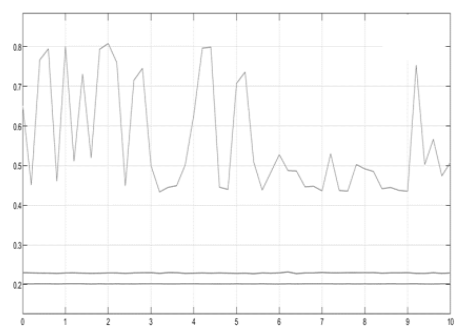
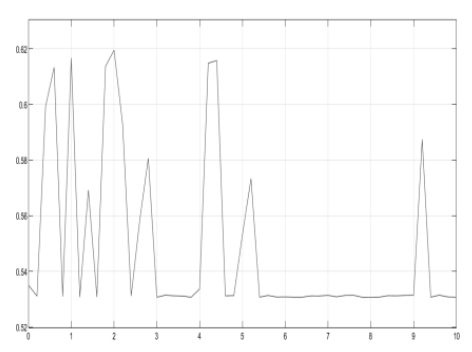
The graphs of the performance of the individual fuzzy controllers show what the response looks like when there are no problems on the line – this is shown in Figure 5. Another of the waveforms shows the response from the associated controller only related to vibration, and here, the high probability of a fault is apparent (figure 6).
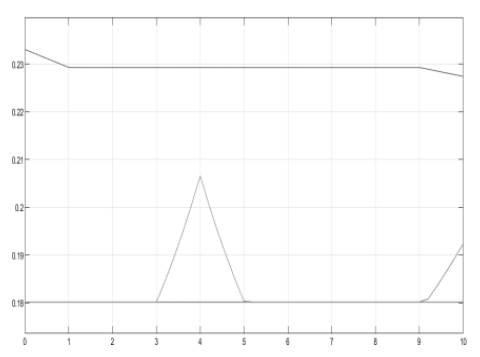
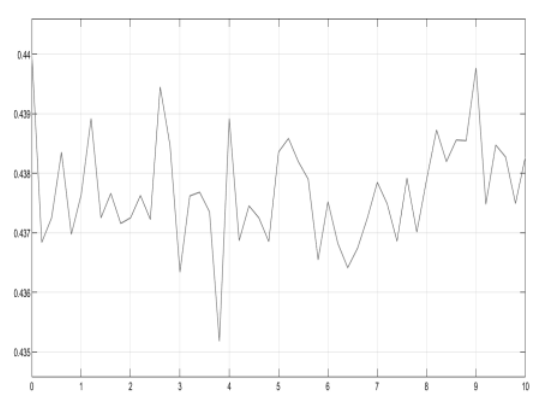
The response to temperature sensors is shown as another of the responses, here with a high probability of no error (Figure 7). The response for the controller with combined responses for vibration and temperature is indicated in Figure 8. In this waveform, there is an average of about 55% probability of a fault.
Using the individual models, it would seem that there is a fault from the operation of the individual sensors, but looking at the whole system, it can be seen in the response of the fuzzy controller that no fault arises here, and the system works properly.
Based on the above results, it is concluded that the performance of the model is correct.
REFERENCES
[1] Kong XT, Zhong RY, Zhao Z, Shao S, Li M, Lin P, et al. Cyber physical ecommerce logistics system: an implementation case in Hong Kong. Comput Ind Eng 139 (2020), 106170.
[2] He J, Jia G, Han G, Wang H, Yang X. Locality-aware replacement algorithm in flash memory to optimize cloud computing for smart factory of industry 4.0. IEEE Access, 5 (2017), 16252-62.
[3] Shang C, Bao X, Fu L, Xia L, Xu X, Xu C . A novel key-value based real-time data management framework for ship integrated power cyber-physical system. 2019 IEEE innovative smart grid technologies — Asia (ISGT Asia) (2019), 854-8
[4] Manavalan E, Jayak rishna K. A review of internet of things (iot) embedded sustainable supply chain for industry 4.0 requirements. Comput Ind Eng ,127 (2019), 925-53.
[5] Assawaarayakul C, Srisawat W, Ayuthaya SDN, Wattanasirichaigoon S. Integrate digital twin to exist production system for industry 4.0. 2019 4th technology innovation management and engineering science international conference (TIMES-iCON), (2019), 1-5.
[6] Akhtari S, Pickhardt F, Pau D, Pietro AD, Tomarchio G. Intelligent embedded load detection at the edge on industry 4.0 powertrains applications. 2019 IEEE 5th international forum on research and technology for society and industry, (2019), 427-30
[7] Poor P, Basl J, Zenisek D. Predictive maintenance 4.0 as next evolution step in industrial maintenance development. 2019 international research conference on smart computing and systems engineering (SCSE), (2019), :245-53
[8] Occhiuzzi C, Amendola S, Nappi S, D’Uva N, Marrocco G. Rfid technology for industry 4.0: architectures and challenges. 2019 IEEE international conference on RFID technology and applications (RFID-TA), (2019), 181-6.
[9] Król K., Marciniak A., Gudowski A, Bojanowska J., Intelligent Sensor Platform with Open Architecture for Monitoring and Control of Industry 4.0 Systems, European Research Studies Journal, 24 (2021), No. 2, 597-606.
[10]Lins T, Oliveira RAR. Cyber-physical production systems retrofitting in context of industry 4.0. Comput Ind Eng, 139 (2020), 106193.
[11]Saarikko T., Westergren U. H., Blomquist T., The Internet of Things: Are you ready for what’s coming?, Business Horizons, 60 (2107), No.7.
[12]Kozłowski, E., Mazurkiewicz, D., Żabiński, T., Prucnal, S., Sęp, J ., Assessment model of cutting tool condition for real-time supervision system. Eksploatacja i Niezawodność – Maintenance and Reliability, 21 (2019), No.4, 679-685.
[13]Kozłowski, E., Antosz, K., Mazurkiewicz, D., Sęp, J., Żabiński, T. (2021). Integrating advanced measurement and signal processing for reliability decisionmaking. Eksploatacja i Niezawodność – Maintenance and Reliability, 23(4), 777-787.
[14]Gnaś, D., Adamkiewicz, P., Indoor localization system using UWB, Informatyka, Automatyka, Pomiary W Gospodarce I Ochronie Środowiska, 12 (2022), No. 1, 15-19.
[15]Koulountzios P., Aghajanian S., Rymarczyk T., Koiranen T., Soleimani M. , An Ultrasound Tomography Method for Monitoring CO2 Capture Process Involving Stirring and CaCO3 Precipitation, Sensors, 21 (2021), No. 21, 6995.
[16]Kłosowski G, Rymarczyk T, Niderla K, Kulisz M, Skowron Ł, Soleimani M., Using an LSTM network to monitor industrial reactors using electrical capacitance and impedance tomography – a hybrid approach. Eksploatacja i Niezawodnosc – Maintenance and Reliability, 25 (2023), No. 1,11.
[17]Kłosowski G., Rymarczyk T., Kania K., Świć A., Cieplak T., Maintenance of industrial reactors supported by deep learning driven ultrasound tomography, Eksploatacja i Niezawodnosc – Maintenance and Reliability; 22 (2020), No 1,138–147.
[18]Styła, M., Adamkiewicz, P., Optimisation of commercial building management processes using user behaviour analysis systems supported by computational intelligence and RTI, Informatyka, Automatyka, Pomiary W Gospodarce I Ochronie Środowiska, 12 (2022), No 1, 28-35.
[19]Kropidłowska P., Irzmańska E. Korzeniewska E., Tomczyk M., Jurczyk -Kowalska M., Evaluation of laser texturing in fabricating cut-resistant surfaces for protective gloves, Textile Research Journal, 93 (2023), No. 9-10), 1917–1927.
[20]Pawłowski S., Plewako J., Korzeniewska E., Field Modeling of the Influence of Defects Caused by Bending of Conductive Textronic Layers on Their Electrical Conductivity, Sensors, 23 (2023), No. 3, 1487.
[21]Rymarczyk T., Kłosowski G., Hoła A., Hoła J., Sikora J., Tchórzewski P., Skowron Ł., Historical Buildings Dampness Analysis Using Electrical Tomography and Machine Learning Algorithms, Energies, 14 (2021), No. 5, 1307.
[22]Kłosowski G., Rymarczyk T., Niderla K., Rzemieniak M., Dmowski A., Maj M., Comparison of Machine Learning Methods for Image Reconstruction Using the LSTM Classifier in Industrial Electrical Tomography, Energies 2021, 14 (2021), No. 21, 7269.
[23]Rymarczyk T., Kłosowski G., Hoła A., Sikora J., Tchórzewski P., Skowron Ł ., Optimising the Use of Machine Learning Algorithms in Electrical Tomography of Building Walls: Pixel Oriented Ensemble Approach, Measurement, 188 (2022), 110581.
[24]Koulountzios P., Rymarcz yk T., Soleimani M., A triple-modality ultrasound computed tomography based on fullwaveform data for industrial processes, IEEE Sensors Journal, 21 (2021), No. 18, 20896-20909.
[25]Kłosowski G., Cloud Manufacturing Concept as a Tool of Multimodal Manufacturing Systems Integration. Foundations of Management, 4 (2012), No.1, 17-42.
Authors: Grzegorz Kłosowski, Ph.D. Eng., Lublin University of Technology, Nadbystrzycka 38A, Lublin, Poland, E-mail: g.klosowski@pollub.pl;; Krzysztof Król, WSEI University, Projektowa 4, Lublin,, Research&Development Centre Netrix S.A., Lublin Związkowa 26. Email: krzysztof.krol@netrix.com.pl; Monika Kulisz Ph.D. Eng., Lublin University of Technology, Nadbystrzycka 38A, Lublin, Poland, E-mail: m.kulisz@pollub.pl; Arkadiusz Małek, Ph.D. Eng., WSEI University, Projektowa 4, Lublin, e-mail: arkadiusz.malek@wsei.lublin.pl
Source & Publisher Item Identifier: PRZEGLĄD ELEKTROTECHNICZNY, ISSN 0033-2097, R. 101 NR 1/2025. doi:10.15199/48.2025.01.38
