Published by 1. Aleksander CHUDY, 2. Paweł A. MAZUREK, Lublin University of Technology
ORCID: 1. 0000-0002-3183-8450, 2. 0000-0002-7098-2084
Abstract. The research focused on one–week long measurement of power quality parameters at the connection point of a 450 kW charging station (pantograph type) in the distribution substation. The bus terminal was equipped with 1200 kVA 15.75/0.42 kV Dyn 5 transformer. The Solaris Urbino 12 electric buses were used for the tests.The device used for the measurements was Sonel PQM–711 class A power quality analyser. The measurements showed a full compliance with the PN–EN 50160 2010 standard.
Streszczenie. Badania koncentrowały się na jednotygodniowym pomiarze parametrów jakości energii elektrycznej w punkcie przyłączenia pantografowej stacji ładowania o mocy 450 kW w podstacji transformatorowej. Przy pętli autobusowej znajdował się transformator Dyn5 o mocy pozornej 1250 kVA i przekładni 15,75/0,42 kV. Do badań wykorzystano autobusy Solaris Urbino 12 electric. Parametry jakości energii elektrycznej mierzono analizatorem Sonel PQM–711 (klasa A). Pomiary wykazały pełną zgodność z normą PN–EN 50160:2010. (Ultra-szybkie ładowanie floty autobusów elektrycznych i jego wpływ na parametry jakości energii elektrycznej).
Keywords: electromobility, electric bus charging, power quality
Słowa kluczowe: elektromobilność, ładowanie autobusów elektrycznych, jakość energii elektrycznej
Introduction
Electric buses are becoming more popular around the world, particularly in the urban regions, due to their near-zero emissions and environmental benefits. In terms of passenger comfort, electric buses powered by batteries can provide the same level of service as diesel buses due to a proper charging schedule or sufficient charging capacity. Electric buses emit nearly no carbon dioxide when compared to diesel buses and tend to emit less noise [1]. Because of the advantages listed above, electric buses are currently regarded as a promising way of public transportation for the future.
However, the use of electric buses might affect power quality (PQ) parameters and therefore speed up the degradation of elements of a distribution system. There are few publications where the effects of electric bus charging using information gathered from real measurements were examined. In [2] it was concluded that during electric bus charging, despite the large number of low-frequency voltage harmonics, the voltage harmonics emission was within the limits. In the study [3] the effects of 11 electric bus chargers was discussed. Flicker perceptibility, voltage harmonic distortion, and voltage unbalance were all within acceptable ranges according to grid code. Zagrajek et al. [4] looked at how pantograph chargers (200 kW of power) affected distribution grid. The outcomes demonstrated that the EN 50160 standard’s requirements for the PQ criteria were fulfilled. The effects of pantograph charging and fast charging on PQ parameters were discussed in the work of [5]. The EN 50160 standard’s requirements were also fulfilled. The study found that the current harmonics had certain additive characteristics when more than one charger was in use.
The research focused on a distribution substation that supplies 2 ultra–fast electric bus pantograph chargers of the same type at the bus depot at Grygowa Street in Lublin, Poland (Figure 1). The bus depot is equipped with a 1250 kVA 15.75/0.42 kV Dyn5 transformer. The electric bus fleet in Lublin consists of 31 Solaris Urbino 12 electric buses (IV generation) that are equipped with traction batteries with a capacity of 116 kWh (4 × 29 kWh) made using lithium–titanium-oxide (LTO) technology. The minimum range of this type of electric bus is approximately 90 km.

The aim of this article is the analysis of PQ parameters measured during one–week long period to see if the pantograph charging has adverse impact on the distribution grid.
The pantograph charging station
The pantograph charging station is a standalone device which needs to be connected to the AC voltage of 3 x 400 V, 50 Hz. The set consists of 2 main components: a power supply cabinet and a mast with a switchboard and a docking station. The casings of the power cabinet and the mast switchboard are made of powder coated aluminum sheet. The main part of the device consists of 16 power modules, expandable to 20. Each module has a power of 30 kW. The pantograph charging station converts the AC voltage of 3 x 400 V into an output voltage in the range 460 VDC ÷ 800 VDC and adapts it to the operating voltage range of the traction batteries of the electric bus. The pantographs used by the carrier are inverted pantographs (in this version the device is not stacked on the roof of the bus but rather on the mast of the charger) [6]. Table 1. presents the parameters of the pantograph charging station.
Table 1. The parameters of the pantograph charging station


Methodology
PQ measurements of average values were taken throughout the entire week and 2 days later during one charging process using, Sonel PQM–711 (class A PQ analyser) with Sonel F–2 Rogowski coils. The data aggregation interval was set to 150 cycles (3 s; nominal frequency of 50 Hz) for the entire week, and 10 cycles (200 ms; nominal frequency of 50 Hz) for one charging process which allowed the analysis of current harmonics emission in accordance with the IEEE 519:2014 standard. The results were aggregated (averaged) to approximately 10 min intervals; therefore, 1011 samples of average values for the whole week and 2 samples for one charging process, respectively, were obtained.
The results were then compared with the requirements of The Regulation of the Minister of Economy of 4 May 2007 on the detailed conditions for the operation of the power system, its subordinate document PN-EN 50160:2010 and IEEE 519 (current harmonics analysis).
The following PQ parameters considered in the analysis were frequency variation, voltage variation, voltage asymmetry, total harmonic distortion of voltage, short-term and long-term flicker severity, voltage and current harmonics.
Results and discussion
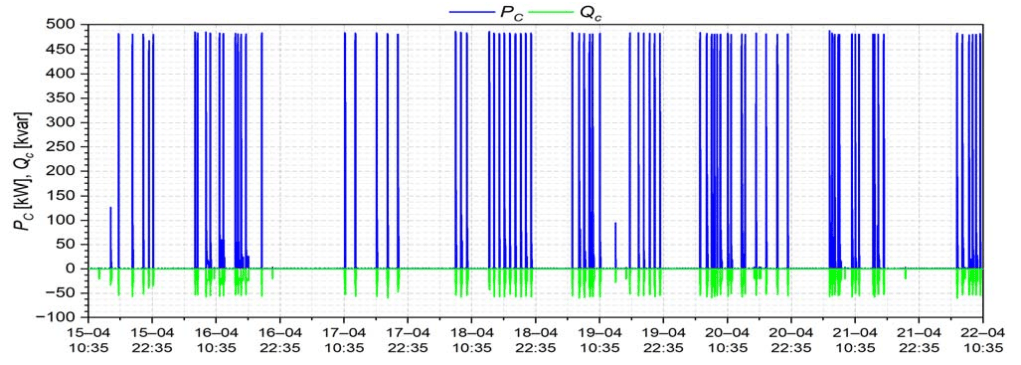
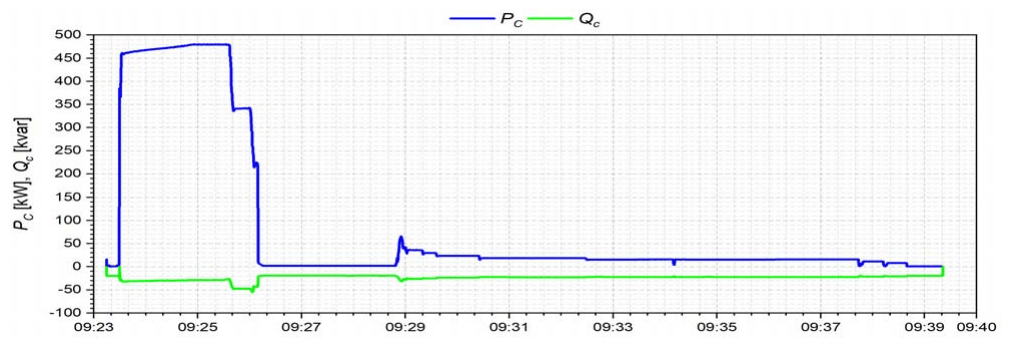
The weekly total active and reactive power demand profile is presented in Fig. 3. Various electric buses of the same type were connected to the pantograph charger for 8.91% of the week. The maximum registered value of active power was 487.25 kW. The load was of a capacitive nature (minimum value of -59.37 kvar). Fig. 4 presents total active and reactive power demand during one charging process, which took approximately 16 minutes. It is visible that the period where the charger uses full power is very short (approximately 2 ½ minutes).
a) Power frequency variation
The values of the power frequency were averaged every 450 cycles (67 341 samples). The mean value of the power frequency was 49.99 Hz. The value of 95th percentile was 50.03 Hz which means it was within the limits of PN-EN 50160:2010 standard. Maximum and minimum value of the power frequency were 50.11 Hz and 49.84 Hz, respectively. Fig. 5. presents the power frequency variation during the measurement period.

b) Phase voltage variation and voltage asymmetry
The values of 95th percentile of the approximately 10 min mean RMS values of the phase voltages were 235.53 V, 234.69 V, 234.56 V for the 1st, 2nd, and 3rd phase, respectively. Therefore they are compliant with the PN-EN 50160:2010 standard. The values of the phase voltages during one charging process were also within the limits. The mean RMS values of the phase voltages during one charging cycle were also within the limits (231.14 V for the 1st phase, 230.48 V for the 2nd phase and 230.98 V for the 3rd phase). Fig. 6. presents the phase voltages variation during the entire week.

The value of 95th percentile of the voltage imbalance factor was 0.35% (2% limit). The value was even lower for one charging cycle (0.21%).
c) Total harmonic distortion of voltage
The total harmonic voltage distortion (THDU) is defined as:

where: Un – the RMS voltage of nth harmonic, U1 – voltage of fundamental frequency
The values of 95th percentile of approximately 10 min mean values of THDU were 3,89% for the 1st phase, 4% for 2nd phase, and 3,96% for the 3rd phase. Higher values of THDU were observed during the night hours when the charging did not occur. The mean values during one charging cycles were 231,14 V, 230,48 V and 230,98 V for the 1st, 2nd and 3rd phase, respectively. The values are compliant with the PN-EN 50160:2010 standard (THDU ≤ 8% for 95% of the week). Fig. 7. presents THDU variation during the measurement week.

d) Short-Term and Long-Term flicker perceptibility
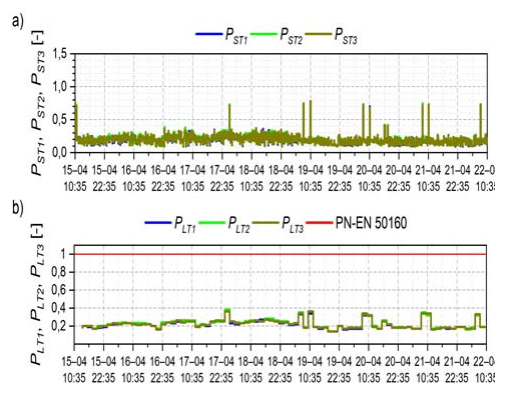
There were 11 short peaks of short-term flicker perceptibility recorded (maximum value of 0.78 for the 3rd phase), however it did not cause any problem with the exceedance of the long-term flicker perceptibility limits set in the PN-EN 50160 standard. The values of 95th percentile of long-term flicker perceptibility were 0.33 for both the 1st and the 2nd phase and 0.34 for the 3rd phase. Fig. 8 presents short-term and long-term flicker perceptibility variation during the measurement week.
e) Voltage harmonics
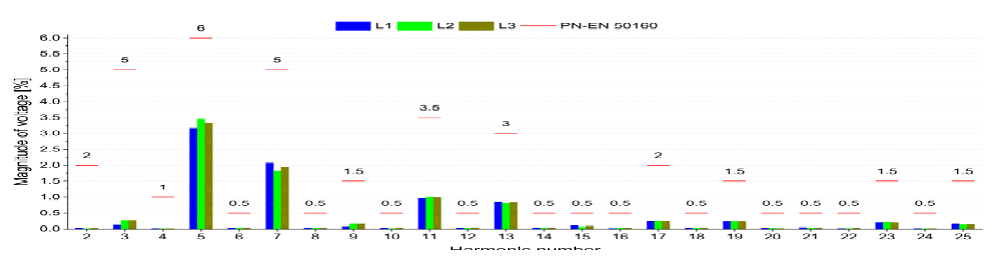
There were 6 events when the limit value of 6th voltage harmonic was exceeded: One occurrence when:
• the values were exceeded for all phases,
• the values were exceeded for the 1st and 3rd phase,
• the value was exceeded for the 3rd phase
There were also 6 events when the limit value of 8th voltage harmonic was exceeded. The exceedances for all the phases occurred at the same time when the exceedances for 6th voltage harmonic.
Nevertheless, the exceedances were very short (duration of 200-400 ms) and the values of 95th percentile of voltage harmonics for all the phases met the requirements of the PN-EN 50160 standard (Fig. 9).
f) current harmonics
In Poland there is no standard dedicated for devices connected to the public low–voltage systems with an input current higher than 75 A (which is the case for fast and ultra–fast chargers), therefore the recommendations of the IEEE–519:2014 standard was considered. The maximum demand load current (IL) was assumed as the maximum average fundamental current from all measured current channels during the recording period. Each ratio of the maximum short-circuit current (ISC) to IL was considered. The values of 99th percentile of current harmonics were not exceeded during one charging process (Fig. 10).

Conclusions
In this paper the analysis of PQ parameters during one–week measurement period and one charging cycle was considered. The conclusions are following:
• the one–week PQ parameters measurements show a full compliance with the PN–EN 50160:2010 standard,
• the 5th and 7th voltage harmonics were the most dominant during the measurements,
• current harmonics emission are compliant with the requirements of the IEEE 519-2014 standard
This research was co-funded by the INTERDOC PL project, which is co-financed by the European Social Fund under the Knowledge Education Development Operational Program 2014–2020 (project number POWR.03.02.00-00- I020/16). The authors would like to acknowledge the Municipal Transport Company Lublin, LLC.
REFERENCES
[1] Chudy A., Hołyszko P., Mazurek P., Fast Charging of an Electric Bus Fleet and Its Impact on the Power Quality Based on On-Site Measurements, Energies, 15 (2022), Nr 15, 5555
[2] Thiringer T., Haghbin S., Power Quality Issues of a Battery Fast Charging Station for a Fully-Electric Public Transport System in Gothenburg City, Batteries, 1 (2015), Nr 1, 22-33
[3] Su C.-L., Yu J.-T., Chin H.-M., Kuo C.-L., Evaluation of powerquality field measurements of an electric bus charging station using remote monitoring systems, 2016 10th International Conference on Compatibility, Power Electronics and Power Engineering (CPE-POWERENG), (2016), 58-63
[4] Zagrajek K., Paska J., Kłos M., Pawlak K., Marchel P., Bartecka M., Michalski Ł., Terlikowski P., Impact of Electric Bus Charging on Distribution Substation and Local Grid in Warsaw, Energies, 13 (2020), Nr 5, 1210
[5] Al-Saadi M., Bhattacharyya S., van Tichelen P., Mathes M., Käsgen J., van Mierlo J., Berecibar M., Impact on the Power Grid Caused via Ultra-Fast Charging Technologies of the Electric Buses Fleet, Energies, 15 (2022), Nr 4, 1424
[6] https://www.enika.pl/en/vm-2/buses/eni-spant-450-pantographstation-detail (accessed: 08.09.2022)
Authors: mgr inż. Aleksander Chudy, Department of Electrical Engineering and Electrotechnologies, Lublin University of Technology, Nadbystrzycka Street 38A, 20-618 Lublin, e-mail: a.chudy@pollub.pl; dr inż. Paweł Mazurek, prof. LUT, Department of Electrical Engineering and Electrotechnologies, Lublin University of Technology, Nadbystrzycka Street 38A, 20-618 Lublin, e-mail: p.mazurek@pollub.pl.
Source & Publisher Item Identifier: PRZEGLĄD ELEKTROTECHNICZNY, ISSN 0033-2097, R. 99 NR 1/2023. doi:10.15199/48.2023.01.60
