Published by M Hazwan WAHAB1,2, Mohammad Syuhaimi AB RAHMAN2, Ahmad Asrul IBRAHIM2, A H AHMAD ABAS1,2, Norhidayah AHMAD1,2, Quest International University (1), University Kebangsaan Malaysia (2)
Abstract. Fiber Bragg grating (FBG) is a relatively novel method used for network health monitoring that has a number of advantages including high accuracy, multiplexing, electromagnetic interference resistance and good repeatability. FBG sensor installed in the network has been utilized in many applications to monitor the system and environment condition. Any interruption on the system or environment can be identified and monitored through the status of network health.
Streszczenie. Siatka światłowodowa Bragga (FBG) to stosunkowo nowa metoda stosowana do monitorowania stanu sieci, która ma wiele zalet, w tym wysoką dokładność, multipleksowanie, odporność na zakłócenia elektromagnetyczne i dobrą powtarzalność. Czujnik FBG zainstalowany w sieci znalazł zastosowanie w wielu aplikacjach do monitorowania stanu systemu i otoczenia. Wszelkie zakłócenia w systemie lub środowisku można zidentyfikować i monitorować na podstawie stanu sieci. (Monitorowanie stanu wielożyłowych podziemnych linii energetycznych z wykorzystaniem światłowodowej siatki Bragga)
Keywords: Network monitoring; Fiber bragg grating; Passive optical network; P2MP
Słowa kluczowe: Monitorowanie sieci; Siatka Bragga z włókna; Pasywna sieć optyczna; P2MP
Introduction
Power supply is one of the most important and demanding factors in big cities and metropolises. The usage of power consumption is increasing over the years which worries the consumers or users of the electricity interruptions. In order to avoid this issue from happening, service provider needs to sort the best way to deliver electricity to the end user that could promise zero losses or interruption. Currently, the methods being used are diametrical but it involves high costing and affecting the environment. Try and error method is also used to find the source of the problem that does not really suite our current ways of living. Since records of the pilot cable routes are not well maintained and updated, most of the cable routes are not able to be detected. In addition, power provider does not have a specific equipment to identify the exact location of the faulty cables along its route. Using the try and error method to trace the exact location of power cable fault is practiced at the site. In fact, location measured by TDR is not accurate and several attempts of digging are required to find the right location before the cable are able to be repaired. This method needs longer time and caused high costing in order to do cable maintenance[1].
All of these issues will be solved with the modern cable transmission systems that uses fiber optic and optical sensor. The introduction of the new modern cable transmission introduces lower cost margin for maintenance purposes, allow remote faulty cable monitoring, improve performance, remove electromagnetic interference and avoid environmental disturbance in order to supply power to the end users. Furthermore, for future estimations, electric network will be able to distribute power energy altogether with the data information[2].
Underground power line transmission environment
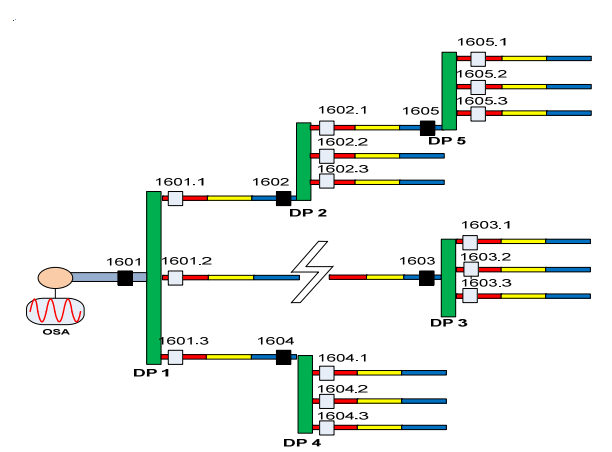
Normal functioning 11/33kV power cable transfers the energy to the end point with the expectation of high efficiency delivery[3]. In order to supply a reliable power supply, multi-core cables will be utilized as shown in Figure 1, it will be attached to an optical cable on the outside along with the cable for monitoring network health cable.
Fiber bragg grating (FBG)
FBG is a low-cost filter in a fiber cable core used to block certain wavelengths or as a reflector of some wavelengths set on FBG. Reflected signal developed will reflect based of any physical changes’ parameter such as strain, pressure, temperatures, grating period, reflective index and etc[4].
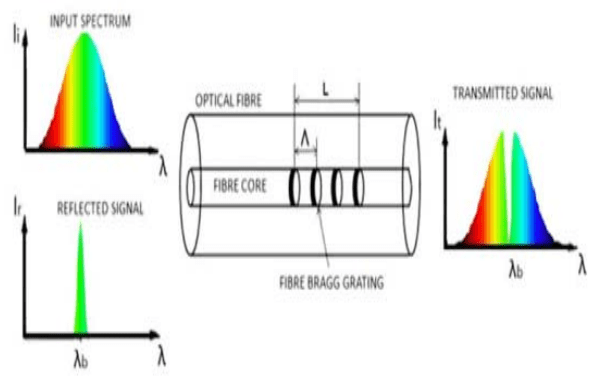
Figure 2 shows the principle of FBG sensor mechanism. FBGs will be placed around the branch of fiber and as a location indicator for every ONU. The reflected spectrum is created from the FBG located at ONU will be analyse using the Optical Spectrum Analyzer (OSA). FBG is widely used [3]in most application nowadays in filtering, amplifier gain flattening and OCDMA generation codes. The Bragg reflected wavelength is:
Whereby neff is the effective refractive index meanwhile Λ spatial period or period of grating[6].
Material and Methods
A. Monitoring power transmission
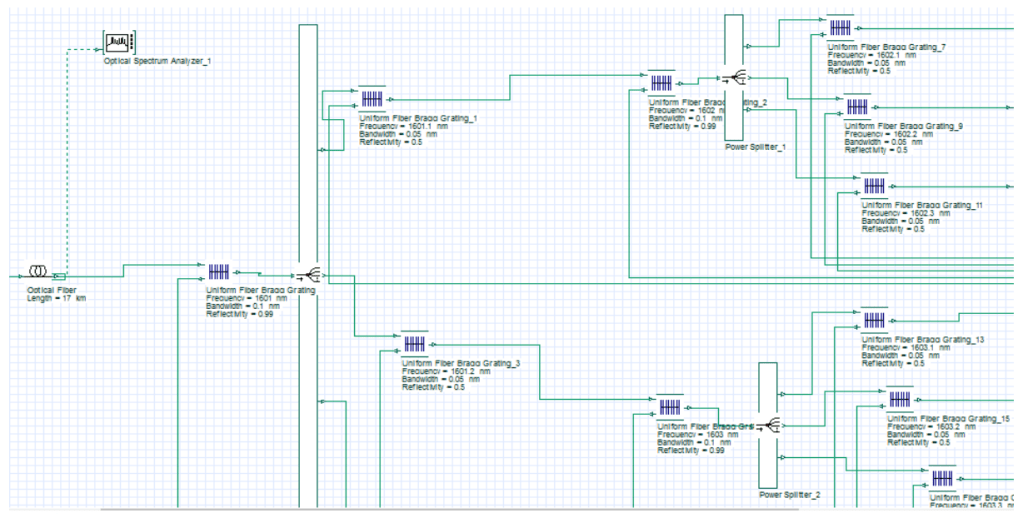
A multiplexer is used along the fiber to produce a combination of monitoring signal from white light source with downstream signal. The laser signal transmitted will be deciphered by the optical splitter to every branch of the fiber. Each of the branch will be assigned with a uniform number FBGs created from unique spectrum reflections and bandwidth on the preset code. Each of the code will indicate the line along fiber and port number as well as the DP number in order to well recognize the branches. Implementation of FBGs will work as a filter to reflect the white light based on the wavelength, bandwidth and reflection that is set on the FBG[7]. Different code is created to distinguish every port and it can be easily traced using FBG spectrum reflections. Signal transmission will be able to be monitored by doing spectrum analysis using OSA in order to ensure signal delivered properly as shown in Figure 3[8].
B. Architecture supervisory power network
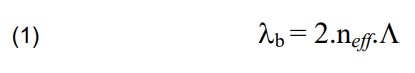
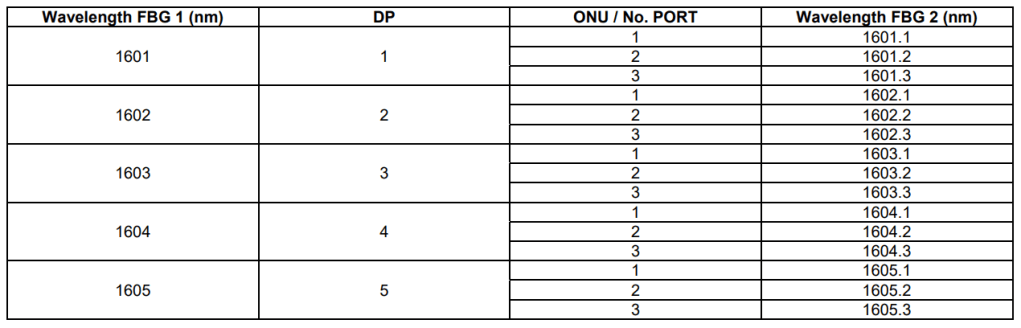
The Bragg wavelength selection starting with 1601nm until 1632nm is used to indicate the distribution point (DP). Number of DP will start from DPX to DPY and the last two digits is representing the DP numbers on the power line network. Bandwidth with 0.1nm and reflection 90% is used at FBG first and act as DP indicator as well. Meanwhile the second FBG represents the port for every DP by using 50% reflection and 0.05nm bandwidth as showing in Figure 4.
For the second FBG, the Bragg wavelength is used, it is the same as the first FBG based on the DP number, but the value after the decimal point is equal to the port number for the DP.
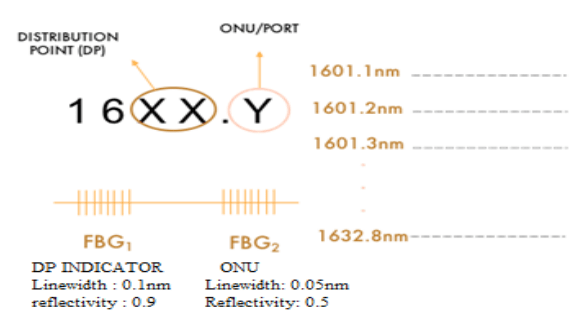
Figure 5 shows the design of multi-core transmission line that can monitor the signal for a total of 256 ports. Along the line, only 2 FBGs are needed to generate the reflected spectrum with the port number and DP number. 256 ports will be monitored by 512 FBGs. This method will be able to monitor more port even bandwidth supplied that is limited[9]–[12]. Therefore, the propose design is shown in Table 1.
Results and Discussions
A. Parameters performances
The performances of multi-core cable design simulation are measured by analysing the parameter of BER, Q-factor and eye diagram. BER performance parameter is measured at ONU/PORT number 2 since ONU/PORT 1 is connected to the other port. BER is the rate of occurrence of bit errors during the data transmission process. Simulation is carried out for 15 ONU and the result is analysed using the BER Analyzer. Result shows minimum BER value for 15 ONU that is 3.08638e-70 and it is acceptable due to the additional breakdown network. The Q-factor quality still can be maintained for 15 ONU breakdown which shows 17.678 as result from the simulation.
The Q-factor indicates the power loss related to the amount of power stored in the system. A low power loss rate will increase the value of the Q-factor. In order to ensure the quality, the value for Q-factor must be above of the value 7. Figure 6 shows that the simulation Eye-diagram obtained from Optisystem software for 15 ONU/PORT. Eye diagram is used to analyse the performance of the signals received on the ONU. Based on the Eye diagram on Figure 6 the eye height is 4.24691e-5.
B. Design simulation
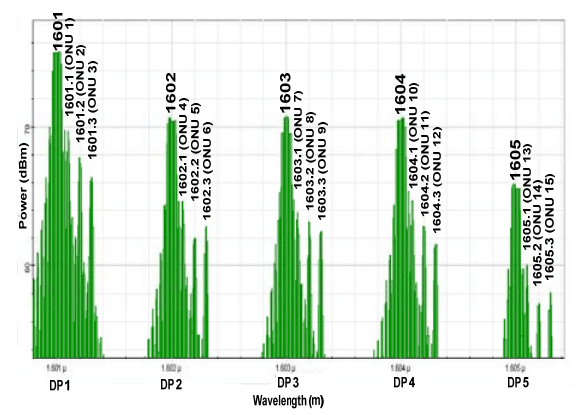
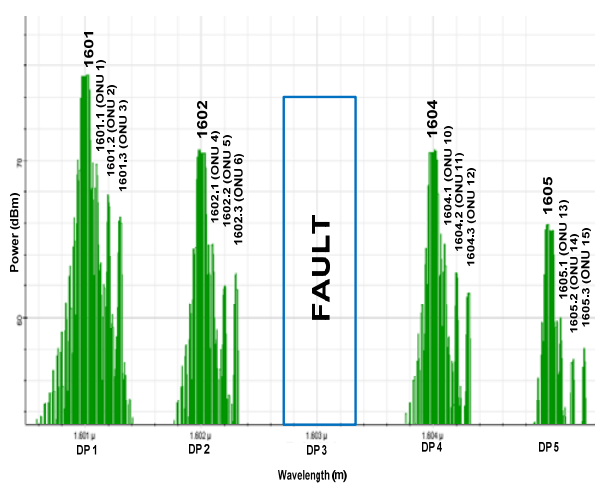
Optisystem software has been used to simulate the design configuration for the power line environment. Focusing on the multi-core environment, the wavelength of FBG is set to represent every port/line. The number of ports that can be produced using this design is 256. The bandwidth range is used from 1601.0 nm to 1632.8 nm. The first FBG will be used as an indicator of DP, 1601nm as the first DP (DP1) to 1632 nm as the 32nd DP (DP32) indicator. The second FBG used as an indicator of the port number, 0.1nm up to 0.8 nm for 8 ports at each DP. The port number can be read and analysed on the reflected spectrum of FBG in Optical Spectrum Analyzer (OSA). However, only 15 ports were simulated using this simulation as shown in Figure 7 and Figure 8 shows the results of FBG spectrum on the film network using OSA to analyse 15 ports.
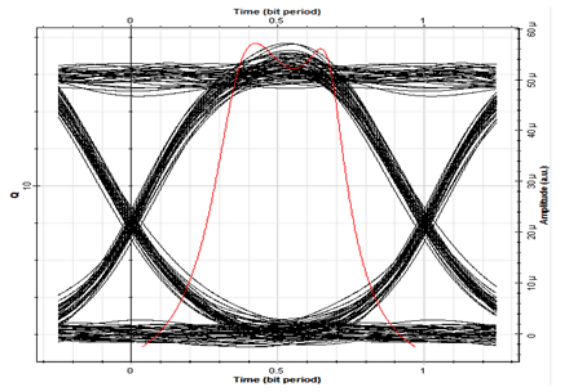
Table 1. List of bragg wavelength used for each FBG
C. Health monitoring supervisory
To prove the feasibility of this design, one of the ports has been set as a fault branch at the port 2 DP 1 as shown in Figure 9. The connection failure of this branch can be seen through OSA.
In this case, in Figure 8 Port 2 cannot be seen as the code at DP1 and the entire DP 3 was missing. Thus, fault branch can be seen by analysing the reflection code of the FBG spectrum on OSA device. Figure 10 is showing the analysis result of connection failure on Port 2.
Conclusion
It can be concluded that FBG sensor based in-situ is an efficient and effective network health monitoring technique that is essential for monitoring the condition of power line cables. Thus, effective technique to monitor network health was created using FBG configuration design to identify fault branches. Fiber Optic Distributed Coded FBG Sensing uses optical fiber to provide invaluable insight into power cable behaviour. Besides, FBG sensors are encoded by wavelength, making signal of FBGs immune to power fluctuations along the optical path, which was shown to measure line status condition with accuracy compared to many alternative techniques.
REFERENCES
[1] N. F. Naim, A. A. A. Bakar, and M. S. Ab-Rahman, “Realtime monitoring in passive optical access networks using L-band ASE and varied bandwidth and reflectivity of fiber Bragg gratings,” Opt. Laser Technol., vol. 79, pp. 45–51, May 2016, doi: https://doi.org/10.1016/j.optlastec.2015.11.008.
[2] -E Vasileiou, D. Agoris, E. Pyrgioti, and D. Lymberopoulos, “A review on the application of fiber optics on high voltage lines,” 2016. Accessed: Jun. 29, 2023. [Online]. Available: https://silo.tips/download/a-review-on-the-application-of-fiber-opticson-high-voltage-lines.
[3] Institute of Electrical and Electronics Engineers, IEEE Communications Society, and Vehicular Technology Society. Portugal Chapter, 2014 21st International Conference on Telecommunications (ICT) took place 4-7 May 2014 in Lisbon, Portugal. .
[4] M. A. H. A. I. M. Alaa hussein Ali, “The Design and Simulation of FBG Sensors for Medical Application,” Iraqi J. Comput. Commun. Control Syst. Eng., pp. 1–8, Oct. 2020, doi: http://dx.doi.org/10.33103/uot.ijccce.20.4.1.
[5] J. S. K. B. G. P. J. W. K. F. R. P. of E. and E. E. Jincy Johny*, “Theoretical investigation of positional influence of FBG sensors for structural health monitoring of offshore structures,” Ocean. 2017 – Aberdeen ., 2017, doi: doi.org/10.1109/OCEANSE.2017.8084976.
[6] K. B. Nguyen and S. Il Choi, “Fault Monitoring in Passive Optical Networks Using Burst-Mode FBG Optical Sensor,” in International Conference on Ubiquitous and Future Networks, ICUFN, 2019, vol. 2019-July, pp. 370–372, doi: 10.1109/ICUFN.2019.8806151.
[7] Y. Z. H. Z. Z. Z. Z. L. Q. C. and J. Kai Xie, “2018 International Conference on Power System Technology (POWERCON).,” Pract. Opt. fiber Sens. Technol. power Transm. lines towers, pp. 1–7, 2018, doi: https://doi.org/10.1109/POWERCON.2018.8601953.
[8] U. Senkans, J. Braunfelds, I. Lyashuk, J. Porins, S. Spolitis, and V. Bobrovs, “Research on FBG-Based Sensor Networks and Their Coexistence with Fiber Optical Transmission Systems,” J. Sensors, vol. 2019, 2019, doi: https://doi.org/10.1155/2019/6459387.
[9] B. K. Bhatia and E. M. Singh, “Design and Simulation of GPON networks over different FBG techniques,” IOSR J. Electron. Commun. Eng., vol. 12, no. 03, pp. 47–52, Jun. 2017, doi: https://doi.org/10.9790/2834-1203034752.
[10] N. F. Naim, M. S. Ab-Rahman, H. A. Bakarman, and A. A. A. Bakar, “Real-time monitoring in passive optical networks using a superluminescent LED with uniform and phase-shifted fiber Bragg gratings,” J. Opt. Commun. Netw., vol. 5, no. 12, pp. 1425–1430, Dec. 2013, doi: https://doi.org/10.1364/JOCN.5.001425.
[11] N. F. Naim, M. S. Ab-Rahman, N. H. Kamaruddin, and A. A. A. Bakar, “Real-time monitoring and fault locating using amplified spontaneous emission noise reflection for tree-structured Ethernet passive optical networks,” Opt. Eng., vol. 52, no. 9, p. 096112, Sep. 2013, doi: http://dx.doi.org/10.1117/1.OE.52.9.096112.
[12] N. F. Naim, A. A. A. Bakar, and M. S. Ab-Rahman, “Fault identification and localization for Ethernet Passive Optical Network using L-band ASE source and various types of fiber Bragg grating,” Opt. Fiber Technol., vol. 40, pp. 159–164, Jan. 2018, doi: https://doi.org/10.1016/j.yofte.2017.11.018.
Authors: M Hazwan Wahab, Prof Dr Mohammad Syuhaimi Ab Rahman, Dr Asrul Ahmad, A H Ahmad Abas, Norhidayah Ahmad. Quest International University, No. 227, Jalan Raja Permaisuri Bainun, 30250 Ipoh, Perak. Universiti Kebangsaan Malaysia, Department of Electrical and Electronic Engineering, 43600 Bangi, Selangor Malaysia E-mail: mhazwan34@gmail.com.
Source & Publisher Item Identifier: PRZEGLĄD ELEKTROTECHNICZNY, ISSN 0033-2097, R. 100 NR 6/2024. doi:10.15199/48.2024.06.48
