Published by Sri SUWASTI, Musrady MULYADI, Yiyin KLISTAFANI, Muhammad Ruswandi DJALAL, State Polytechnic of Ujung Pandang
Abstract: The implementation of Micro Hydro Power Plants (MHPP) serves as a crucial initiative to address the uneven distribution of electrical energy in remote areas across Indonesia. Before the permanent installation of an MHPP, field testing is imperative, involving the use of a model or prototype to gather location-specific data, assess reliability, and enhance insights into the MHPP’s functionality as an electrical energy generator. This research endeavors to comprehend the operation of the Cross-flow turbine MHPP system and ascertain its output power and efficiency. The testing process commences with the design of field test equipment, followed by manufacturing and assembly stages. Subsequently, equipment testing and data collection are conducted, and the obtained data is analyzed to determine the output power and efficiency of the MHPP system utilizing a Cross-flow turbine. The test parameters include water flow, head, turbine input power, generator output power, and overall MHPP system efficiency. Upon analyzing the results and engaging in discussions, it can be concluded that the test considered crucial parameters such as water flow, head, turbine input power, generator output power, and MHPP system efficiency. The highest efficiency recorded was under variable load conditions with a fluctuating discharge of approximately 0.025 m³/s, achieving 1.39% efficiency at a load of 80 W. The research findings indicate that variations in head and discharge significantly impact the efficiency of the MHPP system.
Streszczenie: Wdrożenie mikroelektrowni wodnych (MHPP) stanowi kluczową inicjatywę mającą na celu rozwiązanie problemu nierównej dystrybucji energii elektrycznej w odległych obszarach Indonezji. Przed stałą instalacją MHPP konieczne są testy w terenie, obejmujące wykorzystanie modelu lub prototypu w celu zebrania danych specyficznych dla lokalizacji, oceny niezawodności i lepszego wglądu w funkcjonalność MHPP jako generatora energii elektrycznej. Celem badań jest zrozumienie działania układu MHPP z turbiną krzyżową oraz określenie jej mocy wyjściowej i sprawności. Proces testowania rozpoczyna się od zaprojektowania sprzętu do testów w terenie, po którym następują etapy produkcji i montażu. Następnie przeprowadzane są testy sprzętu i zbieranie danych, a uzyskane dane są analizowane w celu określenia mocy wyjściowej i wydajności systemu MHPP wykorzystującego turbinę o przepływie krzyżowym. Parametry testu obejmują przepływ wody, wysokość podnoszenia, moc wejściową turbiny, moc wyjściową generatora i ogólną wydajność systemu MHPP. Analizując wyniki i wchodząc w dyskusję, można stwierdzić, że w badaniu uwzględniono kluczowe parametry, takie jak przepływ wody, wysokość podnoszenia, moc wejściowa turbiny, moc wyjściowa generatora oraz sprawność systemu MHPP. Najwyższą zarejestrowaną wydajność odnotowano w warunkach zmiennego obciążenia przy zmiennym przepływie wynoszącym około 0,025 m³/s, osiągając sprawność 1,39% przy obciążeniu 80 W. Wyniki badań wskazują, że zmiany wysokości podnoszenia i wyładowania znacząco wpływają na wydajność systemu MHPP. (Testowanie mikroelektrowni wodnej z turbiną o przepływie krzyżowym)
Keywords: Testing, Micro Hydro Power Plant; Efficiency; Cross-flow Turbine.
Słowa kluczowe: Testowanie, mikroelektrownia wodna; Efektywność; Turbina o przepływie krzyżowym.
1. Introduction
According to energy policy, the target for the New Renewable Energy (EBT) mix is 23% by 2025, with an ambitious goal of reaching 31% by 2050 [1, 2]. This national energy policy gained additional support with the government’s publication of the 2017 General National Energy Plan (RUEN), which outlined a capacity of 45.2 GW for NRE electricity generation in 2025 and an even more substantial target of 167.7 GW by 2050. However, as of 2021, the development of EBT into power plants has only reached 386 MW, contributing to around 13% of the overall goal [3].
To advance progress toward the EBT mix target, efforts can focus on developing the potential of local resources, such as water, for utilization in a hydroelectric power plant [4, 5]. This research specifically explores the adaptation of a hydroelectric power plant to the local environment, situated on a river in Maros Regency, South Sulawesi Province. The chosen scale for the hydropower plant is the MHPP, considered suitable for the context. Building upon the findings of previous research [6], an initial study was conducted to assess the potential for alternative energy by harnessing the hydropower resources of the Maros River in South Sulawesi Province.
The MHPP serves as an alternative energy conversion tool, providing an opportunity to enhance the role and potential of local energy sources. Recognizing the water energy potential in the Tombolo hamlet area, Tompobulu village, Tompobulu sub-district, Maros Regency, South Sulawesi Province, there are multiple water resources available for utilization by the MHPP. A water turbine is a machine driven by water, where the working fluid is water itself. It operates based on the working principle of a turbine, utilizing the momentum of its working fluid to convert the potential energy of water into mechanical energy [7, 8].
The use of a cross-flow turbine type proves to be more advantageous than employing a water wheel or other micro-hydro turbine types [9, 10]. For instance, the average efficiency of the cross-flow turbine surpasses that of a water wheel [11, 12]. Laboratory tests conducted by the Ossberger turbine factory revealed that even the most superior water wheel type achieved only 70% efficiency, while the cross-flow turbine demonstrated an efficiency of 82% [13]. This heightened efficiency is attributed to the dual utilization of water energy in the cross-flow turbine: first, the impact energy of water on the blades during entry, and second, the thrust of water on the blades as it exits the runner. This multi-level water operation provides advantages in terms of high effectiveness and simplicity in the water output system from the runner.
Numerous tests on cross-flow turbines have been conducted previously. For instance, [14] delves into the Design and Analysis of Cross Flow Turbines for Micro Hydro Power Plant Applications Using Waste Water. Another study, [15], explores the design and characterization of a vertical axis cross-flow hydrokinetic turbine, emphasizing dimensions that maximize blockage of water circulation in the channel at very low speeds. Additionally, research [16] focuses on the optimal design of a cross-flow turbine, aiming to enhance performance by geometrically modifying several parameters.
The MHPP Cross Flow Turbine, previously tested in the Energy Conversion Lab at the State Polytechnic of Ujung Pandang in 2022, was the subject of a research project titled ‘Design and Build a Prototype of a Cross Flow Turbine Type MHPP’ [17]. The laboratory testing yielded an efficiency of 2.329% under load conditions with variable blade openings. Additionally, when the rotating blades differed by 5 degrees and with fixed guide blade openings under varying loads, the efficiency was recorded at 4.148% for a 20 Watt load, 3.999% for a 40 Watt load, and 3.679% for a 60 Watt load. Building on these laboratory tests, the research is set to advance to field tests in Tombolo hamlet, Tompobulu village, Tompobulu sub-district, Maros Regency, South Sulawesi Province.
2. Research Methods
This research was conducted in Tombolo hamlet, Tompobulu village, Tompobulu sub-district, Maros Regency, South Sulawesi Province, with coordinates 5°07’07.9″S 119°42’48.4″E. The study commenced in February 2023 and concluded in August 2023. The stages of conducting this research are detailed as follows:
2.1. Design Stage
Activities carried out at this stage include:
• Determine the test location to be used.
• Designing a Cross-flow Turbine Type MHP Installation System
2.2. Assembly Stage
After completing the design process, the next phase involves the tool assembly process. The steps taken are as follows:
• Prepare all tools and materials for use.
• Assemble the Cross-flow turbine.
• Assemble the electrical system.
• Create pipe support frames.
• Install pipes on dams and retaining frames.
• Install the intake pipe to the turbine.
2.3. Data Collection Technique
This test aims to assess the power produced by the Cross-flow turbine in the Micro Hydro Power Plant. Data is collected once the simulator is operational, under the following test conditions:
• Retrieve MHPP data during no-load conditions.
• Retrieve MHPP data under loaded conditions.
2.4. Testing Stage
After the assembly is complete, the next phase involves tool testing and data collection. The steps to be taken are as follows:
• Calibrate all measuring instruments.
• Ensure the frames connected to each other are secure and not loose.
• Confirm water entry into the pipe.
• Check for any leaks in the pipe.
• Verify that the turbine rotates properly.
• Conduct the testing process.
• Retrieve data on head, water flow, AC generator output voltage, and current.
2.5. Data Analysis Technique
This MHPP test aims to analyze the system efficiency generated by a Cross-Flow type MHPP system. The data to be analyzed includes:
• Hydraulic Power (Ph) with the formula (1):
(1) Ph = ρ.g.Q.Hn (Watt)
With: Ph = Hidraulic Power (Watt); Ρ = Density (kg/m3 ); G = Earth’s Gravity (9.81 m/s2 ); Q = Water Discharge (m3/s); H= Head (m)
• Generator power (Pg) as output power using formula (2):
(2) Pout = V.I (Watt), V = Voltage (Volt). I = Current (Ampere)
• Efficiency System (ᶯs)
(3) Eff = (Pout/Pin).100%
With: Pout = Output Power; Pin = Input Power
3. Results and Discussion
3.1. Test Data Analysis
Calculation of No-Load Turbine Data
1) Water Discharge Calculation (Q)
Average observation time = 86.15 s
Observation distance = 2 m
Average observation depth = 2 m
Average observation depth = 0.43 m
Calculate the acceleration of water
U = p/t = (2 m)/(86.15 s) = 0.023 m/s
Calculate the acceleration of water
A = l . t = 2 m . 0.43 m = 0.86 m2
Q = U . A = 0.023 m/s x 0.86 m2 = 0.02 m3/s
Calculation of correction factors
Assume correction factor = 0.8 for open channels
Q = U . A . 0,8 = 0.023 m/s x 0.86 m2 x 0.8 = 0.016 m3/s
2) Input Power Calculation (Pin)
ρ = 1000 kg/m3
Q = 0.016 m3/s
g = 9.8 m/s2
H = 6.12 m
Pin = ρ.Q.g.H = 1000 kg/m3. 0.016 m3/s . 9.8 m/s2. 6.12 m = 958.89 Wa
Calculation of DC Loaded Turbine Data
Head = 6.12 m
AC Voltage = 8.867 V
AC Current = 0.186 A
DC Voltage = 8.867 V
DC Current = 0.186 A
Generator Rotation = 218.700 rpm
Turbine Rotation = 51.050 rpm
Debit = 0.016 m3/s
1) Input Power Calculation (Pin)
ρ = 1000 kg/m3
Q = 0.016 m3/s
g = 9.8 m/s2 H = 6.12 m
Pin = ρ.Q.g.H = 1000 kg/m3 . 0.016 m3/s . 9.8 m/s2 . 6.12 m = 958.89 Watt
2) Output Power Calculation
Pout = V . I = 8.867 V x 0.186 A = 1.65 Watt
3) Efficiency Calculations
Eff = (Pout/Pin) . 100% = (1.65 Watt / 958.89 Watt) . 100% = 0.23

Calculation of AC Loaded Turbine Data
Head = 6.12 m
Generator Voltage = 44.68 V
Generator Current = 0.129 A
Regulator Voltage = 103 V
Regulator Current = 0.048 A
Generator Rotation = 1106.45 rpm
Turbin Rotation = 244.43 rpm
Debit = 0.025 m3/s
1) Input Power Calculation (Pin)
ρ = 1000 kg/m3 Q = 0.025 m3/s
g = 9.8 m/s2 H = 6.12 m
Pin = ρ.Q.g.H = 1000 kg/m3 . 0.025 m3/s . 9.8 m/s2 . 6.12 m = 1488.83 Watt
2) Output Power Calculation
Pout = V . I = 44.68V . 0.129 A = 5.77 Watt
3) Efficiency Calculations
Eff = (Pout/Pin) . 100% = (5.77 Watt / 1488.83 Watt) . 100% = 0.33 %
3.2. Data Analysis Results Graph
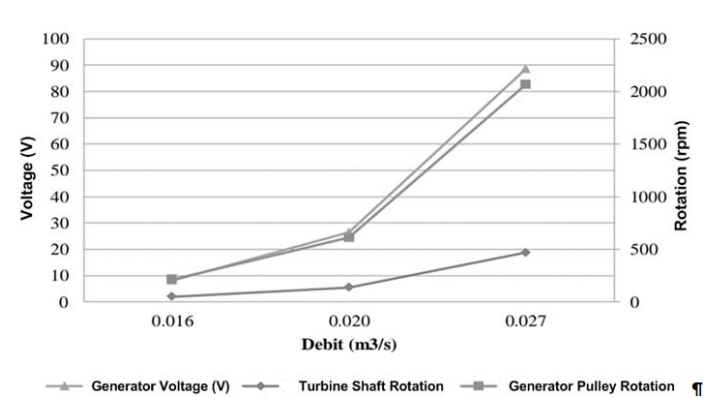
Figure 1 illustrates the relationship among generator pulley rotation, turbine shaft rotation, and generator voltage. As the discharge of the turbine increases, both turbine shaft rotation and generator pulley rotation similarly increase, resulting in elevated generator voltage values. Notably, at the lowest discharge condition of 0.027 m³/s, the turbine shaft rotation achieves its peak at 468.97 rpm, and the generator pulley rotation reaches 215.82 rpm. Conversely, the highest discharge condition of 0.016 m³/s corresponds to the lowest values, with turbine shaft rotation at 49.39 rpm and generator pulley rotation at 2068.225 rpm. This data demonstrates a direct impact of discharge amount on the rotation of the turbine shaft and generator pulley. The influence stems from the water pressure on the rotation of both components. Specifically, a higher water discharge into the turbine results in accelerated turbine rotation. This acceleration is reflected in a threefold increase in generator pulley rotation, ultimately leading to a substantial voltage output.
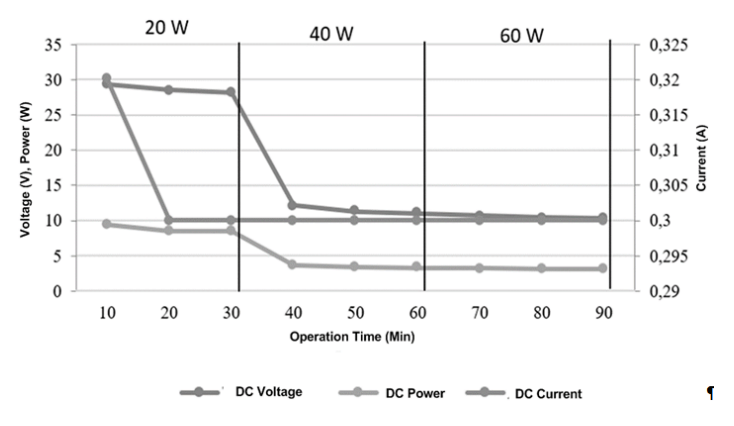
In Figure 2, the relationship between voltage and current concerning the lamp load is depicted, revealing an inverse proportionality as the lamp load increases. The highest recorded values are 29.3 Volts for voltage, 0.32 A for current, and 9.38 W for power, observed at a lamp load of 20 W. Conversely, the lowest values are 10.3 Volts for voltage, 0.3 A for current, and 3.09 W for power, occurring with a lamp load of 60 W. Observing the graph, it’s evident that voltage, current, and power undergo fluctuations in response to changes in the lamp load. These fluctuations are influenced by variations in water discharge, although efforts are made to maintain a constant water discharge during the data collection time interval.
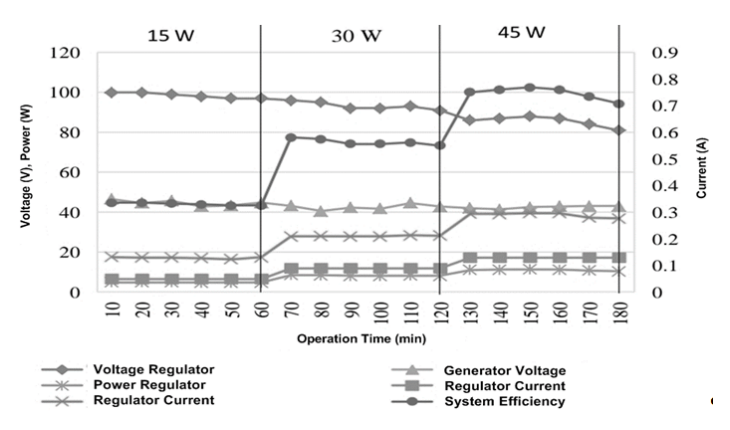
In Figure 3, the relationship between voltage and current in response to the AC lamp load is depicted, revealing an inverse proportionality as the lamp load increases. The highest generator voltage is recorded at 46.6 V, with the lowest generator current at 0.128 A. Simultaneously, the regulator exhibits its highest voltage at 100 V, the lowest regulator current at 0.05 A, and the lowest power at 4.85 W, all occurring with a light load of 15 W. Conversely, the lowest generator voltage is 39.3 V, with the highest generator current at 0.297 A. The regulator’s lowest voltage is 81 V, with the highest regulator current at 0.13 A and the highest power at 11.44 W, observed with a light load of 45 W. The system efficiency reaches its peak at 0.77% for a 45 W lamp load, while the lowest efficiency is 0.33% for a 15 W lamp load. The graph illustrates fluctuations in voltage, current, and power in response to changes in the lamp load. These fluctuations are influenced by variations in water discharge, although efforts are made to maintain a constant discharge during the data collection interval.
Figure 4 illustrates the relationship between voltage and current in response to the AC lamp load, revealing an inverse proportionality as the lamp load increases. The highest recorded generator voltage is 41 V, with the lowest generator current at 0.248 A. Concurrently, the regulator exhibits its highest voltage at 99 V, the lowest regulator current at 0.11 A, and the lowest power at 10.01 W, observed with a light load of 40 W. Conversely, the lowest generator voltage is 30.6 V, with the highest generator current at 0.612 A. The regulator’s lowest voltage is 71 V, with the highest regulator current at 0.29 A and the highest power at 21.17 W, noted with a light load of 120 W. The system efficiency reaches its peak at 1.42% for a 120 W lamp load, while the lowest efficiency is 0.67% for a 40 W lamp load. The graph depicts fluctuations in voltage, current, and power in response to changes in the lamp load, influenced by variations in water discharge. It is noteworthy that efforts are made to maintain a constant water discharge during the data collection interval.
4. Conclusion
1. In the DC system, the highest output power is 9.38 Watts, observed at a load of 20 Watts with a discharge of 0.02 m³/s. Conversely, the lowest output power is 2.14 Watts, recorded at a load of 20 Watts with a discharge of 0.016 m³/s. For the AC system, the highest output power is 23.76 Watts, noted at an 80 Watts load, while the lowest output power is 4.04 Watts, observed at a 15 Watts load. 2. In the DC system, the highest efficiency, recorded at 0.80%, was achieved under conditions with a discharge load of 0.02 m³/s, corresponding to a lamp load of 20 W. Conversely, the lowest efficiency, at 0.22%, was observed with a 20 W lamp load at a discharge of 0.016 m³/s. For the AC system, the highest efficiency, reaching 1.60%, was attained under conditions with a discharge load of 0.025 m³/s and a lamp load of 80 W. In contrast, the lowest efficiency, at 0.27%, was recorded with a lamp load of 15 W under similar conditions
REFERENCES
[1] H. Handoko, A. Adianto, and S. C. Loon, “The effect of population behavior on new renewable energy in primary energy mix for 2025 national target: sumedang regency review, west java,” Journal of Ocean, Mechanical and Aerospace science and engineering-, vol. 64, no. 1, pp. 1-8, 2020.
[2] M. Azhar, S. Solechan, R. Saraswati, P. Suharso, S. Suhartoyo, and B. Ispriyarso, “The New Renewable Energy Consumption Policy of Rare Earth Metals to Build Indonesia’s National Energy Security,” in E3S Web of Conferences, 2018, vol. 68: EDP Sciences, p. 03008.
[3] A. Q. Al-Shetwi, “Sustainable development of renewable energy integrated power sector: Trends, environmental impacts, and recent challenges,” Science of The Total Environment, vol. 822, p. 153645, 2022/05/20/ 2022, doi: https://doi.org/10.1016/j.scitotenv.2022.153645.
[4] C. Buana, M. R. Djalal, I. Ikram, M. Iqbal, And L. L. La Ode Musa, “Performance Analysis of Micro Hydro Power Plants Using a Pelton Turbine with Two Nozzle Variations,” Przeglad Elektrotechniczny, vol. 2023, no. 7, 2023, doi: 10.15199/48.2023.07.16.
[5] F. Firman, M. Y. Yunus, M. Anshar, N. Hamzah, Y. Klistafani, And M. R. Djalal, “Design Modification of Water Wheel Turbine With Various Configuration Variations,” Przeglad Elektrotechniczny, vol. 2023, no. 6, 2023, doi:10.15199/48.2023.06.46.
[6] D. Yelvius, S. Sitampang Bato’, B. Erni Rante, and T. Benyamin, “Hydrological and Hydropower Potential of Maros River Hydroelectric Power Plant/PLTM, South Sulawesi,” Paulus Civil Engineering Journal, vol. 1, no. 1, 01/24 2020, doi: 10.52722/pcej.v1i1.50.
[7] M. Khattak, N. M. Ali, N. Z. Abidin, N. Azhar, and M. Omar, “Common Type of Turbines in Power Plant: A Review,” Journal of Advanced Research in Applied Sciences and Engineering Technology, vol. 3, no. 1, pp. 77-100, 2016.
[8] R. D. Muhammad and K. Nasrun, “Optimal design of energy storage for load frequency control in micro hydro power plant using Bat Algorithm,” SINERGI, vol. 26, no. 1, pp. 8-14, 2022, doi: http://dx.doi.org/10.22441/sinergi.2022.1.002.
[9] O. OYEBODE and J. OLAOYE, “Comparative performance evaluation of pelton wheel and cross flow turbines for power generation,” European Mechanical Science, vol. 3, no. 1, pp. 6-12, 2019.
[10] A. M. Kaya, İ. Kandemir, M. F. Akşit, and K. S. Yiğit, “Investigation of optimum working conditions of a micro cross flow turbine,” Environmental Progress & Sustainable Energy, vol. 34, no. 5, pp. 1506-1511, 2015.
[11] Y. Nishi, T. Inagaki, Y. Li, and K. Hatano, “Study on an undershot cross-flow water turbine with straight blades,” International Journal of Rotating Machinery, vol. 2015, 2015.
[12] S. Patel and P. N. Pakale, “Study on power generation by using cross flow water turbine in micro hydro power plant,” International journal of research in engineering and technology, vol. 4, no. 05, pp. 1-4, 2015.
[13] M. Hidayat, F. Ronilaya, I. Eryk, and G. Joelianto, “Design and analysis of a portable spiral vortex hydro turbine for a Pico Hydro Power Plant,” in IOP Conference Series: Materials Science and Engineering, 2020, vol. 732, no. 1: IOP Publishing, p. 012051.
[14] M. A. Khan and S. Badshah, “Research Article Design and Analysis of Cross Flow Turbine for Micro Hydro Power Application using Sewerage Water,” Research Journal of Applied Sciences, Engineering and Technology, vol. 8, no. 7, pp. 821-828, 2014.
[15] R. Espina-Valdés, A. Fernández-Jiménez, J. F. Francos, E. B. Marigorta, and E. Álvarez-Álvarez, “Small cross-flow turbine: Design and testing in high blockage conditions,” Energy Conversion and Management, vol. 213, p. 112863, 2020.
[16] N. Acharya, C.-G. Kim, B. Thapa, and Y.-H. Lee, “Numerical analysis and performance enhancement of a cross-flow hydro turbine,” Renewable energy, vol. 80, pp. 819-826, 2015.
[17] M. Abidin and M. T. Radani, “Design and Construction of a Cross-flow Turbine Type Micro Hydro Power Plant (PLTMH) Prototype,” State Polytechnic of Ujung Pandang, 2022.
Authors: Sri Suwasti, Musrady Mulyadi, Yiyin Klistafani, Muhammad Ruswandi Djalal, Departement of Mechanical Engineering, State Poytechnic of Ujung Pandang, Emails: sri_suwasti@poliupg.ac.id. musradymulyadi@poliupg.ac.id, yiyin_klistafani@poliupg.ac.id, wandi@poliupg.ac.id.
Source & Publisher Item Identifier: PRZEGLĄD ELEKTROTECHNICZNY, ISSN 0033-2097, R. 100 NR 6/2024. doi:10.15199/48.2024.06.51
