Published by Petr ZÁVADA1, Karel SOKANSKÝ1, VSB – Technical University of Ostrava (1)
Abstract. Today, the development of power generation from renewable sources is an effort to maximize the share of total energy consumption. Big source of energy in solar and wind power plants are mostly connected to the distribution network and supply the energy only if it produces (solar power station produced during the day and wind power station produced when is a wind acceptable). For this reason, the energy from these sources are not available for all day and must be taken from other power station (atomic power plant, coal-fired power plant). Our project is designed the source of power which is combined solar power plane, wind power plane and batteries so that electrical energy will be supplied during the all day. The article deals with the study of power consumption of electricity of family house. These houses can be in less occupied areas with their own heating systems. Next step is distribution of household appliances into several categories by the most importance electrical power supplying.
Streszczenie. Aktualny rozwój produkcji energii elektrycznej ze źródeł odnawialnych powoduje starania o mozliwie największy udział tej energii w stosunku do całkowitego jej zużycia. Wielkie źródła energii z elektrowni słonecznych bądź wiatrowych są w większości przyłączone do sieci dystrybucyjnej i dostarczają enegię wtedy, kiedy ją produkują (elektrownie słoneczne w ciągu dnia a wiatrowe przy odpowiedniej sile wiatru). Powoduje to, że energia z tych źródeł nie jest dostępna stale a w czasie, kiedy nie jest produkowana koniecznym jest jej zastąpienie z innych źródeł. Projekt SGS jest propozycją żródła energii, które jest połączeniem baterii słonecznych, elektrowni wiatrowej i akumulatorów tak, aby była możliwa dostawa energii o stałej wartości podczas całego dnia. Artykuł zawiera studium zużycia energii elektrycznej w grupie docelowej (domy na terenie z niższą gęstością zaludnienia z własnym ogrzewaniem za pomocą paliw stałych), czyli w zasadzie przeciętnego domu jednorodyinnego dla sześciu osób a także podział domowych urządzeń elektrycznych na kilka kategorii według priorytetów dostaw energii elektrycznej. (Harmonogram zużycia dziennego energii elektrycznej, urządzenia elektryczne i ich kategoryzacja ze względu na ważność).
Keywords: solar power plane, wind power plane, batteries, power consumption, power supplying.
Słowa kluczowe: elektrownia słoneczna, elektrownia wiatrowa, akumulator, zużycie energii w domu, priorytet dostawy energii.
Introduction
Supply of energy in batteries for immediate consumption is limited and it is the necessary recharge. It can be by using with renewable sources as solar panels and wind turbines. The combination of these two sources are chosen so that the production of sufficient energy to recharge throughout the year. This means that in the summer months primarily relies on solar collectors and in winter months (more windy) production with wind power.
Using batteries as a power supply recharging by solar and wind power
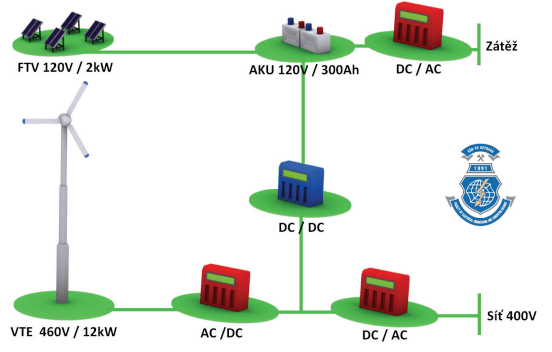
On figure 1 is a block diagram of the proposed project. As a source for batteries recharging, which have a capacity 300Ah and 120 V output voltage, is wind power energy and solar panels. Wind power has 12 kW output power and solar panels has 2 kW output power. For recharging batteries is also possibility used distribution network as is on block diagram (picture 1). Batteries are able to supply the theoretical performance 36 kWh.
Description of the examined family house
To determine the daily diagram of consumption has been selected family house in which permanently 5 people life. Researched family house is built on the outskirts of the village. The house has a solid fuel boiler for heating and hot water. Used home appliances in the house with their consumption are listed in Table 1.

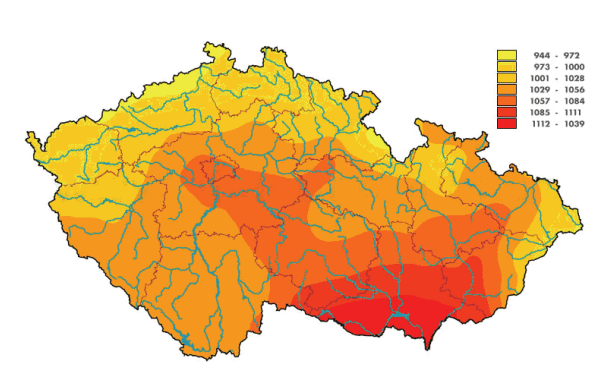
Site build house, the average wind speed at 100 meters above the ground is between 25-50 m/s (figure 3) and average total annual solar radiation is 944-972 KWh/m2 (figure 4).

Measurement of daily chart selected house
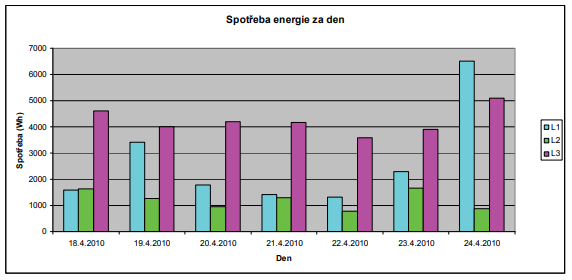
Family home was measured starting from April 17, 2010 11:01:00 April 25 and ending 2010 4:41:00 p.m. Measurement was carried out using apparatus MDS10 and the results were evaluated in program MDS10 and in program Excel. Measurement voltage range was set to 230 V and current range was set to 30 A. Statistical analysis of measurement and evaluation of the individual days (only all day long measurement) are shown in Figures 5 and 6.
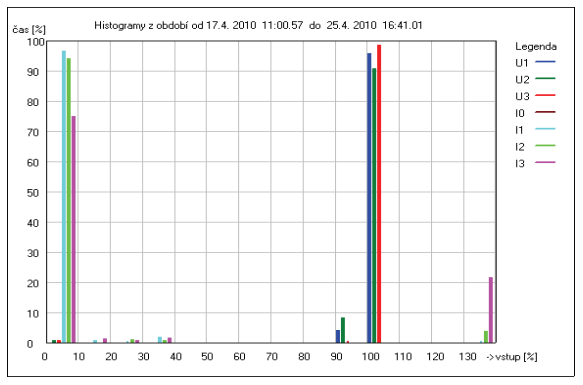
In the statistical processing can be seen that the currents move in areas over 130%. These values are due to error in measurement.
The following table there are each household appliances with their average consumption. At next columns there are power consumption per day and per year and average length of working in one day. Appliances are divided into three priorities, where the first priority involves appliances that are permanently in operation and are necessary for safety. The lower rows of the table are given priority for individual consumption and for separately priority consumption.
Table 1: Domestic Appliances and setting priorities:
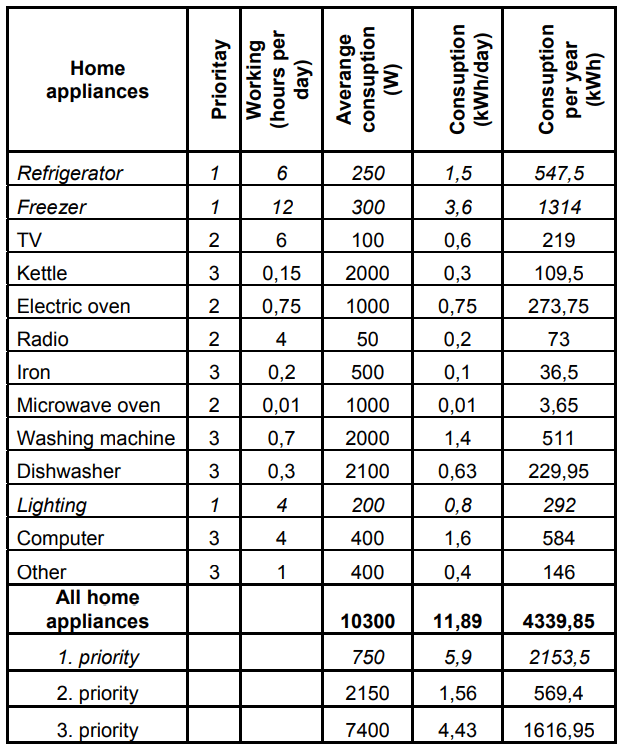
All appliances are single phase and their total power is 10300 W. If we consider an ideal situation, so the voltage is 230 V to the total consumption of all appliances is about 45 Ah. With a 300 Ah battery power is possible to operate all appliances 6.7 hours. If we consider only the first priority it will be 92 hours.
Conclusion
According to the daily chart, the current consumption in all phases of moving most of the day from 0% to 10% of the set current range (30 A), which is approximately up to 3 A. In this case, the unit lasted about 33 hours. The simplified calculations are not considered losses in individual blocks and are also considered the current charging rechargeable batteries, solar and wind power.
Acknowledgement
This article was created under poject SP/201073, “Využití hybridních obnovitelných zdrojů elektrické energie”
REFERENCES
[1] Murtinger, K., Beranovský, J., Tomeš, M.: Fotovoltaika – elektřina ze Slunce 1. vydání, ERA, 2007
[2] Hradílek, Z. Elektroenergetika distribučních a průmyslových zařízení,VŠB-TU Ostrava, MONTANEX a.s., 2008
[3] Větrná mapa. ČSVE: Česká společnost pro větrnou energii [online]. 19.03.2009, [cit. 30.05.2010]. Dostupný z WWW: <http://www.csve.cz/clanky/detail/35>
Authors: Ing. Petr Závada, E-mail: petr.zavada@vsb.cz; prof. Ing Karel Sokanský, CSc. E-mail: karel.sokansky@vsb.cz. VŠB-TU Ostrava, Department of Electrical Power Engineering – 410, 17. listopadu 15, 708 33, Ostrava – Poruba, Czech Republic,
Source & Publisher Item Identifier: PRZEGLĄD ELEKTROTECHNICZNY (Electrical Review), ISSN 0033-2097, R. 87 NR 7/2011
