Published by Małgorzata ZYGARLICKA1, Jarosław ZYGARLICKI2, Politechnika Opolska, Instytut Automatyki i Informatyki (1) Politechnika Opolska, Instytut Elektroenergetyki i Energii Odnawialnej (2)
Abstract. The paper presents a new proposal for the presentation of the harmonic distortion of the power signals. The proposed method uses a simplified method of harmonic analysis – five ordinates method by which a transient characteristics of the power grid is represented. The article presents sample analysis of real-life power signals.
Streszczenie. Artykuł przedstawia nową propozycję prezentacji zniekształceń harmonicznych dla sygnałów elektroenergetycznych. Proponowany sposób wykorzystuje uproszczoną metodę analizy harmonicznych – metodę pięciu rzędnych, dzięki której odtwarzana jest charakterystyka przejściowa układu czwórnika reprezentującego badaną sieć elektroenergetyczną. W artykule zmieszczono przykładowe analizy rzeczywistych sygnałów elektroenergetycznych. (Sposób prezentacji zniekształceń harmonicznych sygnałów elektroenergetycznych).
Keywords: power quality, signal analysis, signal processing, harmonics
Słowa kluczowe: jakość energii elektrycznej, analiza sygnałów, przetwarzanie sygnałów, harmoniczne
Introduction
Harmonic distortion of electrical signal is one of the basic parameters to describe the quality of electric energy. An analysis of harmonic distortion levels enables to specify the causes of states that occur in the power supply network and cause malfunction of connected appliances. Harmonic distortion in the power grid is caused by appliances with non-linear characteristics of power consumption. The proposed method of presenting harmonic distortion enables to identify the sources of distortion by observing transient characteristics, as reconstructed on the basis of the harmonic distortion, of the four-pole system representing power grid together with appliances connected to it.
This article has been divided into 5 main sections. The first section is an introduction to the subject of this paper. The second section describes the proposed method of presenting the harmonic distortion. The next section describes the measurement system and method of recording signals subjected to analysis. The fourth section presents the tests and discussion of obtained results. The last section presents the conclusions of this study.
Description of method
Total Harmonic Distortion (THD) is the most popular factor to quantitatively describe the parameters of the electric energy quality. This factor is defined as the ratio between the amplitude of signal’s higher harmonics and amplitude of the fundamental harmonic component:
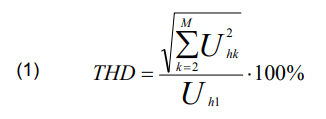
where: M is the number of harmonic components, for which THD is calculated, Uhk it is the amplitude of k-th harmonic component for k = 1, 2, …, M, Uh1 is the amplitude of the fundamental harmonic component. THD measurement, in testing the quality of electric energy, is carried out by means Fourier transform of the electrical signal. In diagnosing the state of the power supply network, factors that describe the share of individual harmonics in the analysed signal, are also used.
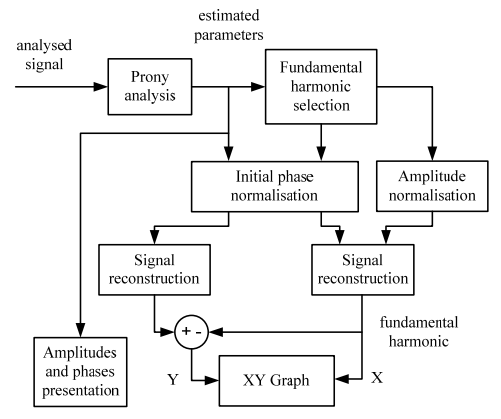
However, it has been found out that analysis of results that describe the levels of harmonics does not directly reveal the causes of harmonics’ generation in electrical wiring systems; thus, the idea to apply the method of five-ordinates [1], [2] to reconstruct the transient characteristics of the four-pole system representing power supply network together with connected appliances causing interference. Schematically, the idea of the proposed method of presenting the harmonic distortion is shown in Figure 1. The input signal is a perfect sinusoid that represents the supply voltage waveforms without harmonic distortion. In reality, the recorded signal – the output signal in Figure 1, is distorted due to the occurrence of non-linear loads in the power supply network. On the basis of the calculated amplitudes and initial phases of individual harmonics, it is possible to reconstruct the transient characteristics of the system presented in this way. The parameters of signals were calculated using Prony’s method [3] – [6]. The shape of this characteristics shows the characteristic points, based on which, it is possible to deduct the causes of harmonics’ formation.
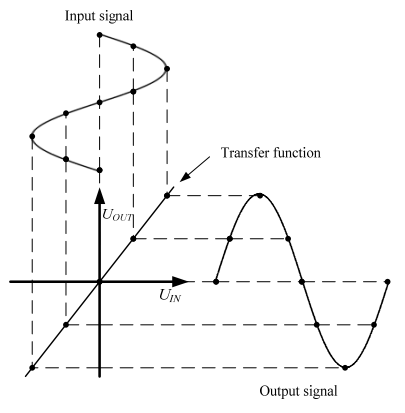
However, the reconstructed characteristics, as obtained in this way, will not clearly reveal the distortion caused by the harmonics, since such distortion has low amplitude in relation to the fundamental component 50 Hz. In order to enhance the clarity of the analysis, in the proposed method of presenting distortion, the values that are a difference between the values of voltages resulting from an ideal transient characteristics and real characteristics are presented on the axis of ordinates. In this way, clarity of phenomena occurring during distortion generation, has been significantly improved.
Measurement system
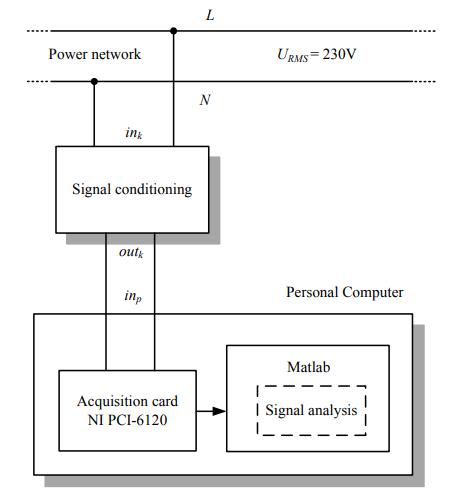
The measurement system, as shown in Figures 2 and 3, has been used in this study. Real signals from the power grid, which are voltage waveforms, are applied at the input of the signal conditioning system. In this system, the amplitude of voltage waveforms is reduced to a level acceptable by the input of the A/C transformer. From the output of the signal conditioning system, the voltage waveforms are applied to the input of the measurement card, in this card they are converted to a digital form, which is processed in the next step in the Matlab computing environment according to the proposed algorithm. Sample signals were recorded with a resolution of 16 bits and a sampling frequency of 12,8 kHz.
Tests
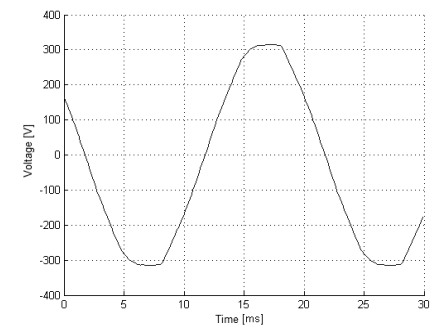
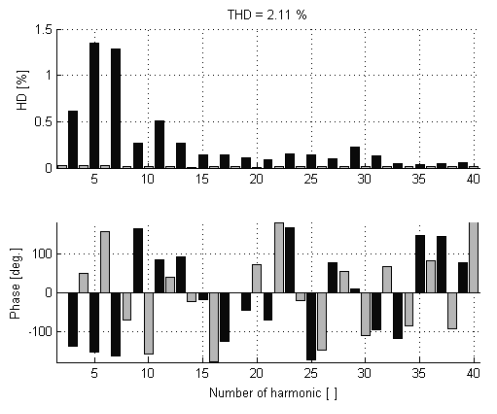
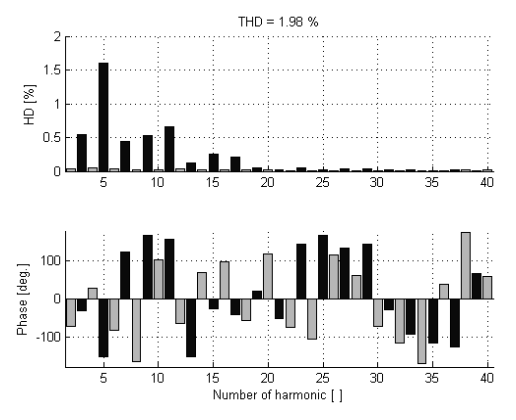
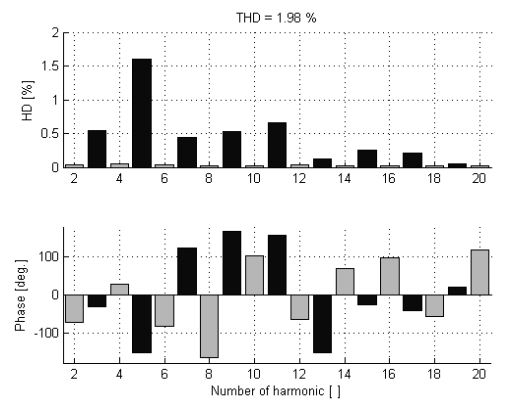
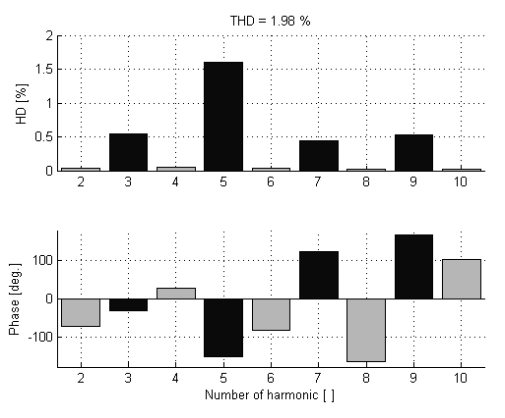
Figures 4-7 show the results for the sample #1 signal recorded in the low voltage network in building II of Opole University of Technology, 76 Prószkowska Street, on 24 January 2016 at 11:26. Figure 4 shows a section of time voltage waveform. Figure 5 illustrates the designated levels of harmonics, their initial phases and THD. Figures 6 and 7 show the proposed method of presenting distortion for 10 and 40 harmonics respectively. “H1 deviation” on Figure 6 and 7 shows overvoltage event of measured fundamental harmonic.
After analysis of Figure 5, the person diagnosing given power supply network, apart from the level of individual harmonics, is not able to determine the nature of the observed distortions. While the method proposed in Figures 6 and 7 reveals that the harmonic distortions appear mainly in areas adjacent to the absolute maximum values of momentary voltage, meaning on the extremes of the transient characteristics. Such an observation suggests that in the given system, the appliances generating interference take current in pulses near the absolute maximum values of voltage waveform. Additionally, a different distortion of characteristics is noticeable for an increasing voltage waveform and a different one for decreasing waveform, which in this case, suggests the source of interference of capacitive nature. Thus, in the presented case, the harmonic distortion is largely generated by the switching power supplies, e.g. computer power supplies.
After comparing Figure 6 and 7, an increase in the detail of diagrams is noticeable, which results from including a larger number of harmonics in creating the transient characteristics. However, it appears, that in this case, the characteristics created already on the basis of the first 10 harmonics make it possible to correctly carry out a diagnosis of sources of interference in the power supply network.
Other results for real life samples of signals recorded in another buildings of Opole University of Technology (signal #2, signal #3 and signal #4) are shown on Figures 8-14.
Conclusions
The proposed new method of presenting harmonic distortion of electrical signals enables to make a more accurate analysis of the phenomena occurring in the power supply networks, as compared to traditional methods based only on an analysis of the harmonic levels. This method enables to determine the causes of harmonics through reconstruction, based on amplitudes and initial phases, of the transient characteristics of four-pole system representing power grid together with connected appliances. In this way, the diagnostics of the power supply network’s states causing failure or malfunction of appliances becomes more reliable and its interpretation more simplified.
REFERENCES
[1] Zygarlicki J., Mroczka J., Method of testing and correcting Signac amplifiers’ transfer function using Prony analysis, Metrology and Measurement Systems (M&S), 19 (2012), nr.3, 489-498
[2] Cykin G., Wzmacniacze sygnałów elektrycznych, WKŁ, Warszawa, 1964
[3] Zygarlicki J., Mroczka J., Prony method used for testing harmonics and interharmonics of electric power signals, Metrology and Measurement Systems (M&S),19 (2012), nr.4, 659-672
[4] Zygarlicki J., Mroczka J., Praktyczne zastosowanie zredukowanej metody Prony’ego – badanie napięciowych układów wejściowych urządzeń monitorujących jakość energii elektrycznej, Przegląd Elektrotechniczny, 5 (2011), 199-203
[5] Rezmer J., Lobos T., Estymacja spektralna zniekształconych sygnałów z zastosowaniem metody Pronego, Przegląd Elektrotechniczny, 10 (2003), 735-738
[6] Hong Li, Zhong Li, Wolfgang A. Halang, Bo Zhang, Guanrong Chen, Analyzing chaotic spectra of DC–DC converters using the Prony method. IEEE Trans. Circuits and Systems-II: Express Briefs, 54 (2007), n.1, 61-65
Autors: dr inż. Małgorzata Zygarlicka, Politechnika Opolska, Instytut Automatyki i Informatyki, ul. Prószkowska 76, 45-758 Opole, E-mail: m.zygarlicka@po.opole.pl; dr hab. inż. Jarosław Zygarlicki, Politechnika Opolska, Instytut Elektroenergetyki i Energii Odnawialnej, ul. Prószkowska 76, 45-758 Opole, E-mail: j.zygarlicki@po.opole.pl
Source & Publisher Item Identifier: PRZEGLĄD ELEKTROTECHNICZNY, ISSN 0033-2097, R. 92 NR 11/2016. doi:10.15199/48.2016.11.18
