Published by Salama MANJANG1, Yuli Asmi RAHMAN2,
University of Hasanuddin (1), University of Tadulako (2), Indonesia
Abstract. The purpose of this study is to optimize the location and capacity of PV in the feeder distribution system 20 kV of Central Sulawesi, Indonesia. The proposed method uses the optimization method of development from the genetic algorithm, namely NSGA-II. Optimization is carried out in three scenarios by considering the value of the total active PV power capacity which produces the minimum active power loss and voltage deviation. The simulation result shows that the integration of PV-DG can improve drop voltage of distribution system performance due to load growth effect.
Streszczenie. Celem tego badania jest optymalizacja lokalizacji i wydajności PV w systemie dystrybucji zasilania 20 kV w środkowym Sulawesi w Indonezji. Proponowana metoda wykorzystuje optymalizację opartą na algorytmie genetycznym, mianowicie NSGA-II. Optymalizację przeprowadza się w trzech scenariuszach, biorąc pod uwagę wartość całkowitej mocy czynnej PV, która powoduje minimalne straty mocy czynnej i odchylenie napięcia. Wynik symulacji pokazuje, że integracja PV-DG może poprawić wydajność systemu dystrybucji ze względu na efekt wzrostu obciążenia. (Rozproszona integracja fotowoltaiczna jako energia uzupełniająca: rozwiązań problemów związanych z utratą mocy i wzrostem zapotrzebowania na obciążenie).
Keywords: PV on grid, load growth, genetic algorithm, distributed generation, drop voltage
Słowa kluczowe: PV na siatce, wzrost obciążenia, algorytm genetyczny, generacja rozproszona, spadek napięcia.
Introduction
The estimated increase in global energy demand in 2040 reaches 37% [1]. This was triggered by an increase in electricity consumption from the residential and commercial sectors each year. This certainly has an impact on increasing the load on the distribution network and impacting the operational problems of the system. To anticipate this, the use of distributed generator in the distribution system is one alternative solution to overcome the problem of increasing the load and effects caused on the operational side of the distribution network. Distributed generation (DG) is the opposite of the traditional model of centralized generation. If in the centralized generation model a large-scale power plant provides energy for one region, the DG prioritizes many small capacity power plants that are connected or not connected to the distribution and transmission network. In general, DG refers to power plants with a capacity of 100 kW untill 50 MW [2]. Based on International Energy Agency (IEA) statistical data, the average energy loss during distribution and transmission in a centralized electricity generation system is the range between 8 and 15% [3]. This is a challenge that arises from centralized electricity generation but is also an opportunity for DG innovation as decentralized generation; which is closer to the consumer and utilizes local renewable energy.

The trends in global energy use moving towards renewable energy use, including in the electricity generation sector, also affect the transition of various sectors from fossil fuels to electricity utilization. On-grid photovoltaic (PV on-grid) is currently the latest trend in the electricity business model.
In general, Indonesia has a solar energy potential of 4.8 Kwh / m² , equivalent to 112.999 GW peak (GWP). Palu as the capital of Central Sulawesi province with an astronomical location of 0o57 ‘LS; 120o0 ‘BT 5.512 so that it is right on the Equator line with an altitude of 0-700 making this region very potential for PV placement as mapped in Fig. 1. Referring to National Aeronautics and Space Administration (NASA) data, the potential of solar radiation in the city of Palu in 2017 ranged from 4.98 – 5.86 / m² per month with the duration of sunlight 6-8 hours per day shown in Fig. 2.

Related research on the potential of solar energy in the city of Palu revealed a comparison of the efficiency levels of the three types of solar cell module technology. The output power of monocrystalline, polycrystalline, and amorphous silicon each varies between 20-23 kWh / m², 16-19 kWh / m², and 7–9 kWh / m². Thus, there is a promising potential for the supply of electrical energy from solar panels as a DG source that inject active power. However, the on-grid PV business is a challenge for providing adequate and appropriate reserve margins to offset the intermittency of PV [5] and the use of environmentally friendly technologies. PV on the grid has a role in the quality of power in the distribution system. The role is to improve the voltage value, improve the impact of load imbalance, reduce the occurrence of active and reactive power fluctuations, increase the power factor, reduce the number of power losses and improve the value of system reliability [6-9]. PV integration in the distribution feeder must meet the requirements of the connection technique, namely the selection of the location (placement) and capacity (sizing) of PV power. Determination of on-grid location and PV power capacity is proposed using optimization techniques. Previous studies have used optimization methods in determining the connection point of DG with the distribution network [10-13].
However, the addition of PV as DG which is generally placed near the load on the distribution network will greatly affect the overall system power flow. A significant influence and needs to be considered further is system loadability. Loadability provides the maximum value for loading that is still possible without disrupting the stability of the system work. The maximum loadability parameter in a distribution system that must be considered is the bus voltage limit. This voltage limit will be a limitation of the optimization that will be done in determining the size and location of DG placement to be installed on the system [14]. To optimize the function of PV as an additional plant in meeting the increasing electricity demand, planning for the selection of the placement location and determination of the DG unit’s output power must be carried out appropriately. Therefore, this optimization problem will be solved by using the NonDominated Sorting Genetic Algorithm-II (NSGA-II) method. This method can solve multiobjective optimization problems in the placement and determination of PV-DG output power so that the formation of the number, location, and PV output power in the maximum loadability state of the system can still be achieved.
Power flow after integrated PV-DG
This research aims to optimize the placement of PV-DG in the system to produce minimal power loss. The calculation to determine the total power loss in the system uses the power flow equation described in the following section.
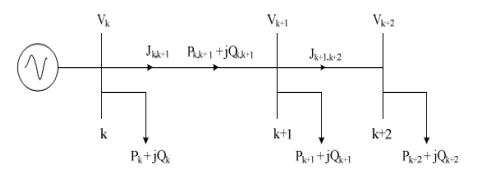
Figure 3 represents the distribution system with a current value of:
where
The current value J of equation (1) is obtained by forming the Bus current Injection to Branch Current (BIBC) matrix, that is,

By using Kirchhoff’s voltage law an equation is obtained,

Power loss on each line connecting bus k to bus k + 1 can be stated as follows:

From equation (5), the total power loss can be calculated by summing the power loss in each line so that the following equation is obtained

Non-Dominated Shorting Genetic Algorithm-II (NSGA-II)
Solution optimization problems that involve multiple objectives (multiobjective optimization) have an impact on increasing the number of optimal solutions to these multiple problems, this is widely known as Pareto-optimal solutions. Some evolutionary algorithms for solving multi-purpose problems, Multiobjective Evolutionary Algorithms (MOEAs) have been discovered [15-17].
The main reason for using solutions with this method is their ability to find many Pareto-optimal solutions once a simulation is run. Since evolutionary algorithms (EAs) work with a population that contains problem-solving, a simple EA can be developed to maintain several different sets of expected solutions. With an emphasis on moving towards the actual Pareto-optimal region, an EA can be used to find several Pareto-optimal solutions with a single simulation. NSGA is the first evolutionary algorithm to adopt it.
However, in its use, this algorithm still has many weaknesses in the computational process, the absence of elitism that prevents the loss of a good solution when the solution has been found requires a specific definition of the value of sharing parameters (σshare). Therefore it is necessary to change the original code from NSGA. These changes are referred to as the second version of the NSGA or abbreviated as NSGA-II.
From various simulation results on several multiobjective problems that are difficult to solve, NSGA-II shows very satisfying results [18] in terms of the discovery operation of a group of problem-solving with high variation, as well as the proximity of the convergence with the group of Pareto-optimal solutions.
However, the most important advantage in the selection of NSGA-II is its ability to overcome the three weaknesses of NSGA above, because NSGA-II has a better sorting algorithm, the incorporation of the concept of elitism in the main algorithm, and no need to share parameters that must be determined first. Some stages in the NSGA-II in the outline are; population initialization, non-domination sort, crowding distance, crowded-comparison-operator, selection, genetic operator 1 (crossover), genetic operator 2 (mutation), and recombination [18]. The implementation of the NSGA-II in determining the optimal size and location of the PV is shown in the flow chart of Fig. 4. Fitness calculation for each individual is based on the objective function (7) to be achieved in the placement and determination of the optimal capacity of this PV. The objective function consists of two functions to minimize system power loss and voltage deviation.

As explained in the background of the problem, the placement of DGs is done to improve the system load supply capability, so that it can accommodate the additional load that will occur. Addition to load affects the stability of the system voltage.

Subjects to (7-10) :

Each individual will produce different fitness values. Individuals with each fitness value will be combined in one array and sorted according to the rules of non-domination sorting and crowding distance so that individuals are ranked the best to the worst for the selection process. Some parameters used to generate the initial population are tabulated in Table 1. Each PV unit is represented by S binary strings of 8 gene bits in one chromosome. The first four bits represent the PV unit capacity, while the remaining 4 bits represent the PV output power. Following the PV output power rating, the output power that can be produced is between 1-5 MW. Whereas the DG placement location is encoded by a binary L string of 4 bits. The formation of chromosomes is done by combining the S and L strings into one array of individual genes consisting of 12 bits in which the value of each chromosome element (gene) is generated randomly using MATLAB 2016a software.
Table 1. The parameters of NSGA-II

Result and discussion
Scenario 1 : existing (base condition )
Initially, the Tipo system was analyzed for load flow that occurred in each of these systems without the addition of DG. Power flow analysis is performed using the Newton Rapson method, with accuracy reaching 0.00001, acceleration 1.6, and maximum iteration of 100 times the process.

System parameters to be considered in the simulation are the total network losses and the voltage value of each bus in the system.
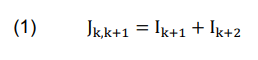
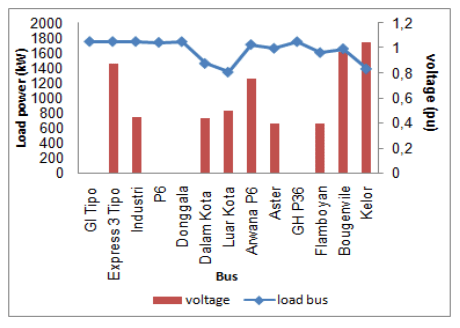
Power flow information on the Tipo system was analyzed with a Matlab based program. The results of the power flow study are shown in Fig. 6 and Fig. 7. The total system load of 19,980 MW + j 9,678 MVAr is served by the system of 21,221 MW + j 10.985 MVAr. Figure 7 shows the value of power flow and power loss in the line. The total power loss that occurred was 1.271 MW + 1.135 MVAr. The biggest power losses are in the Luar Kota line, Kelor line, and Dalam Kota line respectively 0.616 MW + j0.541 MVAr; 0,107 MW + j0,252 MVAr; and 0.294 MW + j0.251 MVAr. Figure 7 shows the minimum voltage conditions on buses connected to Tipo’s Electrical Substation of 0.806 pu experienced by Luar kota bus. The value of the voltage drop that occurs is 16.8%.
Scenario 2: placement of PV-DG
Power flow studies conducted on Tipo system were discussed in the previous section. The results of the study show that three buses have very poor under voltage conditions. Radial topology condition does not allow DG placement of less than three units.
Optimization of on grid PV placement by one unit and two units has been carried out. Determine a portion of the amount on the bus. Placement of PV-DG by one unit up 1.2 MW on the Luar Kota bus can reduce active power loss by 5.4% and reactive power loss by 12.73%. Voltage profile of Dalam Kota and Luar Kota buses increased respectively 12.15% and 18.26%. However, the voltage condition on the Kelor bus in conditions under-voltage reaches 0.862 pu.
The same thing happened when the placement of two PV-DG units on Luar Kota bus and Kelor bus of 2 MW and 3.1 MW, respectively, resulted in a reduction in active and reactive power losses of 28.32% and 11.61%. The voltage on the Luar Kota bus and Kelor bus corrected respectively 18.26% and 15.79% but the voltage on the Dalam kota bus is still in an under voltage condition at 0.914 pu. The results of optimization using NSGA-II are shown in Table 2.
Table 2. The results of the optimization of the PV-DG placement on the 13 Tipo’s Electrical Substation bus system
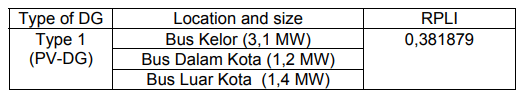
Table 3. Recapitulation of PV-DG placement effect on 13 Tipo’s Electrical Substation bus systems

The integration of 5.7 MW from DG-1 can reduce active and reactive power losses by 61.81% and 48.11% respectively so that the system power loss in the Tipo GI became 0.569 MW + j0.877 MVAr as tabulated in Table 3. The reduction in power losses that occur can be explained as a result of injection of the current generated from the PVDG so that it can reduce the current from the main generator which is centralized.
Scenario 3
The type load model on the 20 kV distribution network Palu is mixed. The industrial load is represented by industrial bus and express bus 6 represents commercial loads. The other buses are buses with resident loads. This scenario begins by testing the DG placement solution for each type until the third growth year.
The load growth rate refers to the national rate of 8.6%/year. In this test, the assumption does not change the distribution network in terms of conductor size or network configuration.

The test results show that the growth of the load in the first year resulted in 25.794 MW + j12.957 MVAr and followed by an increase in a power loss of 16.65% or to 1.525 MW + j1.689 MVAr. The same thing happened to the load growth in the following year which resulted in an increase in load to 26.456 MW + j12.757 MVAr and 28.207MW + j13.278 MVAr, respectively.

The load growth also affect the voltage profile of each bus in the Tipo GI system. In the first year, the biggest voltage drop occurred on the Kelor bus as the farthest bus from the slack bus valued at 16.3%. Such is the case in the second and third years of 15.8% and 17.7%, respectively. The following test is find out the effect of the system up to the third growth year if the PV-DG integrated system is on three predetermined buses. A comparison of power losses and voltage profiles between system conditions without PV and PV integrated systems is shown in Fig. 8 and Fig. 9.
Fig. 8 shows that the integration of PV-DG can minimize power losses that occur until the third year. The first year of the DG-1 integration of 5.7 MW was able to reduce power losses by 6.94% to 1,426 MW + 1,692 MVAr. Likewise in the second and third years, there was a decrease in power losses to 0.807MW + j1.21MVAr and 0.962MW + j1.415MVAr respectively. PV on-grid can increase the minimum voltage value when system conditions are without DG. However, this improvement was unable to maintain the voltage level within the tolerance range of 0.95 pu to 1.05 pu as shown in Fig. 9.
The voltage profile of Dalam Kota bus in the first, second and third years show values of 0.948 pu, 0.936 pu and 0.918 pu. Flamboyan bus also experienced a voltage drop in the third year exceeding the limits of 0.94 pu.
Based on the above analysis, the DG placement scenario on the Tipo system is carried out by taking into account the ‘g’ growth factor. In the optimization process, there are changes in the parameters used in the optimization process, that’s :
• Total PV-DG = four units
• Limit of obstacle : 0,1 ≤ PDG ≤ 8,5 MW
The change in the amount of SG is based on a test scenario conducted previously using three units whose results are not converging. The results obtained violate the voltage limit. For that scenario, the number of DGs is increased to four units according to the previous optimization recommendations. The results of these scenarios are shown in Table 4.
Table 4. The results of optimization of DG-1 placement on the Tipo system consider the faktor g ’factor

DG’s optimal solutions shown in Table 4 have the effect of reducing power loss in the first, second and third year. The test results show that in the first year load growth with a total load of 25.794 MW + j12,957 MVAr, DG 8.2 MW integration can reduce power losses significantly by 43.14%.

In the second year, the system load of Tipo system became 26,456 MW + j12,757 MVAr followed by an increase in power loss to 1,758MW + j 1,942MVAr. PV-DG integration can reduce real power losses by 49.94%. In the third year, the Tipo system bears a total load of 28.207MW + j13.278 MVAr. The integration of DG 8.2 MW can reduce power loss by 53.4% of system power loss without DG by 2.077MW + j2.28MVAr. The impact of PV-DG integration on reducing power losses with a three-year scenario of load growth is presented in Fig. 10. In addition to reducing power losses, DG integration is also able to improve the voltage profile that experiences voltage drops on certain bus due to load increases.
In the first year, the biggest voltage drop occurred on the Kelor bus as the farthest bus from the slack bus valued at 14.1%. Likewise in the second and third years respectively 15.8% and 17.7%. PV-DG integration can reduce the value of voltage drop in the first, second, and third years by 1.4% each; 2.6%; and 3.9%.
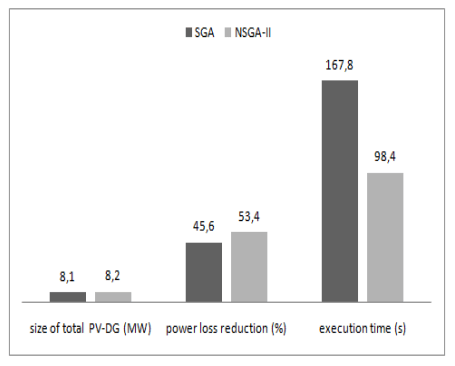
To test the performance of NSGA-II, simulations with the same procedures and objects have been carried out using Simple genetic Algorithm (SGA). The results show improved convergence generation and computational time trimming with more significant results. This is shown in Fig. 11.
The results of this study are also supported in previous studies [19] that have tested the placement of PVDG in the IEEE 30 bus test system. There are different methods and objective functions in this study which only focuses on reducing the active power loss of the line. The method proposed in this study is the Breeder Genetic Algorithm (BGA). Similar research has also been carried out [20] with the same method but with a different type of DG.
Conclusion
This research has succeeded in getting the optimal size and location of PV-DG as a solution to improve the performance of the distribution network on the Tipo system. The existence of a load growth factor can result in voltage drops on bus far from the power plant. By using NSGA-II, PV-DG of 8.2 MW spread over three buses can reduce power loss and improve the voltage profile. The PV-DG placement guarantees the voltage profile within tolerance limits even if there is an additional load until the third year.
The NSGA-II method shows better performance than the SGA method on the parameters of total output power, power loss reduction, and simulation processing time. The NSGA-II method shows that it requires faster convergence time processing than the SGA method with a greater reduction in system power loss.
REFERENCES
[1] Word Energy Outlook, 2014.
[2] Papermans, G., Driesen, j., Haeseldonckx, D., Belmans, R., & D, W., Distributed generation : definition, benefits and issue, Energy Policy, 33 (2005), 787-798.
[3] International Electrotechnical Commission, Efficient electrical energy transmission and distribution, Geneva, Switzerland: International Electrotechnical Commission, 2013.
[4] Fitriaty, P, & Zshen, Predicting energy generation from residential building attached Photovoltaic Cells in a tropical area using 3D modeling analysis, Journal of cleaner production, 195 (2017), 1422-1436.
[5] P.G.M Cormick, H.Suehrckeac, The effect of intermittent solar radiation on the performance of PV systems, Solar Energy, 171(2018), 667-674.
[6] M. C. V. Suresh, Edward J. Belwin, Optimal DG placement for benefit maximization in distribution networks by using Dragonfly algorithm, Renewables: Wind, Water, and Solar, 5 (2018), 1-8.
[7] Nirmalaj., V.Janamala and J. Rodrigues, Impact of Variable Distributed Generation on Distribution System Voltage Stability, International Conference on Data Science and Communication (IconDSC), 1-2 March 2019.
[8] J. A. Sa’ed, Q. Samara, S. Favuzza, G. Zizzo , Impact of integrating photovoltaic based DG on distribution network harmonics , IEEE International Conference on Environment and Electrical Engineering and 2017 IEEE Industrial and Commercial Power Systems Europe (EEEIC / I&CPS Europe), June (2017).
[9] Lasantha M., Tim L., Handbook of Distributed Generation, Distributed Solar-PV Generation: Impact on Voltage Control and Stability, (2017) ,317-342.
[10] Y. A. Rahman, S. Manjang, Yusran, and A. A. Ilham, Selection of Sensitive Buses using the Firefly Algorithm for Optimal Multiple Types of Distributed Generations Allocation, International Journal of Advanced Computer Science and Applications, 10 (2018), 316-322.
[11] Edmarcio A., Lina P., William M, Igor F., and Priscila R., Distributed Generation Allocation Using the Genetic Algorithm of Chu-Beasley and Sensitivity, Przegląd Elektrotechniczny, 8(2016).
[12] S.Daud, A.F.A.Kadir, C.K.Gan, A.Mohamed, Tamer Khatib, A comparison of heuristic optimization techniques for optimal placement and sizing of photovoltaic based distributed generation in a distribution system, Solar Energy, 140 (2016), 219-226.
[13] Rahman, Y.A., Manjang, S., Yusran, Ilham, A.A., An empirical metaheuristic assessment for solving of multi-type distributed generation allocation problem, Proceeding of IEEE International Seminar on Research of Information Technology and Intelligent Systems, ISRITI (2018).
[14] Arulraj, N. and Kumarappan.R., Optimal multiple installation of DG and capacitor for energy loss reduction and loadability enhancement in the radial distribution network using the hybrid WIPSO–GSA algorithm, International Journal of Ambient Energy, 41(2020), 129-141.
[15]Yiping, L., Gary G. Yen, Dunwei, G., A Multimodal Multiobjective Evolutionary Algorithm Using Two-Archive and Recombination Strategies, IEEE Transactions on Evolutionary Computation, 23 (2019 ).
[16] Partha P.Biswasa, P.N.Suganthana, Gehan A.J., Amaratunga, Decomposition based multi-objective evolutionary algorithm for windfarm layout optimization, Renewable Energy , 115 (2018), 326-337.
[17] B.Y.Quab J.J.Liangac, Y.S.Zhua, Z.Y.Wang, P.N.Suganthan, Economic emission dispatch problems with stochastic wind power using summation based multi-objective evolutionary algorithm, Information Sciences, 351(2016), 48-66.
[18] S. Kannan, S. Baskar, James D. McCalley, P. Murugan, Application of NSGA-II Algorithm to Generation Expansion Planning, IEEE Transactions on Power Systems, 24(2009 ).
[19] R. Y. Asmi, M. Salama, and I. A. Ahmad, Distributed generation’s integration planning involving growth load models by means of genetic algorithm, Archives of Electrical Engineering, 67(2018), No. 3, 667-682.
[20] Yusran, Yuli, A.R.,Indar C, Sri Mawar, S., Syafaruddin, Mesh grid power quality enhancement with synchronous distributed generation: optimal allocation planning using breeder genetic algorithm, Przegląd Elektrotechniczny, 1(2020), 82-86.
Authors: prof. dr. Ir. Salama Manjang, MT, Department of Electrical Engineering, University of Hasanuddin,Jalan Poros Malino km 6 Bontomarannu Gowa, Indonesia, E-mail: salamamanjang@unhas.ac.id; dr.Yuli Asmi Rahman,ST, M.Eng, Department of Electrical Engineering, University of Tadulako, Soekarno Hatta Km. 10, Tondo, Palu, Indonesia, E-mail: yuliasmi.rahman.81@gmail.com.
Source & Publisher Item Identifier: PRZEGLĄD ELEKTROTECHNICZNY, ISSN 0033-2097, R. 96 NR 9/2020. doi:10.15199/48.2020.09.12
