Published by Sean Elphick, Member, IEEE, Phil Ciufo, Senior Member, IEEE, Gerrard Drury, Vic Smith, Sarath Perera, Senior Member, IEEE, Vic Gosbell, Senior Member, IEEE, University of Wollongong.
Abstract – In Australia and many other countries, distribution Network Service Providers (DNSPs) have an obligation to their customers to provide electrical power that is reliable and of high quality. Failure to do so may have significant implications ranging from financial penalties theoretically through to the loss of a license to distribute electricity. In order to ensure the reliability and quality of supply are met, DNSPs engage in monitoring and reporting practice. This paper provides an overview of a large long-running power quality monitoring project that has involved most of Australia’s DNSPs at one time or another. The paper described the challenges associated with conducting the project as well as some of the important outcomes and lessons learned. A number of novel reporting techniques that have been developed as part of the monitoring project are also presented. A discussion about large-volume data management, and issues related to reporting requirements in future distribution networks is included.
Index Terms—Power Quality Monitoring, Power Quality Survey, Power Quality
I. INTRODUCTION
Pro-active power quality (PQ) monitoring is now considered a normal part of network operation by many distribution network service providers (DNSPs). A survey conducted by CIGRE/CIRED joint working group C4.112 of DNSPs internationally which is summarised in [1], indicates that 82% of DNSPs have permanent monitoring systems installed. Considering these DNSPs, 60% of them have more than 20 instruments. The necessity to demonstrate compliance with local or international regulations at individual sites is stated to be the motivation for installation of PQ monitoring systems for 66% of survey respondents. Benchmarking reports produced by the Council of European Energy Regulators (CEER) on the quality of electrical supply [2], also suggest that the majority of European DNSPs have PQ monitoring systems. The reports indicate that there is significant variation in the monitor deployment strategies adopted and the total number of instruments deployed as well as the regulatory frameworks across different countries.
A high quality power supply is key to a modern economy and over time, both electricity distributors and customers have come to realise the importance of PQ. In addition, regulators now have a strong interest in ensuring that distributors meet PQ obligations. While collection of PQ data is now considered a normal part of doing business for most DNSPs, and significant volumes of data are now collected and stored, there remain significant challenges related to PQ monitoring. These challenges include identifying effective PQ monitoring strategies including optimal instrument numbers and deployment locations, effective data analysis and reporting, regulation of PQ parameters and understanding of the economic impact of PQ on customers and networks.
This paper presents on overview of a very large and long running pro-active PQ monitoring project that has been taking place in Australia since 2002. The very large data repository collected during the project has allowed significant research into PQ monitoring, analysis, reporting and network behaviour (e.g. prevailing PQ levels, network performance capability with respect to voltage sag performance). A number of these research outcomes are also detailed in the paper. The paper begins by presenting a short overview of the project. This is followed by a description of the solutions to the challenges encountered with managing the very large volumes of data associated with the project. A selection of the novel analysis and reporting techniques which have been developed for the project are then presented. Finally, areas of PQ monitoring, analysis and reporting related to future electricity networks which are yet to be fully understood are described and some suggestions are made as to how these challenges may be overcome.
II. STRUCTURE OF THE PROJECT
A large scale pro-active DNSP PQ monitoring, analysis and reporting project was initiated at the University of Wollongong in 2002. The project involves participant DNSPs supplying PQ data to University researchers who then perform data analysis and reporting. Previously known as the long term national power quality survey (LTNPQS) and described in [3], the project has evolved to become the Power Quality Compliance Audit (PQCA). While large scale projects with some similarities to the PQCA have been carried out in other countries, such as those described in [4], [5] and [6] there are relatively few projects of this type in the public domain. There are many significant differences between the way in which the PQCA project is managed when compared to other large scale PQ monitoring projects including:
• The longevity and geographical extent of the project.
• The volume of monitored sites (and consequently data) included in the project
• Participants in the PQCA select the sites to be monitored and the PQ instrumentation to be used. This leads to many different types of instrument being used, each with potentially different data formats and sites with many different characteristics. This has required the creation of a novel, flexible, data management system.
• That the project examines a suite of the most common voltage parameters as opposed to only one or two PQ parameters as was the case in a number of other large studies (e.g. [4] and [5]).
• The large volume of research and development which has resulted from the project, particularly in the areas of PQ monitoring methodology, data analysis and reporting techniques.
Since inception, the project has grown to include data from over 12,000 sites provided by 12 of the 16 Australian DNSPs. These sites include a mix of low voltage (230 V) and medium/high voltage (6.6 kV – 132 kV) sites. DNSPs that currently participate or have participated in the PQCA project supply electricity to at least 90% of the population of Australia. Based on these characteristics, the project is highly significant on a global scale in terms of geographical extent, terms of site numbers and longevity. Approximately 5,000 sites were included in the project for the 2013 – 2014 Australian financial year (1st July 2013 – 30th June 2014); the highest number in the history of the project. The PQ parameters included in the project are: steady state voltage magnitude, voltage unbalance, voltage harmonics (voltage THD and individual voltage harmonics to the 25th order), flicker and voltage sags.
III. DATA MANAGEMENT CHALLENGES
During the initial stages of the project, a common PQ data format was developed and participants were requested to supply data in this format. However, requesting participants to transform their source data to the common data format resulted in data quality problems. To overcome this, the common data format was abandoned and participants now supply data in a format that is most convenient for them.
Consequently data is supplied in many different formats. This has necessitated the design and implementation of a sophisticated data transformation system which is capable of handling the instrumentation and data formats supplied by each participant. This is advantageous for DNSP participants as the complexity of data transformation is handled at a single point and participants do not need to maintain the skill set required for this task in-house. While there are a variety of supplied data formats, in many cases the data format from any given participant is generally consistent. Consequently, once the data transformation for their data is implemented it can be applied with relative ease each reporting period. However, the data supplied by a given participant can still vary, for example due to the inclusion of data from meter types new to the project or development of the participant’s PQ system.
Data is also supplied by a variety of physical and electronic means and at varied intervals. Ideally, participant data would be supplied in a consistent format and at a regular time interval by an automated data transfer. The reality is that data is supplied via a variety of methods and in a number of time intervals ranging from annual data transfer on physical media using the regular postal system, through to participants who have achieved, to a reasonable extent, automated regular electronic transfers of consistently formatted data.
At present, the project database contains approximately 500 GB of data consisting of over 900 million data records. During 2015, there is an expectation that the number of data records will exceed one billion. Data that is required to be maintained in the database includes site and instrument characteristics (Section IV.B.2c contains information related to the site characteristics included in the PQCA project) in addition to the logged PQ data. Each site also has a particular set of characteristics in terms of the instrumentation used, scaling factors for transducers as well as other physical details and classifications (such as urban, rural). All of these characteristics must be incorporated into the database. Since these characteristics can change over time, for example an instrument may fail and be replaced, the database needs to be flexible enough to adapt to these changes.
With expected continued growth in the number of sites and hence volume of data, continuing effort is required to further improve efficiencies of data management and implementation of algorithms used in analysis of the data.
IV. NOVEL ANALYSIS AND REPORTING TECHNIQUES
The analysis and reporting of large volumes of PQ data has been a key area of research for the PQCA. With the volume of data collected, one major challenge for reporting is to reduce data to a form that can be easily read and understood without the loss of important detail. A secondary challenge is to provide a report to participants that can be used effectively at all levels of the business. In many cases, this creates conflicting demands on reporting; management level of businesses are only interested in high level overviews of performance while dedicated PQ engineers are interested in detailed performance results.
At the commencement of the project in 2002, reporting techniques for a number of PQ parameters were still under development and reporting methodologies for large numbers of sites and large volumes of data were not highly developed. Furthermore, reporting methods capable of aggregating indices from a large number of sites to provide high level indicators of performance useful at management level and for benchmarking were in their infancy. Consequently, many of the reporting techniques used in early project reports were developed from the ground up. The longevity of the survey has provided scope for strong development and verification of these reporting techniques over time. Reporting techniques have needed to evolve due to many factors including changes in industry focus and new developments in PQ standards. The project continues to be a ‘living’ activity and changes in analysis and reporting methods are incorporated as research outcomes develop.
A. Indices
In the case of the projects described in this paper, the primary purpose of proactive PQ monitoring is not to identify individual poor performing sites. Rather, it is targeted at identifying whole-of-network performance and trends in order to identify if planning processes are effective. However, the reporting process should still be able to identify sites with poor performance.
For the PQCA project, two types of indices have been developed. These are referred to as ‘primary’ and ‘secondary’ indices. Primary indices are used for compliance assessment and are generally directly related to assessment methods (e.g. statistical treatment) and limits given in standards or regulations. Exceptions to this rule apply for PQ parameters where standardised assessment methods or limits may not be available, for example, voltage sags. Primary indices are only calculated for a limited set of PQ parameters. For example, the primary index for voltage harmonics is the THD, while values for individual voltage harmonic orders are considered to be secondary indices. Secondary indices are designed to give further insight into performance. For example, providing an indication if a particular voltage harmonic order is exceeding a limit. The benefit of using a combination of primary and secondary indices is that the limited set of primary indices allows high level performance and compliance to be assessed, while the secondary indices can be used to further investigate the performance of sites that are of particular interest. It is beyond the scope of this paper to describe the primary and secondary indices used in the PQCA project, however, these are described in [7] and [8].
One area where there has been significant innovation in the PQCA is the reporting of voltage sags. The concept of sag reporting has been the subject of many committees and working groups. However, although a number of methods of reporting voltage sags have been included in a number of standards, no international consensus regarding the best method of reporting sags has been reached. The primary index which has been developed for the PQCA for voltage sags is Sag SAIFI [9]. The Sag SAIFI Index is innovative due to the fact that it attempts to establish a comparison of voltage sag performance with the well-known reliability measure SAIFI. In addition, the index is designed to directly relate sag activity to equipment impact; something that is not immediately obvious in other sag reporting techniques. Sag severity levels are calculated by log/linear interpolation between the ITI Curve [10] (zero severity) and a point on the voltage sag plane that is known to cause disruption to most items of equipment. If severe enough, each sag at a site will generate a sag severity number. If a sag is considered severe enough that it would be expected to trip all equipment at a site (i.e. it is equivalent to a short interruption), the calculated sag severity index will be 1. An overall value for the survey period is determined by summation of all of the calculated sag severity values over the survey period.
Another aspect of voltage sag performance that requires consideration is that networks cannot hope to achieve the sag performance defined by the CBEMA/ITI curves. Consequently, superimposing sag data on these curves does not give a strong indication of whether network performance is acceptable. The protection curve described in [11] has been developed for the PQCA in order to provide an assessment of network performance based on acceptable protection (sag clearance) performance for typical distribution network protection settings.
B. Reporting Techniques
To be useful at all business levels of participants, PQCA reports begin with highly summarised data first, followed by more detailed data, structured in the following main tiers:
• Executive Summary
• Utility Reporting
• Network Reporting
• Site Reporting
1) Executive Summary
The Executive Summary provides a high level overview of the participant’s compliance performance and long-term trending. The Executive Summary of the produced report consists of three key performance indicators:
a) Summary of Network Compliance
The summary of network compliance section gives an immediate visual assessment of network compliance for each PQ parameter type. In Australia and many other countries, the assessment of whole-of-network-compliance has not been widely implemented and has generally not been required by regulators. However, many Australian DNSPs are now interested in methods of demonstrating whole-of-network compliance. The assessment of compliance at any individual site is relatively straightforward. The process compares statistical parameters of measured values against limits, and techniques required are generally outlined in standards or regulations. However, the question of how a DNSP can demonstrate whole-of-network-compliance is not as straightforward. Most stakeholders agree that it is not feasible to assess compliance based on 100% of sites as there will always be a number of sites which are non-compliant. This then leads to the question of which is the most appropriate statistical indicator to use; should whole-of-network compliance be based on 99% of sites? Should it be 95% of sites? IEC documents such as [12] favour an approach which involves 95% compliance in time and space. Put more simply, this means that 95% of sites should comply 95% of the time.
A further complication in determining whole-of-network compliance is related to the size of the sample of sites provided. In order for compliance to be assessed accurately, the sample size must be large enough to be representative of the entire population of sites. In addition, the sample of sites must be representative of the characteristics entire population. This is especially important at LV where the characteristics of the site (e.g. distance from supply transformer, predominant load types) can have a significant impact on PQ performance of a site. The solution to this problem at high voltage (HV) or even medium voltage (MV), where the number of sites is relatively small compared to the numbers of LV sites, might be simply to install an instrument at each site. However, this methodology is not possible at low voltage (LV) where the number of sites would be prohibitively large. The question then becomes what proportion of sites at LV is it appropriate to monitor in order to verify whole-of-network-compliance. Other considerations include: is this number of sites feasible? and what will the monitoring protocol be?
For the purposes of the PQCA, whole-of-network compliance is based on the performance of 95% of sites. This assessment methodology has been accepted by all of the DNSPs involved with the project. Statistical methods have also been applied to calculate an estimated value for the entire network based on the sample of sites submitted to the survey. The statistical method used to estimate the entire network population is a single sided confidence interval. This interval relies on a normal distribution of site values. The techniques are fully described in [13]. Whether or not samples of levels for all PQ parameters have a normal distribution is an area of ongoing research.
This reporting methodology leads to three possible states of network compliance: both measured and estimated values are compliant, measured values are compliant but estimated values are non-compliant and measured and estimated values are non-compliant. A graphical format of presenting compliance has been developed and an example is shown in Fig. 1. The graphic contains simple pictorial representations for each PQ parameter. It is also colour coded according to the state of compliance. PQ parameters for which both measured and estimated values are compliant are shaded green, PQ parameters where the measured value is compliant but the estimated value is non-compliant are shaded yellow, and PQ parameters where the measured and estimated values are noncompliant are shaded red.

b) Percent of Sites Exceeding Limits
Simple bar graphs are produced which illustrate the percentage of sites which exceed limits for each PQ parameter. Fig. 2 shows an example of the Percent of Sites Exceeding Limits graph. The y-axis of the graph shows the percent of the total submitted sites which exceed the limit for each PQ parameter shown on the x-axis.

c) Long Term PQ Parameter Trends
Trending provides a very important indication of the performance of the network. Firstly, trends show whether or not levels are increasing or decreasing and at what rate. This indicates if there are any PQ parameters which may be of concern with respect to limits in the near future. Secondly, trends will also show if PQ management strategies are effective.
The present structure of the project whereby participants select the sites submitted, complicates long term trending.
There is no guarantee that the same number of sites or sites with similar characteristics will be submitted year after year. Consequently, a simple trend of yearly PQ parameter values can be highly impacted by changes in the provided sample of sites and as such may not give an accurate indication of long term trends.
A long-term trending methodology has been developed to address the issues related to changes in the sites included in the sample. The trend indices produced are the change in PQ indices as an average annual change over the past four years. The calculation of trend indices must take into account the fact that each year’s overall PQ indices are determined from a different sample of sites. It must also be insensitive to incidents such as large storm events that may have a large impact on a particular year’s results but which are atypical. These effects are allowed for in the PQCA by the following calculation steps:
• An Annual Trend value for two consecutive years is determined using only those sites that are common to the two years. This method is statistically more accurate than using the indices for all sites when there are sites in one year’s survey that are not present in the other.
• The Reported Trend value in the report is the arithmetic average of the last four Annual Trend values calculated using the algorithm above. As such, for a site to be included in the trending it must have data for a minimum of two years but does not necessarily require data for all years. This calculation methodology aims to give a value which is more reliable for forecasting several years into the future.
The units for the trend indices are the units of the PQ parameter per year. For example a trend of 1% for unbalance indicates that unbalance levels are increasing by 1% per year; i.e. if unbalance is 2% this year and the trend holds, it will be 3% next year.
2) Utility Reporting
The Utility Reporting section of the report contains summarised site data designed to give an indication of performance across all of the sites provided by a participant; i.e. a high level overview of all site indices for each PQ parameter. Key components of the Utility Reporting section are:
• Distribution of Site Indices
• Utility Indices
• Performance by Site Classification
a) Distribution of Site Indices
The Distribution of Site Indices graphic illustrates the performance of all sites provided by participants for each PQ parameter in decile bands normalised against the relevant limit. Each decile band is displayed in a different colour. For quasi-steady-state PQ parameters (e.g. voltage unbalance, voltage THD), the limits used in the project for quasi-steadystate PQ parameters are drawn from the operating codes or regulations for the jurisdiction in which the participant is operating. For voltage sags, in the absence of any published limit for the sag index which is used (Sag SAIFI), an arbitrary limit has been defined for the PQCA project based on date measured over the course of the project. The reader can easily visualise proportions of sites with respect to the PQ parameter limits. The distribution of site indices can be used to determine if PQ problems are systemic (even distribution of coloured decile bands) or possibly due to outlying sites (an uneven distribution of coloured bands with the worst performing sites having much worse performance than most other sites). Fig. 3 shows an example of a Distribution of Site Indices graphic.
b) Utility Indices
These values provide indices that are calculated based on all sites submitted by the participant. There are two indices for each PQ parameter shown in each graph.
• Utility Median Average values
• Utility 95th Percentile values
The Utility Median Average is the median average value for all sites supplied by the participant. These values can be used as a measure of the average performance of the participant. The Utility 95th Percentile value provides an indication of the PQ parameter levels that will be experienced at the worst 5% of sites. The value is calculated as the 95th percentile level of indices for sites.
c) Performance by Site Classification
Performance by site classification is a method of investigating the impact of various network characteristics on overall PQ parameter levels in order to determine if there are particular combinations of network characteristics that have significant impacts on PQ performance. Sites are classified based on the network construction, load and strength characteristics of the provided sites. There are two distinct strength categories for sites; transformer fed or strong sites, and line fed or weak sites. The distinction between strong and weak sites is that a site is deemed strong if it is located closer to the supply than the point on the feeder where the supply fault level is halved. At MV this distance may be several kilometres while for LV this distance is approximately 30 m.
The network construction categories are as follows:
• CBD (Central Business District) – Predominantly short underground feeders. Ring systems and strong supplies.
• Urban – Predominantly short overhead feeders and distributors but including some underground feeders and distributors.
• Short Rural – Predominately longer overhead feeders and distributors.
• Long Rural – Long to very long overhead feeders and distributors to remote locations.
The load categories are as follows: –
• Predominantly Industrial
• Predominantly Commercial
• Predominantly Residential
• Mixed – A mix of load types. Mostly used for zone substations supplying a range of different load classifications.
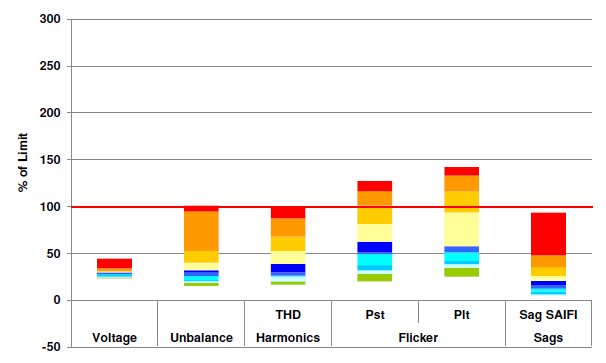
A graphic which displays performance is produced for both strong and weak sites for each nominal voltage level. The graphs are stacked bar graphs which show the relative contribution of each PQ parameter to an overall value. The first step in the algorithm for producing the overall value is to normalise the index for each PQ parameter by the limit. This results in a set of indices for all PQ parameters which are in like units. These normalised values for each PQ parameter are then summed and divided by the total number of PQ parameters to give the overall value. Fig. 4 shows an example of a performance by site classification graphic. In the graph, coloured bands show the contribution of each normalised PQ parameter index to the overall value.

3) Network Reporting
The Network Reporting section of the report provides summaries of site indices and provides some indication of the ranking of sites from worst to best. A table showing compliance for each PQ parameter is also provided. The network report is arranged by nominal voltage level with separate sections for each PQ parameter. In addition, each PQ parameter is reported separately for LV and MV sites. The following information is provided for each PQ Parameter:
• Site Compliance Table – Illustrates the number and percentage of sites exceeding limits for the primary and secondary indices. If an index is exceeding a limit, the entry in the table is shaded red.
• Primary Index Distribution – This graph shows the distribution of primary indices for the 50 worst performing sites for each participant.
• Histograms of Primary Indices – For quasi-steady-state PQ parameters (voltage magnitude, voltage unbalance, voltage harmonics and flicker) these graphs show the distribution of the primary indices obtained for each site. For voltage sags, histograms are presented for all indices (both primary and secondary).
4) Site Reporting
The site reporting tier contains the most detailed reporting. This tier shows raw data which has not been processed into indices. For quasi-steady-state PQ parameters, histograms are presented of the data collected at each site. These histograms are overlaid with lines indicating limits. For voltage sags, sag performance at each site is illustrated by plotting the recorded sags on a voltage time plane overlaid by the CBEMA curve as well as the protection curve.
V. PROJECT OUTCOMES TO DATE
The implementation of the project described in this paper irrevocably changed the PQ monitoring and reporting paradigm for DNSPs in Australia. At inception, proactive PQ monitoring and reporting practices were effectively nonexistent in Australia and quality of supply was considered a low priority for electricity distributors compared with network expansion and reliability improvement. Over time, Australian DNSPs and many large or sensitive customers have realised the importance of a high quality power supply to the economy and in many instances PQ management and monitoring is now a part of everyday business. The size, longevity and continued enhancement of the project has resulted in a very good understanding of the behaviour and capability of Australian distribution networks with respect to PQ performance and also resulted in a significant amount of novel research into PQ monitoring, analysis and reporting.
Collection of a large amount of data over a long time period has allowed the identification of the PQ parameters of most concern, from within the subset of PQ parameters included in the project, with respect to either compliance or trending in Australian distribution networks. The project has also allowed identification of the PQ capability of distribution networks with respect to PQ parameter levels that can be tolerated before either equipment maloperation or customer complaint.
The insights obtained can also be used to make informed submissions to regulatory bodies. Understanding the capabilities and hosting capacities of networks ensures that PQ parameter limits are not introduced which cannot be met by networks or for which achieving compliance would be cost prohibitive. One example of the use of the data collected by the PQCA project, was to assist in the development of the Australian Standard for voltage levels, AS 61000.3.100 [14].
The longevity of the project has allowed long term trends to be developed. The most interesting trend that has been observed is that voltage harmonic levels at both LV and MV sites are decreasing at a relatively small but consistent rate. It is postulated that this is due to a number of factors including better performance of equipment with respect to harmonic current emission and more effective harmonic current emission allocation strategies being adopted by DNSPs.
VI. AREAS REQUIRING FURTHER RESEARCH
There remain many PQ analysis and reporting problems that are yet to be solved. These include:
A. Determining Optimal Number of Sites for PQ Surveys
Installation of PQ instrumentation remains a costly undertaking for DNSPs. While there is a range of modern instrumentation that can be multi-tasked to provide PQ data (e.g. smart revenue meters, some protection relays) many of these simpler devices only monitor a subset of PQ parameters, often not to accepted PQ monitoring standards. A key ongoing area of research related to the PQCA project is inquiry into the number of sites required to achieve a meaningful representation of the PQ levels across the whole population of sites. This research is particularly important at LV where there are millions of individual sites. Obviously it is not possible to monitor all sites. Accordingly, statistical methods have been and continue to be investigated which can be used to determine the number of sites (sample size) that are required to give a good estimate of the PQ performance of the overall population. While there is very limited literature available which gives guidance as to the sample size required to prove network compliance at LV sites, the Council of European Energy Regulators (CEER) Guidelines of Good Practice on the Implementation and Use of Voltage Quality Monitoring Systems for Regulatory Purposes [15] recommends the following site numbers for various statistical indicators of overall network performance:
• 20 sites if averages over all locations will be reported
• 200 sites if 95th percentile values over all locations will be reported
• 1000 sites if 99th percentile values over all locations will be reported
While the CEER guidelines do give specific site numbers, these numbers have not been verified in practice. The study performed in [16] presented an empirical method of determining the number of sites required to accurately represent a population. However, this method requires a significant amount of data to be collected before it can be applied.
If the population has a normal distribution, there are well defined statistical methods which can be used to calculate the number of sites (i.e. sample size) which are required to estimate the mean of the population for a given confidence and allowable error. When the standard deviation of a population is known, the population mean can be described as shown in (1) and (2) [17].
and

where:
• E is the acceptable error value,
• n is the number of sites,
• Zcrit is the Z critical value for the required confidence level (1.96 for 95% confidence, 2.58 for 99% confidence) based on a normal distribution,
• σ is the population standard deviation and
• 𝑥̅ is the sample mean.
Rearranging (2), the equation to determine the number of sites required to give an estimate of the overall population mean to within an acceptable error for a given confidence level is given in (3).

The only variable which is not known in (3) is σ. However, if some data is available, σ can be approximated by the sample standard deviation if the sample size is large enough. It can clearly be seen that the number of sites is sensitive to the acceptable error value, which is user defined, and the sample standard deviation, which is related to the variability in PQ parameter levels across sites.
The central limit theorem ensures that mean values will be normally distributed and as such, the above techniques can be used to determine the optimum number of sites required to accurately predict mean PQ parameter levels. However, in many cases, 95th or even 99th percentile indices are used to describe PQ parameter levels. It is unknown if the population of these indices will be normally distributed or follow another distribution. Using the repository of data collected during the project, research is ongoing to determine the distribution of statistical indices other than the mean.
B. Accepted Methods and Limits for Voltage Sag Reporting
Voltage sag reporting remains an area of ongoing research. While there have been numerous committees and working groups devoted to this issue, none have produced a definitive method for the reporting of sags and none have produced a set of limits for sag activity.
For the purposes of the PQCA project, collected data has been used to determine an interim limit for Sag SAIFI which is the primary index used for voltage sag reporting in the PQCA reports.
C. Understanding the Impact of Flicker
Flicker compliance is another area of active research, particularly due to rapidly changing lighting technologies. The project has shown that there are significant numbers of sites which are above planning and compatibility limits for flicker. However, Australian DNSPs receive very few complaints related to what might be considered to true lamp flicker; that is actual repetitive periodic modulation of the voltage waveform envelope as opposed to rapid voltage changes, for example due to motor starts. This then raises the question of whether flicker compliance levels are appropriate and whether flicker monitoring technology is producing relevant outcomes.
D. PQ Impacts of Distributed Generation and other Loads
At present, there is an unprecedented amount of integration of highly disruptive technologies into electricity distribution networks. In Australia and many other countries, the past five years has seen a very rapid growth in the proliferation of small scale (<5 kW) solar PV generation systems. All indications are that the next five years will see a proliferation of battery energy storage systems as well as electric vehicles. All of these technologies are relatively high power devices of which the potential PQ impacts are yet to be fully understood.
Connection of distributed resources in networks is an area which requires close attention in relation to PQ. For example, the potential PQ issues associated with solar inverters include concerns related to connection and disconnection, sag ride through, voltage rise and voltage unbalance. In addition, the high frequency switching distortion associated with switching of the inverters has recently received considerable academic attention (e.g. [18]). While the latest edition of IEC 61000-4- 30 contains some insight into measurement techniques for this high (2 kHz – 150 kHz) frequency distortion, measurement, analysis, classification and limits of this PQ phenomena is still in its infancy. In addition, there are very few instruments capable of even performing measurements at the required frequencies. Added to this is the fact that there is little understanding of the practical impact of waveform distortion at these frequencies even if it is present on electricity networks.
Battery chargers associated with electric vehicles and battery energy storage systems are relatively high powered loads. These devices have the potential to be sources of high frequency distortion and unbalance, and could also impact on voltage regulation due to the fact that they are a significant load.
It is clear that integration of modern technologies into electricity distribution systems continues to raise concerns related to PQ. Consequently, research to ensure that future electricity networks continue to maintain acceptable levels of PQ is required. Such research will include investigation of appropriate analysis and reporting techniques as well as determination of appropriate PQ parameter limits. It is anticipated that the ongoing execution of the monitoring project described in this paper will assist in solving the research questions related to integration of these devices and their impact on PQ levels.
E. Integration of Smart Revenue Meter Data into PQ Surveys
A number of Australian DNSPs have rolled out very large numbers of smart revenue metering devices. Many of these devices have basic PQ monitoring functionality such as voltage magnitude and voltage sag monitoring. These large numbers of instruments have the potential to produce very large volumes of data. How best to leverage this data to produce PQ monitoring benefits remains unclear.
In many cases, there may be little value in including all voltage related data from all smart meters in proactive PQ surveys as the data from instruments located electrically close to each other (e.g. houses next door to each other) will be very similar. The challenge for PQ surveying with such large numbers of sites is how to select a sample of site that is statistically valid and also representative of all network and load characteristics.
Regardless of how the data is sampled and used, it is obvious that more and more PQ data is going to become available as time goes by. This produces ongoing challenges with respect to how to manage and report very large volumes of data. Future directions must include the implementation of web-based reporting systems which will provide a higher degree of flexibility for participants.
F. Monitoring of Transmission Network Service Providers
To date, the PQCA project has been undertaken exclusively with DNSPs. As of 2016, the project will expand to include transmission monitoring. This will introduce a new set of challenges as no large scale proactive monitoring campaign has previously been undertaken at transmission level. Challenges will include:
• How should transmission data be best reported?
• What are the most appropriate methods to use to benchmark transmission utilities?
• What are the optimal monitoring locations for transmission systems?
• How can possible measurement concerns related to high voltage transducers be overcome?
In addition to these challenges, expansion of the PQCA project to transmission operators will result in collection of a significant volume of PQ data from transmission systems. This offers many of the same advantages as the distribution project in that the collected data can be used for research into transmission system PQ in areas such as reporting, analysis, appropriate limits and trending.
VII. CONCLUSIONS
This paper presented a description of the operation, novel developments, challenges and outcomes of a long term PQ monitoring project that has operated in Australia since 2002 as a large scale pro-active PQ monitoring campaign. The success and longevity of the project has allowed strong ongoing development of innovative PQ reporting and analysis techniques in Australia.
The project has also been a catalyst for ongoing applied research into PQ monitoring, assessment and reporting in Australia. Over time, a significant amount of experience has been gained with regard to the difficulties in conducting a project such as this. Some solutions to these have been presented here, while some are ongoing. The project has facilitated an understanding of the key PQ issues for Australian distribution networks today. Areas of PQ monitoring, analysis and reporting still requiring further work have also been identified. The implementation of sites with smart meters capable of supplying monitoring data will increase rapidly in future electricity networks. This presents a new set of challenges that the project must adapt to.
VIII. REFERENCES
[1] J. V. Milanovic, J. Meyer, R. F. Ball, W. Howe, R. Preece, M. H. J. Bollen, S. Elphick, N. Cukalevski, “International Industry Practice on Power-Quality Monitoring,” IEEE Transactions on Power Delivery, vol. PP, no. 99, 2013.
[2] Council of European Energy Regulators (CEER), “5th Ceer Benchmarking Report on the Quality of Electricity Supply“, 2011.
[3] S. Elphick, V. Gosbell, V. Smith, R. Barr, “The Australian Long Term Power Quality Survey Project Update“, 14th International Conference on Harmonics and Quality of Power, ICHQP’10, Bergamo, Italy, 26 – 29 September 2010.
[4] M. B. Hughes, J. S. Chan, “Canadian National Power Quality Survey results“, Transmission and Distribution Conference, 1996. Proceedings., 1996 IEEE, 15-20 Sep 1996, 1996, pp. 45-51.
[5] Erich W. Gunther, Harshad Mehta, “A Survey of Distribution System Power Quality – Preliminary Results,” IEEE Transactions on Power Delivery, vol.10, no. 1, pp. 322 – 329, January 1995.
[6] Riccardo Chiumeo, Adalberto Prooino, Luciano Garbero, Liliana Tenti, Michele de Nigris, “The Italian Power Quality Monitoring System of the MV Network Results of the Measurements of Voltage Dips After 3 Years Campaign“, CIRED 20th International Conference on Electricity Distribution, Prague, 8 – 11 June, 2009.
[7] V. Gosbell, S. Perera, R. Barr, A. Baitch, “Primary and Secondary Indices for Power Quality (PQ) Survey Reporting“, IEEE International Conference on Harmonics and Quality of Power (ICHQP) 2004, Lake Placid, USA, September, 2004.
[8] S. Elphick., V. Gosbell, R. Barr, “Reporting and Benchmarking Indices for Power Quality Surveys“, Australasian Universities Power Engineering Conference, AUPEC’04, Brisbane, Australia, 26-29 September, 2004.
[9] R. A. Barr, V. J. Gosbell, I. McMichael, “A new SAIFI based Voltage Sag Index“, 13th International Conference on Harmonics and Quality of Power, ICHQP2008, Wollongong, Australia, 28 September – 1 October 2008.
[10] Information Technology Industry Council. “ITI (CBEMA) Curve Application Note“, Webpage, last accessed 21st December 2011, 2011, Available: http://www.itic.org/resources/iti-cbema-curve/.
[11] R.A. Barr, V.J. Gosbell, S. Perera, “The Voltage Sag Protection Curve“, 12th International Conference on Harmonics and Quality of Power, ICHQP2006, Cascais, Portugal, 1 – 5 October, 2006.
[12] IEC, Electromagnetic compatibility (EMC) – Part 3-6: Limits – Assessment of emission limits for the connection of distorting installations to MV, HV and EHV power systems, 2008.
[13] M.G. Natrella, “Experimental Statistics“: Dover Publications, 2013.
[14] Standards Australia, “Electromagnetic compatibility (EMC) Part 3.100: Limits – Steady state voltage limits in public electricity systems“, 2011.
[15] Council of European Energy Regulators (CEER) and Energy Community Rgulatory Board (ECRB), “Guidelines of Good Practice on the Implementation and Use of Voltage Quality Monitoring Systems for Regulatory Purposes“, 2012.
[16] S. Elphick, V. Gosbell, V. Smith, G. Drury, R. Barr, “Assessing Network Compliance for Power Quality Performance“, 16th International Conference on Harmonic and Quality of Power , ICHQP 2014, Bucharest, Romania, 25 – 28 May, 2014.
[17] Jay Devore, Roxy Peck, “Statistics: The Exploration and Analysis of Data – 3rd Ed“: Duxbury Press, 1997.
[18] M. Bollen, M. Olofsson, A. Larsson, S. Ronnberg, M. Lundmark, “Standards for supraharmonics (2 to 150 kHz),” Electromagnetic Compatibility Magazine, IEEE, vol. 3, no. 1, pp. 114-119, 2014.
All authors are with the Australian Power Quality and Reliability Centre, School of Electrical, Computer and Telecommunications Engineering, University of Wollongong, Wollongong, NSW, Australia. Sean Elphick, email elpho@uow.edu.au is the corresponding author.
Authors
S. Elphick (M’2009) graduated from the University of Wollongong with a B.E. (elec) degree in 2002. He obtained an M.Eng (Res) in 2012. In 2003 he joined the Integral Energy Power Quality Centre (now Australian Power Quality and Reliability Centre) at the University of Wollongong. His current role involves providing support for projects that the centre is engaged on. This work includes consulting and research. He is heavily involved in the production of the National Long Term Power Quality Survey (LTNPQS), a power quality survey involving most electricity distributors in Australia. His interests lie in power quality monitoring methodology and instrumentation and power quality standards. Email: elpho@uow.edu.au
P. Ciufo (SM’2007) graduated from the University of Wollongong with a B.E. (Hons) in Electrical Engineering. He obtained an M.E. (Hons) in Electrical Engineering in 1993 and completed his Ph.D. in 2002. He joined the University in 2008 after spending time in industry. His research interests include Modelling and Analysis of Power Distribution Systems and AC machines, Advanced Distribution System Automation, Power Quality. Email: ciufo@uow.edu.au
G. Drury graduated from the University of Wollongong with a BMath (Comp Sci) in 1991 while completing a computing science cadetship with BHP. Since then he has worked on a variety of projects ranging from low- level serial communications to mainframe based corporate systems, and using a variety of computer languages and software development environments and tools. Mr Drury has also been co-editor of several parts of ISO/IEC 21000 (MPEG-21) during the development of that standard. Mr Drury joined the Australian Power Quality and Reliability Centre in 2009 as a programmer/analyst focusing on the ongoing database and software development for the Long Term National Power Quality Survey. Email: drury@uow.edu.au
V. Smith graduated from the NSW Institute of Technology in 1979. In 1981, he studied for his MSc degree at the University of Manchester Institute of Science and Technology (UMIST), UK. In 1995, Dr Smith received his PhD from Sydney University. Dr Smith joined the Australian Power Quality Centre at the University of Wollongong in 1997. He has an interest in measurement and reporting of power quality disturbances, network transient phenomena and their control, and power quality aspects of distributed generation. Email: vic@uow.edu.au
S. Perera (SM’2012) received the B.Sc.(Eng) degree in electrical power engineering from the University of Moratuwa, Sri Lanka, an M.Eng.Sc. degree from the University of New South Wales, Australia, and the Ph.D. degree from the University of Wollongong, Australia. He is a Professor and the Technical Director of the Australian Power Quality and Reliability Centre at the University of Wollongong. Email: sarath@uow.edu.au
V. Gosbell (SLM’2012) obtained his BSc, BE and PhD degrees from the University of Sydney. He has held academic positions at the University of Sydney and the University of Wollongong where he became the foundation Professor of Power Engineering. He is now an Emeritus Professor at the University of Wollongong and Technical Advisor to the Australian Power Quality and Reliability Centre. He is currently working on harmonic management, power quality monitoring and standards. He is a member of Australian standards and CIGRE sub-committees and is a Fellow of the Institution of Engineers, Australia.
Source & Publisher Item Identifier: Elphick, Sean T.; Ciufo, Phil; Drury, Gerrard M.; Smith, Victor W.; Perera, Sarath; and Gosbell, Victor J., “Large Scale Proactive Power-Quality Monitoring: An Example from Australia” (2017). Faculty of Engineering and Information Sciences – Papers: Part B. 96. https://ro.uow.edu.au/eispapers1/96
