Published by Marcin KOPYT, Warsaw University of Technology, Electrical Power Engineering Institute
Abstract. Electricity demand predictions are one of the most important tools used for Power System work planning. However, a departure from traditional solutions seems to be inevitable in the light of ever-increasing RES share. This paper is the second of a two-part extensive review of recent literature related to forecasts of RES generation, electricity demand and power flows, and presents the second and third of the mentioned aspects.
Streszczenie. Prognozy zapotrzebowania na energię są jednym z najważniejszych narzędzi w Planowaniu pracy SEE. Odejście od ich klasycznych rozwiązań wydaje się być jednak nieuniknione w świetle coraz bardziej zwieszającej się liczby OZE. Niniejszy artykuł to druga z 2 części szerokiej analizy najnowszej literatury dotyczącej prognoz generacji z OZE, zapotrzebowania i przepływów mocy. Prezentuje on 2 i 3 aspekt. Prognozy przepływów mocy-przegląd status quo. Część 2: Predykcja zapotrzebowania na energię i przepływów mocy.
Keywords: forecasting, demand, RES, power flows
Słowa kluczowe: prognozowanie, zapotrzebowanie, OZE, przepływy mocy
Introduction
This paper is the second part of an extensive review concerning various aspects of power flow forecasts – Power Flow Forecasts: A Status Quo Review. Due to significant amount of material to be presented, the paper is divided into two parts. The first part pertains to predictions of generation, while the second addresses electricity demand & power flows forecasts.
The rationale for this review and broader introduction is provided in the first part of this paper. This second part structures the aspects discussed in the literature, characterizes their common features, key differences and inconveniences associated with them. Forecasts of electricity demand Recent studies addressing electricity demand predictions can be divided into seven categories:
a) System electricity demand predictions
b) Electricity demand predictions for an area
c) Multinodal demand forecasts
d) Building demand forecasts
e) Peak load forecasts
f) Long-term electricity demand with price elasticity analyses
g) Analyses of climate influence on long-term load forecasts
System electricity demand predictions
Dudek [1] proposes the Theta method for the prediction of electricity demand in the Polish Power System. A variant of exponential smoothing, it is remarkable for its simplicity and accuracy of prediction of processes of varying nature and frequencies. The author compares the method in its standard (STM) and dynamically optimized (DOTM) variants. He takes into consideration both a singular model which forecasts 24-h ahead, and 24 parallel models, each forecasting 1 h of a 24-h period. Out of all variants, ARIMA was the least accurate, while the rest of the models yielded similar results.
Authors second work [2] considers more countries as test sample. For purpose of forecasting monthly electricity demand of Polish, German, French and Spanish power systems, k nearest neighbor method was proposed. First considered model forecasts 12 months ahead, while second one is consisted of 12 submodels, each forecasting one chosen month ahead. Method simplicity could be treated as its advantage.
Among the publications from 2017-2019 concerning forecasts of system electricity demand, no papers were found proposing solutions for three different time scales, as was the case, for example, in [3]. Of course, the collected materials do not cover the entire pool of work, but it may be an indication that creating comprehensive solutions is or is becoming a niche.
Electricity demand predictions for areas
The main difference between area and system load forecasting is scale. Obviously, tests of methods applied to one set of data can yield a different magnitude of error on another set, due to, for instance, different RES penetration in the regional and whole-system scale, or different consumer concentration. Nonetheless, it is easier to perform tests on many discrete regions than on entire systems. Data acquisition can be potentially easier, too. Some studies were carried out on that subject [4-11] and the number of regions on which models were tested ranged from 1 to 7.
For regional forecasts, the most popular solution were hybrid and combined models using ANNs as a component [4-10]. Statistical models were relatively rare [11]. For regional power demand predictions, Gong et al. [4] propose Seq2Seq, used by default as a text machine translation tool. In this solution, LSTM network is used as an encoder and decoder for feature extraction. To limit dimensionality of encoder output, selective learning of outputs (Attention Mechanism) is used. Predictions are generated by RLSTM network, modified to avoid overlearning.
Rodrigues & Trindade [5] propose a different, albeit equally interesting approach. Using functional clustering, they divide similar curves of daily loads by their phase and amplitude. For each group of curves, ELM models were created, after which final forecasts were taken as an average of such ensemble of forecasts. It should be noted that the method was tested in a climatically homogenous area, which excluded the need to analyze influence of factors like temperature on forecasts. This, however, could become a limiting factor if one wanted to use this solution on a larger scale.
An interesting example of a combined model is put forward in [6]. Its parallel CNN–LSTM model combines the generalization capability of CNN and long-term dependencies mapping capability of LSTM. Final predictions were obtained with feature-fusion module.
In their study, Ghadimi, Akbarimajd, Shayeghi & Abedinia [7] also use 2 combined ANNs. In this case, however, it is Ridgelet NN and ENN. Modified transductive model is used for data filtration, while the predictions engine consists of two parts. RDNN generated forecasts and is followed by ENN taking the role of error correction module.
Li, Yang, Li & Su [8] propose an even more complex method. EEMD is used to decompose data into trend, waveform and noise. GRNN learns to predict future waveform component split further into waveform with no seasonal component and residuum. Meanwhile, trend component was forecast by SVR optimized by PSO. Final prediction is obtained by recombining the waveform and the trend.
Xiao, Shao, Yu, Ma & Jin [9] additionally test the flexibility of their model by checking its performance in predicting wind speed and electricity price in the short term. Their approach is based on data decomposition by SSA and forecasting by WNN, optimized with rather advanced CS(BFGS-CS) method. The accuracy of prediction in this case is several dozens of percentage points better than for traditional BPNN.
Another example of GRNN use is put forward in [10]. For short-term forecasts, the authors use such network, for which the spread parameter is optimized by Fruit Fly Algorithm with Decreasing Step (SFOA). However, the change brought by adding Decreasing Step has not brought meaningfully better results than a model without it.
Unlike prior contributions, paper [11] suggests the use of a two-stage SARIMAX method. The goal of the first stage is to deal with SARIMAX problems, i.e., long execution time and discarding the outliers, and was done by reg-plussarma procedure. Suspicious regression errors are detected and transformed into their estimates. For determining the order of polynomials, the estimated regression errors are treated as a dependent variable. In the second step, the SARMA model is treated as benchmark, while the best SARMAX model is found by brute-search of increasing or decreasing the order of each SARMA polynomial and treating it as SARMAX model. Authors claimed that their procedure improves the goodness of fit for SARMAX.
In the work of Sowiński [12] end-use model is used. First, electricity consumption rate per capita for Poland and its voivodship is obtained by employing four stochastic differential equations models. Then, total demand of regions and country is being calculated by multiplying received per capita rates by predicted population size for given year and region. This approach allows to make distinction between industrialization level of different regions.
Multinodal demand forecasts
Studies on the subject such as [13,14] described rare cases of research studies on multinodal forecasts of load. In [13], for predicting the load of 9 substations, fuzzy-ARTMAP neural network with global load participation factor is used. The approach consists in a global load forecasting model and smaller local models, one per substation. Local models were parallel to each other, and their input was fed by the output from the global model and by the participation factor for the time of forecast, as well as for two previous hours. Such solution can coordinate forecasts on different hierarchy levels, and as a result increase the accuracy of nodal forecasts. FANN could be used even for much greater number of nodes, due to architectural stability of that model.
Paper [14] builds and develops on [13]. Unlike in a standard learning process, in [14] the output category is mapped to the input category, called “reverse training”. The purpose of that method is to reduce the error inherent in standard training.
Building demand forecasts
Papers on building load forecasting [15-18] have started appearing in a rather shy manner in recent years. The method put forward in [15] was meant to be an assistance tool for building EMSs. Based on hourly air temperature and humidity forecasts, probabilistic forecasts of temperature bounds and calendar data ANN and peak abnormal differential load models were developed. Those were later combined into a single probabilistic model of interval load prediction.
In contrast to previous work, the goal of [16] was to forecast not for one big, but for three small buildings. Studies involved data decomposition by SWEMD, extraction of features by Pearson correlation-based method and forecasting by ENN network optimized by NSSO algorithm.
Even more objects were analyzed in [17]. For five households, optimal time resolution was checked for different spatial resolution of forecasts (appliance-level/ zone-level/household-level). The time resolution was 30/60/120 minutes, and the zone-level referred to household rooms. Analyses were followed by forecasts of household power demand and power aggregated from individual predictions made for lower spatial levels. Bottom-up approach with Kalman’s Filter is used to achieve sufficient generalization capability, while results were compared to forecasts made by LSTM network, which shows an overall worse performance. The proposed approach is an intriguing change in treating human behavior as unpredictable by default and it could be potentially integrated into microgrid assistance tools.
Different buildings were chosen by authors of [18]. Their focus were office buildings. This resulted in less unpredictable behavior of consumer to be included in study. The method was designed with DSR in mind, and for that purpose SVR model was used.
Peak load forecasts
This aspect of demand forecasting is discussed in [19- 21]. For predictions of demand on the province level, Dai, Niu & Li [19] use advanced decomposition method, CEEMDAN, followed by a forecasting engine composed of SVM optimized by MGWO. CEEMDAN was used to eliminate noise from data while GWO was modified to eliminate getting stuck at local optima.
Elamin & Fukushige [20] use quantile regression for a similar purpose. Following regression, the value of the first quantile is computed based on the preceding quantiles. Based on this, the upper bound of demand peaks can be determined and blackouts due to underforecasting can be mitigated.
An interesting hybrid is put forward by authors of paper [21]. They propose grey systems and MVO optimizer, based on multiverse stability theory. MVO yielded better results than PSO and FOA.
Long-term electricity demand with price elasticity analyses and studies of the influence of climate on long-term load forecasts
Besides the main area of focus, some papers considered additional factors like historical price elasticity [22] or climate influence on electricity demand [23]. The solution suggested in [22] would be interesting for DSR analyses while [23] proves well-known correlations between weather and electricity demand. Correlations proved to be high for temperature and low for air humidity. In both mentioned works, ANN and fuzzy logic were used.
Features of electricity demand forecasts
Common features of studies on electricity demand predictions include the following:
a) Short horizon spanning from 1 to 24 h for most of papers
b) Rare use of longer horizons, usually extending up to 9 days
c) Occasional publication of medium-term predictions
d) Advanced decompositions being one of the most important parts of models, with EMD variants being most popular
e) Common use of ANNs as a prediction tool
f) Regional electricity demand being the most popular topic
g) Unexplored yet extensively multinodal demand forecasts
h) Novelty such as the re-emergence of building demand forecasting
i) Predominant use of hybrid and combined methods
The features of different aspects mentioned above are summarized in Table 1.
Power flow forecasts
Recent literature related to the subject of this section feature two predominant categories of research:
a) Models of dependences between load flows and RES generation [24-26]
b) Net energy forecasts [27-32]
Models of dependencies between load flows and RES generation
Studies on the subject involve models developed, i.a., for better dispatch of power from conventional sources. This type of papers is based on corrections of load flows achieved in various ways. Prusty & Jena [24] correct PLF for a system with connected PVs with the use of previously developed time-space interdependencies model for objects. FFT and PCA methods were used as a base for this model, while GARCH model was used for predictions, which included time variability of standard deviation of residua. The influence of different RES was studied by Fang, Hodge, Du, Zhang & Li [25]. Based on historical time series of WT generation prediction errors, these researchers developed a sparse correlation covariance matrix to map time-space correlations between forecasts for turbines. With such matrix, a new set of equations, inequalities and constraints was defined for load flows. For the proposed solution, it was possible to control the parameter responsible for system resilience to WT demand instability. Kathiravan & Devi [26] made similar, albeit bit more extensive studies. Not only WTs, but also solar and heat&solar sources were included in their research. For each source, the authors determined a cost function which incorporated a penalty for deficits of fed power and incentives for surplus generation in case of power deficit. Both penalties and incentives were considered only after passing a specific threshold of prediction error introduced in calculations. Net energy predictions Massidda & Marrocu [27] forecast two variables. One is power exchanged with the network operator by the islandbased grid. The second variable was net load resulting from aggregate value of load and local, small PV generation. For their studies, the authors used historical values of forecasted values, sinusoidal functions reflecting seasonal changes and weather forecasts. SVR with RBF kernel was used as a final prediction tool.
Haupt et al. [28], in turn, studied the multinodal aspect of net load forecasts for distributed PVs. With the use of weather measurements, calendar and astronomical data, they developed parallel models of PV generation and electricity demand. In this approach, the output from PV generation is used as input for the second model. NWPs were used to correct the bias of the above-mentioned methods. This type of research demonstrates problems with acquiring data from different sources and is an example of creative solving of such problems. To make up for the lack of generation history for an area where PVs were located, the authors calculated the power based on weather conditions for meteo measurement stations, and later upscaled the results in proportion to total power capacity installed around the stations. For predictions of output % power regression, a tree model with the nearest neighbor correction is used.
Kaur, Nonnenmacher & Coimbra [29] based their research on net load forecasts for a University grid. With the help of SVR, two prediction variants were analyzed. Under the first one, demand and generation of University’s PVs were calculated in parallel and then added up together to calculate net demand. In the second approach, generation forecast was used as input to the net demand prediction model. The advantage of these studies is factoring in the influence of environmental factors on panel degradation. The fact that University HVAC was programmed and nondependent on users, which is not standard behavior of such systems, was, however, a sort of obstacle for transferability of the recommended solution.
An interesting combined model is put forward by Sepasi et al. [30]. For one substation, the authors generated predictions of net demand to improve energy management of BESS connected to substation. CVNN was used for forecasting, whereas the combined model is composed of two submodels, for simplicity called A and B here. Model A is responsible for parallel calculations for each hour of horizon. It was fed with historical data of similar day-types. Model B forecast the values for next hour based on current load and measurement going as far as 20 time-steps backwards. Certain hours of horizon measurements would not be available, therefore for these hours the output of model A was used. Day-type and Single hours decomposition used for model A could potentially allow for better pattern extraction, while the use of model B could better catch the time trend. With an increase in time step, however, the quality of the combined model would deteriorate due to forecast values replacing measurements.
Wang et al. [31] suggest another solution, this time based on probability. The following workflow is suggested. First, net load measurements are split into PV generation, actual load and residuum. Next, with the help of Kendall’s rank correlation, coefficient dependencies between the split models were determined. Based on the results of chi-square test, a copula function was chosen and parametrized with the mentioned coefficient. That way, the distribution of dependencies between models was determined, and final predictions were generated by convolution of forecasting error distributions.
Unlike previously mentioned papers which included only PVs in their net load studies, Li et al. [32] also include WTs. A comparison is made between two parallel additive models and one model explicitly forecasting net load. A model construction is suggested to allow for real-time re-optimization of model parameters in case of relative error increase over given time. In such model, rough optimizations are made by grid-search algorithm to save time, and re-optimization with genetic algorithm was used for fine tuning. The proposed solution is viable only with reliable, regular, and quick access to real-time measurement data, which limits its possible uses. Moreover, the longer the horizon, the more benefit is lost, reliable, regular, and quick access to real-time measurement data, which limits its possible uses. Moreover, the longer the horizon, the more benefit is lost,
Table 1 Aspects of electricity demand forecasts in literature
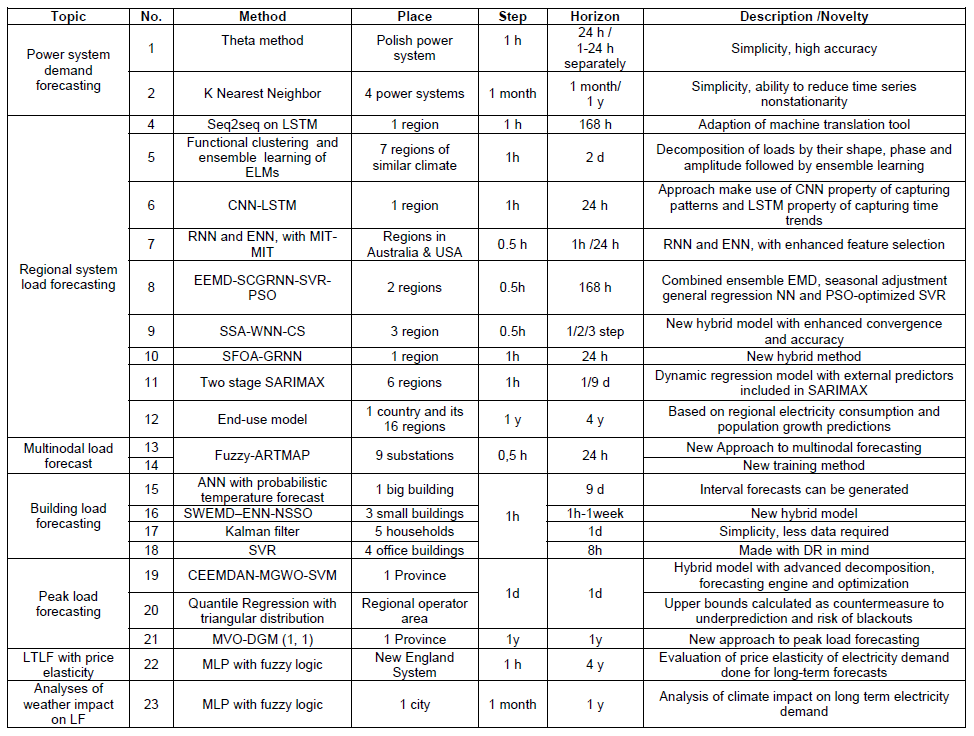
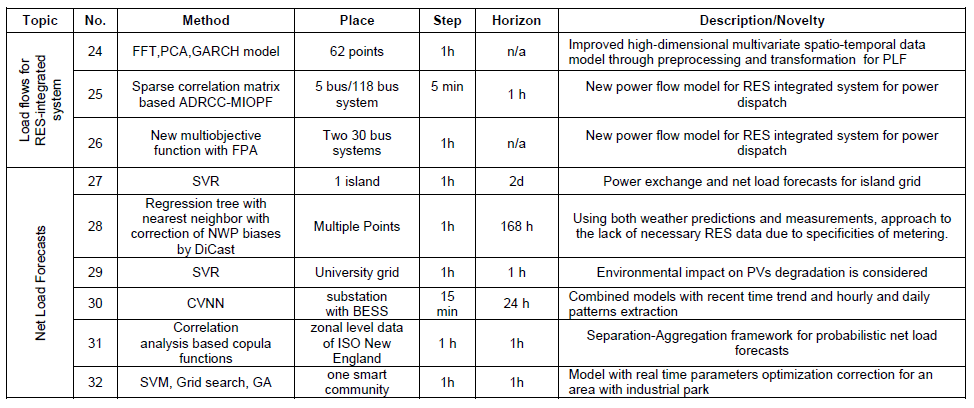
Table 2 Aspects of power flows forecasts in literature
Features of studies on power flow predictions or net demand predictions
The papers presented above have the following features:
a) Forecast interval was short and ranged from 5 min to 1h.
b) Not all studies determined the horizon, but where they did, it ranged from 1h to 7 days.
c) Net power forecasts remain not extensively explored, while a part of the research is related to dispatch scheduling from conventional sources.
d) Net load predictions concerned usually systems with connected PVs.
e) Two competitive approaches used in studies were additive models of RES generation and actual load prediction in parallel vs cascade model, where RES generation prediction was used as input to the net load forecasting model.
The features of different mentioned aspects are summarized in Table 2.
Summary
Recent studies have demonstrated that for electricity demand forecasting, various scales of research can be of interest either as a distinct area of study or as a “warm-up“ before model universality tests.
Re-emergence of forecasting of building demand deserves some attention as a change from narrative where consumer behavior is unpredictable. This could be a potential milestone in developing a bottom-up & top-down consistent demand and/or generation forecasting system.
Power flow forecasts in recent literature are rare and when they do appear, they tend to be connected with this subject rather loosely. Obviously, forecasts of such processes are more complex than forecasts of demand/generation only, but this fact plays rather minor role, hence it should not be the most limiting factor for studies.
It can be noticed that two approaches started to crystallize out of power flow studies, albeit superiority of one approach over another cannot be confirmed without new studies in the future.
It seems reasonable that effective development and use of predictions would attract attention in light of increasing RES penetration into power systems, the rise of electric cars and their charging stations.
REFERENCES:
[1] Dudek G, Short-term load forecasting using Theta method, 14th International Scientific Conference “Forecasting in Electric Power Engineering” (PE 2018)E3S Web of Conferences 84, 01004 (2019), https://doi.org/10.1051/e3sconf /20198401004
[2] Dudek G., Pełka P., Prognozowanie miesięcznego zapotrzebowania na energię elektryczną metodą k najbliższych sąsiadów, Przeglad Elektrotechniczny 1(4), (2017), 64-67
[3] Popławski T., Dudek G., Łyp J., Forecasting methods for balancing energy market in Poland, Electrical Power and Energy Systems, 65 (2015) 94–101
[4] Gong G., An X, Mahato N.K , Sun S., Chen S.,Wen Y., Research on Short-Term Load Prediction Based on Seq2seq Model, Energies, 2019, 12, 3199
[5] Rodrigues F., Trindade A., Load forecasting through functional clustering and ensemble learning, Knowl Inf Syst, 57 (2018), 229–244
[6] Tian C., Ma J., Zhang C., Zhan P., A Deep Neural Network Model for Short-Term Load Forecast Based on Long Short-Term Memory Network and Convolutional Neural Network, Energies,11 (2018), 3493
[7] Ghadimi N., Akbarimajd A., Shayeghi H., Abedinia O., Two stage forecast engine with feature selection technique and improved meta-heuristic algorithm for electricity load forecasting, Energy, 161 (2018), 130-142
[8] Li W., Yang X., Li H. ,Su L., Hybrid Forecasting Approach based on GRNN Neural Network and SVR Machine for Electricity Demand Forecasting, Energies, 2017, 10, 44;
[9] Xiao L.,Shao W.,Yu M., Ma J., Jin C., Research and application of a hybrid wavelet neural network model with the improved cuckoo search algorithm for electrical power system forecasting, Applied Energy, 198(2017),203-222
[10] Hu R., Wen S., Zeng Z., Huang T., A short-term power load forecasting model based on the generalized regression neural network with decreasing step fruit fly optimization algorithm, Neurocomputing, 221 (2017), 24–31
[11] Tarsitano A., Amerise I.L., Short-term load forecasting using a two-stage sarimax model, Energy, 133 (2017), 108-114
[12] Sowiński J., Forecasting of electricity demand in the region, E3S Web of Conferences 84, 01010 (2019), https://doi.org/10.1051/e3sconf /20198401010
[13] Abreu T., Amorim A. J., Santos-Junior C.R., Lotufo A.D.P., Minussi C.R., Multinodal load forecasting for distribution systems using afuzzy-artmap neural network, Applied Soft Computing, 71 (2018), 307–316
[14] Amorim A.J., Abreu T.A., Tonelli-Neto M.S.,Minussi C.R., A new formulation of multinodal short-term load forecasting based on adaptive resonance theory with reverse training, Electric Power Systems Research, 179 (2020), 106096
[15] Xu L., Wang S., Tang R., Probabilistic load forecasting for buildings considering weather forecasting uncertainty and uncertain peak load, Applied Energy, 237 (2019), 180–195
[16] Mohammadi M., Talebpour F., Safaee E., Ghadimi N. Abedinia O., Small-Scale Building Load Forecast based on Hybrid Forecast Engine, Neural Process Lett,48 (2018),329– 351
[17] Zheng Z., Chen H., Luo X., A Kalman filter-based bottom-up approach for household short-term load forecast, Applied Energy, 250 (2019), 882–894
[18] Chen Y.,Xu P., Chu Y., Li W., Wu Y., Ni L., Bao Y., Wang K., Short-term electrical load forecasting using the Support Vector Regression (SVR) model to calculate the demand response baseline for office buildings, Applied Energy, 195 (2017), 659–670
[19] Dai Sh., Niu D., Li Y., Daily Peak Load Forecasting Based on Complete Ensemble Empirical Mode Decomposition with Adaptive Noise and Support Vector Machine Optimized by Modified GreyWolf Optimization Algorithm, Energies, 2018, 11, 163
[20] Elamin N., Fukushige M., Quantile Regression Model for Peak Load Demand Forecasting with Approximation by Triangular Distribution to Avoid Blackouts, International Journal of Energy Economics and Policy, 2018, 8(5), 119- 124
[21] Zhao H., Han X., Guo S., DGM (1, 1) model optimized by MVO (multi-verse optimizer) for annual peak load forecasting, Neural Comput & Applic, (2018) 30:1811–1825
[22] Miranda S.T., Abaide A., Sperandio M., Santos M.M., Zanghi E., Application of artificial neural networks and fuzzy logic to long-term load forecast considering the price elasticity of electricity demand, Int Trans Electr Energ Syst., 2018;28:e2606.,
[23] Ali D., Yohanna M., Ijasini P.M., Garkida M.B., Application of fuzzy – Neuro to model weather parameter variability impacts on electrical load based on long-term forecasting, Alexandria Engineering Journal,57 (2018), 223–233
[24] Rajanarayan Prusty B., Debashisha Jena, A spatiotemporal probabilistic model‐based temperature‐augmented probabilistic load flow considering PV generations, International Transactions on Electrical Energy Systems, 29 (2019), no. 5
[25] Fang X ,Hodge B-M. ,Du E., Zhang N., Li F., Modelling wind power spatial-temporal correlation in multi-interval optimal power flow: A sparse correlation matrix approach, Applied Energy, 230 (2018), 531-539
[26] Kathiravan R., Devi R. P. K., Optimal power flow model incorporating wind, solar, and bundled solar-thermal power in the restructured Indian power system, INTERNATIONAL JOURNAL OF GREEN ENERGY,14 ( 2017) , NO. 11, 934–950
[27] Massidda L., Marrocu M., Decoupling Weather Influence from User Habits for an Optimal Electric Load Forecast System, Energies, 2017, 10, 2171
[28] Haupt S.E, Dettling S., Williams J. K., Pearson J., Jensen T., Brummet T., Kosovic B., Wiener G., McCandles T., Burghardt C., Blending distributed photovoltaic and demand load forecasts, Solar Energy, 157 (2017), 542–551
[29] Kaur A., Nonnenmacher L., Coimbra C.F.M., Net load forecasting for high renewable energy penetration grids, Energy, 114 (2016), 1073-1084
[30] Sepasi S., Reihani E., Howlader A.M., Roose L.R, Matsuura M. M., Very short term load forecasting of a distribution system with high PV penetration, Renewable Energy, 106 (2017), 142-148
[31] Wang Y., Zhang N., Chen Q., Kirschen D.S., Li P., Xia Q., Data-Driven Probabilistic Net Load Forecasting With High Penetration of Behind-the-Meter PV, IEEE TRANSACTIONS ON POWER SYSTEMS, 33(2018), NO. 3
[32] Li Y., Wen Z., Cao Y., Tan Y., Sidorov D., Panasetsky D., A combined forecasting approach with model self-adjustment for renewable generations and energy loads in smart community, Energy, 129 (2017), 216-227
Authors: mgr inż. Marcin Kopyt, Politechnika Warszawska, Instytut Elektroenergetyki, ul. Koszykowa 75, 00-662 Warszawa, E-mail: marcin.kopyt@ien.pw.edu.pl.
Source & Publisher Item Identifier: PRZEGLĄD ELEKTROTECHNICZNY, ISSN 0033-2097, R. 96 NR 11/2020. doi:10.15199/48.2020.11.02
