Published by Messaoud ZOBEIDI*1, Fatiha LAKDJA2, Yamina Ahlem GHERBI3, Fatima Zohra GHERBI1 ,
Department of electrical Engineering, laboratory of ICEPS, Djillali Liabes Universiy, Sidi-Bel-Abbes, Algeria(1), Department of electrical Engineering, laboratory of ICEPS ,Saida Universiy,Saida , Algeria (2), Department of electrical Engineering, USTO-MB Oran , Durable Development of Electric power laboratory, Algeria(3)
Abstract. The development has contributed to an increase in the consumption of electric power, which increases the generation and transport of electrical power. Consequently, electric power systems are becoming more complicated and, hence, interest is to find ways to exploit them effectively and economically. The solution to these problems through improved control of power systems already in place. The proposed elements that control and improve power system are the FACTS devices (Flexible Alternating Current Transmission System). The object of this paper is used new methods to find the optimal location of Thyristor Controlled Series Capacitor and Static Var compensator with and without wind turbine generator, the proposed method as testing in systems of IEEE 14 bus, using Power world simulator software version 18 Education.
Streszczenie. Celem artykułu jest oprawa efektywności systemu farm wiatrowych przez optymalizację lokalizacji kondensatorów (Thyristor Controled Series Capacitors) i kompensatorów mocy biernej. Analizowano system połączeń zgodny z IEEE 14 z wykorzystaniem oprogramowania Power world simulator. Optymalizacja lokalizacji FACTS w syastemie farm wiatrowych
Keywords: Power system, FACTS, Wind generator, Power transfer distribution factors, sensitivity of voltage.
Słowa kluczowe: FACTS, fary wiatrowe, kompensacja mocy biernej.
Introduction
Due to the augmentation of electrical energy and the complicated of the electrical grids. Which result in many problems as overloading or contingencies, where the system does not become secure. The main objective of the engineers is to enhance power system safety [1]. FACTS controllers such as Thyristor Controlled Series Compensator can be help to reduce the flows in heavily loaded lines, low system loss, enhanced the stability of the network, reduced cost of production, improve power system security [2], [3].
Today, Most of the electrical networks content the renewable energy (wind, solar …), however, we can find many type of electrical generators depending on the type of energy for this reason that we are studying the impact of wind generation on the optimal location of TCSC and SVC . In 2016, the global total of electricity generation capacity from wind power amounted to 486,790 MW, an augmentation of 12.5% contrasted to the previous year. Installations augmented by 54,642 MW, 63,330 MW, 51,675 MW and 36,023 MW in 2016, 2015, 2014 and 2013 respectively. [4]
These papers [5],[6],[7],[8] talk about different methods for optimal location of TCSC , the Power transfer distribution factor is suggested method for an optimal place of TCSC, the PTDF can be calculated by using DC power flow system parameters, for calculating the PTDF in faster way [9],[10],[11].
The sensitivity of voltage is method used for optimal location of SVC, it is developed by Newton Raphson [12] The main object of this paper is optimal location of TCSC and SVC, and studying the impact of wind generation on the optimal location of TCSC and SVC with and without wind generator, Results obtained through the emulation on IEEE 14 bus, using Power world simulator software version 18 Educational.
Materials and Methods Modelling of the series facts device TCSC
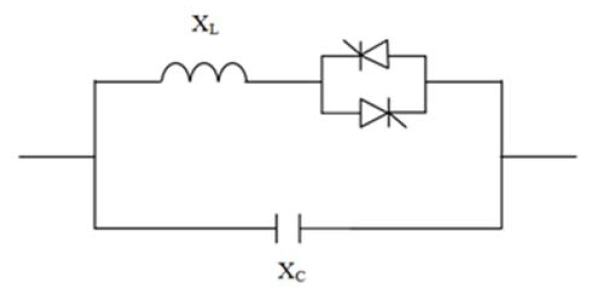
The TCSC is series type of FACTS, it consists of an inductance in series with a thyristor valve, shunted by capacitor, as shown on figure 1 [13],[14].
The impedance of TCSC can be given as following:
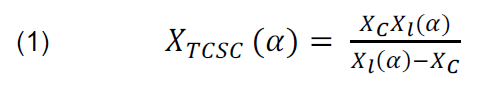
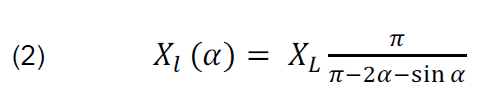
where: α : The firing angle, XL: The reactance of the inductor, XC :is the reactance of the capacitor, Xl is the effective reactance of the inductor at firing
Static Var compensator
SVCs are a shunted type of FACTS controller and is a Static Var absorber or generator whose output is adjusted to exchange inductive or capacitive current to maintain the bus voltage. SVCs consist shunt reactors and capacitors,[15] which are controlled by thyristors as shown in the figure 2.
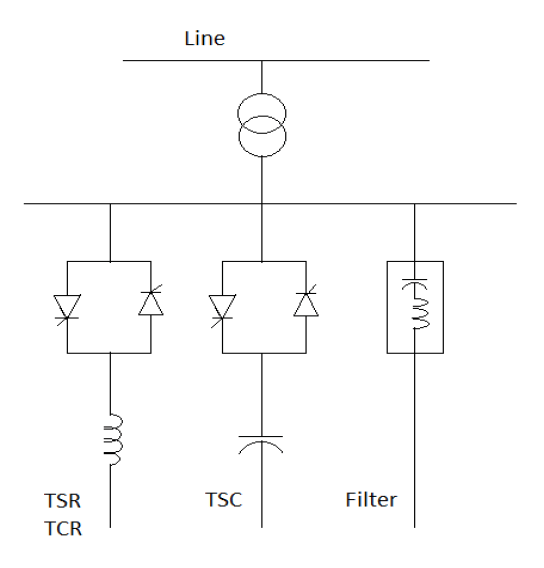
The main objectives of SVC are to increase the stability limit of the power system, to decrease voltage fluctuations during load variations and to limit over voltages due to large disturbances.[16] [17]
The SVC equivalent susceptance is,
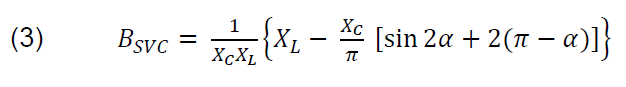
Suppose the SVC is installed at bus k , the reactive power which injected by SVC can be describe as equation following :

Wind turbine generator
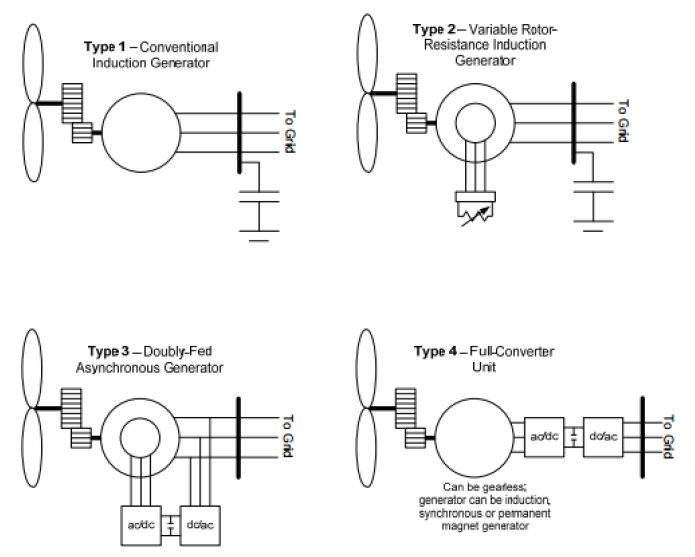
Wind power is the use of air flow through wind turbines, which convert mechanical energy to electrical energy. Today, there are several different concepts of wind turbine generator as shown in figure 3, this classification based on their connection with network, the most commonly of the new models are types 3 and 4 (USA and oversea). However, many users of type 1 and 2 in-services around the world. [18],[19].
The Power Transfer Distribution Factor
The Power transfer distribution factor shows the sensitivity of the flow on line to a transfer of power between two buses i to j, it means the change of real power in a branch flow for a 1 MW exchange between two buses [21],[22]. It shows by the following expression:
This method used for optimal location of TCSC and the TCSC must be placed in most sensitivity line.
where: m– line index, k – bus where power is injected, l – bus where power is taken out, Δfm – change in megawatt power flow on line m when a power transfer of ΔPk to l is made between k and l. ΔPk to l – power transferred from bus k to bus l.
The sensitivity of voltage
The sensitivity of voltage model was developed by Newton-Raphson method, power flow equation is given as
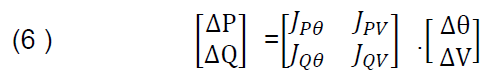
ΔP: the change in the real power, ΔQ: the change in reactive power, ΔV and Δδ are the deviations in bus Voltage magnitude and angle.
To get voltage expressed dV/dQ , the ΔP must assumed to be zero, the final expressed of dV/dQ can be written as:
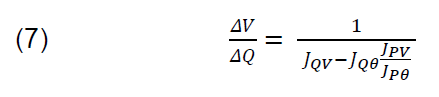
The equation 7 is a sensitivity of voltage to an injection of reactive power at a bus has on various parameters. The SVC device can enhance the voltage stability by injected or absorbed reactive power, the voltage sensitivity used for optimal location of the SVC devices [12].
Results and discussion
In this part, we are used electrical network transmission ( IEEE 14 bus system [23].) for applied the two precedent methods of optimal location of SVC and TCSC ,in different cases of studies .
The steps of simulation are:
• Find the optimal location of FACTS ( TCSC and SVC) .
• Placed FACTS in optimal location and compared the results with and without FACTS.
• Injected a wind generation and compared the results with and without FACTS.
The parameters of wind generator are as following:
Type of Turbine: type 3 (machine model: GEWTG, Exciter model: EXWTGE, Governor model: WNTDGE) . The generator at bus 3 will be modelled using a GEWTG Machine, which models a 30 MW aggregation of GE 1.5 MW DFIGs (Doubly-fed induction generators). It will be equivalent 20 generators of 1,5 MW DFIGs. We replaced the generator of the bus 3 by wind turbine. Then we will find the best location of the TCSC.
Optimal location of TCSC
The IEEE 14 bus system drew by power world simulator, the lines don’t have limits, it observed different limit for each line , such as the highest limit could be seen in the line 4-2 (103 %) , this value indicated the line couldn’t supported transferred power (MW/MVAR) , it mean the line 2-4 overloaded. As show in the figure 4.
Suppose the line 2-4 is overloaded (103%). The main goal of this simulation is solved the overloaded. Using the optimal location of TCSC.
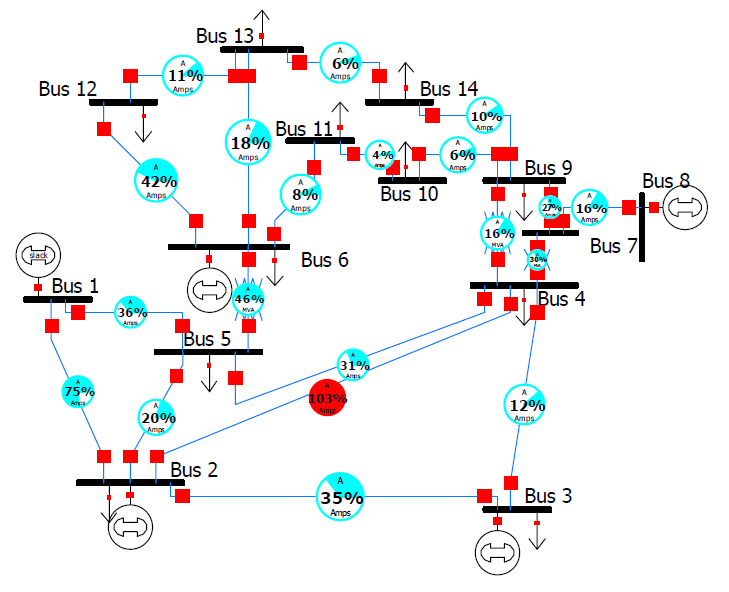
We Suppose the line 2-4 is overloaded (103%) as shown in figure 3, we use the PTDF to find the optimal location of TCSC, for solving the overloaded problems. the results of PTDF show at flowing table:
Table 1. PTDF when line 2-4 overloaded
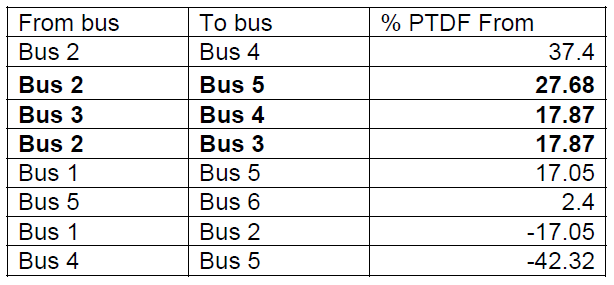
We use the PTDF to find the optimal location of TCSC, for solving the overloaded problems. The results of PTDF are in the table 1
The PTDF of each line when line 2-4 was overloaded. it presented on the table 1, it observed that the most sensitivity lines were the lines 2-4 and 2-5, 37.4% , 27.68% respectively the lines 3-4 and 2-3 had the same sensitivity with 17,87 % it mean same parameters.
Before we place TCSC for each case, we must determinate the total impedance of line. Suppose the compensation is 70% , we can find the values of total impedance (X_(total)) of Xline by equation 8.

XTCSC = 70% Xline or XTCSC = 0.7 Xline
So Xtotal = Xline – 0.7 Xline = 0.3Xline
New impedance of each line can be given as following:
Xtotal(2-5) = 0.173880 x 0.3 = 0.052164 pu
Xtotal(3-4) = 0.171030 x 0.3 = 0.051309 pu
Xtotal(2-3) = 0.197970 x 0.3 = 0.059391 pu
Table 2. The overloaded of line 2-4 after installing TCSC and wind generator
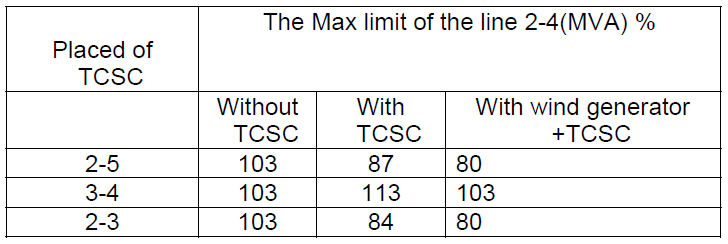
From the table 2, it is indicated the overloaded of line 2-4, after placed TCSC, and TCSC with wind generator together, the two cases explain as following:
Case one, optimal location of TCSC without wind generator:
1) TCSC in line 2-5 : After installed the TCSC in the line 2-5, it observed that, the overload of the line 2-4 decreased from 103% to 87% and creased from 75% to 80 % on the line 1-2. The TCSC reduced the overload on the line 2-4.
2) TCSC in line 3-4: When installed the TCSC in the line 3-4, it observed that the overload of the line 2-4 increased from 103% to 113 %. it indicated that not optimal location of TCSC.
3) TCSC in line 2-3: The TCSC installed on the line 2-3, it observed that the overload of the line 2-4 decreased from 103% to 84% . The TCSC reduced the overload on the line 2-4.
Case two, optimal location of TCSC with wind generator:
1)TCSC in line 2-5 and wind generator at bus 3: When we place the TCSC in the line 2-5 in presence of Wind generator placed on bus 3, the overload is decreased from 103% to 80%, it was better result compared with to install WG. The Wind Generator could be playing function of generator and system of protection.
2)TCSC in line 2-3 and wind generator at bus 3: if the TCSC is placed in the line 2-3, it removed the overload present in line 2-4 from 103% to 80%, the Wind generator was produced the active and reactive power which missed by the power system, the produced power relieved the stability of the power system.
3) TCSC in line 3-4 and wind generator at bus 3: if the TCSC is placed in the line 3-4 and wind generator installed on bus 3 , it noticed that the overload present in line 2-4 increased to 103%, according to the previous result, this line was not the optimal location of TCSC, but compared with last result the overload decreased by 10 % , from 113% to 103 % .
We can conclude that the TCSC and the wind generator can improve the power flow in the network. In our example, they suppress the overload in the line 2-4.
Table 3. The power loss with and without generator wind
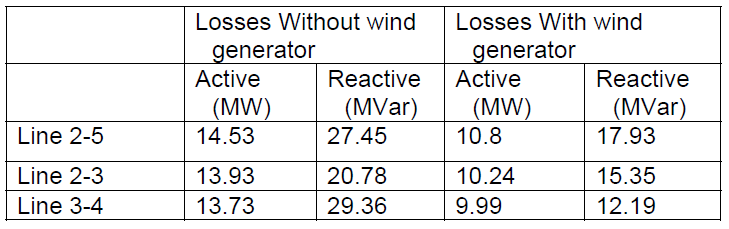
The table 3 shows the active and reactive power loss with and without generator wind.
1)The total of active power loss with wind generator decreased for three cases, if TCSC placed in line 2-5 , it noticed that the total active loss minimized almost 3,73 MW , When TCSC placed in line 2-3 as shown in figure 11 the total of active power loss minimized by 3.69 Mw . Finally, The TCSC placed in line 3-4 the active power loss decreased by 3.74 Mw .
From the results, it observed the most reduced loss active power when TCSC installed in 3-4 . But this line was not the optimal location, because the overload did not removed on the line 2-4 .
The wind generator could be reduced the active power loss.
2)The total of reactive power loss with wind generator decreased for three cases, if TCSC placed in line 2-5 , it noticed that the total active loss minimized almost 9,52 Mvar , When TCSC placed in line 2-3 the total of reactive power loss minimized by 5,43 Mvar . Finally, The TCSC placed in line 3-4 the reactive power loss decreased by 17,17 Mvar .
From the results show in the table 2, it observed the most reduced loss reactive power when TCSC installed in 3-4 . But this line was not the optimal location, because the overload did not removed on the line 2-4 . The wind generator could be reduced the reactive power loss.
Optimal location of SVC
In this section, we used the same power system (14 IEEE bus system) , in this case we try used shunt type of FACTS ( SVC ) for controlling the voltage , we remember that the limit of voltage used in this simulation is ±10%.
For example:
If bus 1 has more or less 10% than it’s voltage (drop voltage or overvoltage) , we can say , that is risk ,we should use protection devices.
Table 4. Voltage profile of IEEE 14 bus in de base case

From the result of voltage profile which indicates in table 4 , it is noticed that most voltage of buses is between 1.06 pu and 0.92962 pu , however there are three critical buses, which are bus 12 (0.84036 pu) , bus 13(0.85519 pu) and bus 14 (0.8926 pu) .
We have just drop voltage in three buses, there is not overvoltage.
The voltage sensitivity factor used to install the SVC in the optimal placement in the power system, where the SVC should be placed in most sensitivity bus.
Table 5. Voltage profile of IEEE 14 bus in de base case
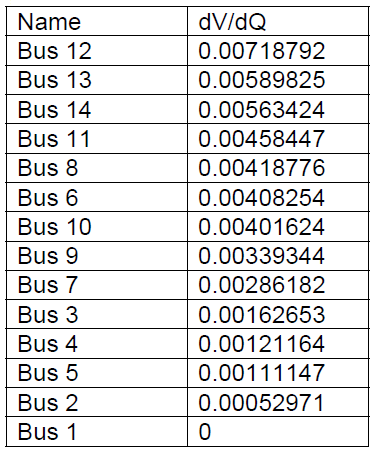
Table 5 shows the voltage sensitivity when we injected a reactive power. We can see different values, 0 in the slack bus (because the slack-bus has constant voltage) . The most sensitivity bus is bus 12 (0.00718792). If the SVC is installed in this bus, it will inject a reactive power which can be help to improve the voltage at the critical buses.
Table 6. Compared voltage magnitude for three cases
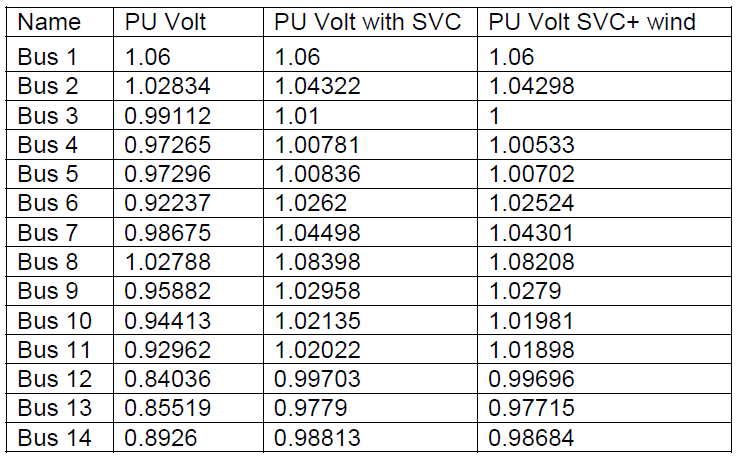
From the result after installing SVC at bus 12 as shown in table 6 , the voltage is improved for all buses than the base case , almost the voltage is more than 1 pu just for the critical buses improve from 0.84036 pu to 0,99703 pu at bus 12 , from 0,85519 pu to 0.9779pu at bus 13 and from 0.8926 pu to 0.98684 pu at bus 14. The slack-bus always has constant voltage.
We are noticed that the reactive power injected by SVC in bus 12 is 29.6 MVar .
The SVC is used to limit the transfer of reactive power for reduce the drop voltage. The optimal location of SVC is very important for improving the security of power system. When the SVC placed at bus 12 and changed the generator at bus 3 by wind generator, it can see that the reduction of voltage with small value of each bus , because of the variation of frequency due to the variation of speed of turbine generator.
Conclusion
This paper presents new methods for the optimal location of FACTS. The proposed method is the power transfer distribution factor used for TCSC and sensitivity voltage for SVC. We conclude, the wind generator permits to enhance the function of TCSC and SVC. As result, the active and reactive loss is decreased after injected the wind generator. The install of FACTS (TCSC, SVC) and wind generator simultaneously can be economically.
REFERENCES
[1] A. N. L. Sayyed., P. M. Gadge , Sheikh R.U., “Contingency Analysis and Improvement of Power System Security by locating Series FACTS Devices TCSC and TCPAR at Optimal Location, ” IOSR-JEEE, 2014 , p. 19-27.
[2] J. Navani, M. Goyal, , S. Sapra, “Optimal Placement of TCSC and UPFC for Enhancement of Steady State Security in Power System, ” International Journal of Advances in Engineering Science and Technology, 1, 2013 , pp. 122-129, 2013.
[3] S. Singh, “Location of FACTS devices for enhancing power systems’ security, ” in Power Engineering, 2001. LESCOPE’01. 2001 Large Engineering Systems Conference on, 2001.
[4] Wind power by country, [online], Available at: https://en.wikipedia.org
[5] Thanh Long Duong, Yao JianGang , VietAnh Truong , A new method for secured optimal power flow under normal and network contingencies via optimal location of TCSC, Electrical Power and Energy Systems journal , 53, 2013.
[6] Madhura Gad, Prachi Shinde, S.U.Kulkarni ,“ Optimal ocation of TCSC by Sensitivity Methods”, International Journal Of Computational Engineering Research, Vol. 2 Issue. 6,pp 162-168,2013.
[7] Ghamgeen I. Rashed , Yuanzhang Sun , H. I. Shaheen, Optimal Location and Parameter Setting of TCSC for Loss Minimization Based on Differential Evolution and Genetic Algorithm , International Conference on Medical Physics and Biomedical Engineering, Physics Procedia 33 1864 – 1878. (2012)
[8] P. S. Vaidya and V. P. Rajderkar, Enhancing Power System Security by Proper Placement of Thyristor Controlled Series Compensator (TCSC), International Journal of Engineering and Technology, 4, 5, October 2012.
[9] Darko Šošić, Ivan Škokljev, Nemanja Pokimica, Features of Power Transfer Distribution Coefficients in power System Networks , INFOTEH-JAHORINA ,13, pp. 86 – 90 (March 2014).
[10] Chong Suk Song, Chang Hyun Park, Minhan Yoon & Gilsoo Jang , Implementation of PTDFs and LODFs for Power System Security , Journal of International Council on Electrical Engineering, 1, 1, pp. 49-53, 2011.
[11] Henrik Ronellenfitsch, Marc Timme, Dirk Witthaut, A Dual Method for Computing Power Transfer Distribution Factors, JOURNAL OF L ATEX CLASS FILES, 13, 9, SEPTEMBER 2014.
[12] Jitendra Singh Bhadoriya , Chandra Kumar Daheriya,“An Analysis of Different Methodology for Evaluating Voltage Sensitivity”, International Journal of Advanced Research in Electrical, Electronics and Instrumentation Engineering, vol.3, no. 9,pp 12239 – 12246,September 2014
[13] S.V. Jethani ,V.P. Rajderkar, “Sensitivity based optimal location of TCSC for improvement of power system security, ” International Journal of Research in Engineering and Technology, vol. 3, 2014, pp.121-124.
[14] J. Srinivasa Rao , J. Amarnath , “Enhancement of Transient Stability in a Deregulated Power System using Facts Devices, ” Global Journal of Research In Engineering, vol. 14, 2014.
[15] A. Edris, R. Adapa, M.H. Baker, L. Bohmann, K. Clark, K. Habashi, L. Gyugyi, J. Lemay, A. Mehraban, A.K. Myers, J. Reeve, F. Sener, D.R. Torgerson, R.R. Wood,“Proposed Terms and Definitions for Flexible AC Transmission System (FACTS)”, IEEE Transactions on Power Delivery, vol.12, no. 4,pp 1848-1853, October 1997.
[16] Ryan.M, High-Voltage Engineering and Testing ,3rd ed, Institution of Engineering and Technology. 2013.
[17] Padmavathi S.V., Sahu S.K., Todoran G., Jayalaxmi A., “Modeling and simulation of static var compensator to enhance the power system security”, in: Proceedings of the International Conference “ Postgraduate Research in Microelectronics and Electronics (PrimeAsia)”, Visakhapatnam, India, 19-21 Dec. 2013 , IEEE,06 February 2014, pp. 52-55.
[18] Working Group Joint Report – WECC Renewable Energy Modeling Task Force & IEEE Working Group on Dynamic Performance of Wind Power Generation, Generic Stability Models for Type 3 & 4 Wind Turbine Generators for WECC, International conference of IEEE Power & Energy Society General Meeting, Vancouver, BC, Canada, 2013.
[19] Jens Fortmann , Modeling of Wind Turbines with Doubly Fed Generator System , Springer Fachmedien Wiesbaden, Germany,2014, pp 3-5.
[20] EPRI, “Proposed Changes to the WECC WT4 Generic Model for Type 4 Wind Turbine Generators”, Prepared under Subcontract No. NFT-1-11342-01 with NREL, Issued to WECC REMTF and IEC TC88 WG27 12/16/11; (last revised 1/23/13).[Online].Available:https://www.wecc.biz/Reliability/Report_on_WT4_Model_Description_PP012313.pdf.
[21] Ravi Kumar, S. C. Gupta and Baseem Khan , Power Transfer Distribution Factor Estimate Using DC Load Flow Method, International Journal of Advanced Electrical and Electronics Engineering (IJAEEE),2, 6, pp. 155-159( 2013).
[22] Allen J. Wood, Bruce F. Wollenberg, and Gerald B, Power Generation, Operation and Control 3 thrd edition, John Wiley & Sons, Inc., Hoboken, New Jersey . 2013.
[23] http://icseg.iti.illinois.edu/ieee-14-bus-system/ last update 7 may 2014.
Authors: PhD student Messaoud Zobeidi , Department of electrical Engineering laboratory of ICEPS, Djillali Liabes Universiy, Sidi-Bel-Abbes, messoud91@yahoo.fr ; Pr Fatiha Lakdja , Department of Electrical Engineering, University Saida , laboratory of ICEPS, Djillali Liabes Universiy, Sidi-Bel-Abbes , flakdja@yahoo.fr ; Dr Yamina Ahlem Gherbi , Department of electrical Engineering, USTO-MB Oran , Durable Development of Electric Power laboratory, Algeria aygherbi@yahoo.fr ; Pr Fatima Zohra Gherbi, Department of Electrical Engineering laboratories of ICEPS, Djillali Liabes Universiy , Sidi-Bel-Abbes,Algeria ,fzgherbi@yahoo.fr
Source & Publisher Item Identifier: PRZEGLĄD ELEKTROTECHNICZNY, ISSN 0033-2097, R. 96 NR 9/2020. doi:10.15199/48.2020.09.09
