Published by Bukurije HOXHA1, Risto V.FILKOSKI2 ,
University of Prishtina “Hasan Prishtina” (1), Ss. Cyril and Methodius University, Skopje (2)
ORCID: 1. 0000-0002-8890-2054; 2. 0000-0002-3743-318X
Abstract. Optimisation of the placement of wind turbines in a farm is an important stage in wind farm construction. Koznica, a mountainous terrain available for wind farms, is considered in the present work, with the aim to optimise the configuration of a park of 10 turbines. The one-year measurements carried out in the specified place of the Koznica mountain have confirmed the wind energy potential. The present work focuses on analysing how the distance between wind turbines affects the energy produced in configurations of 2, 3 and 5 diameters distance between the turbines, using a particular turbine type with predefined technical characteristics. Interaction analysis is conducted in terms of wake effect, affecting the annual output energy and wind farm efficiency, depending on the farm configuration. The wake effect here is shown as the wind speed deficit. That deficit intensity is removed from the current and previous intensity of each respective turbine. Finally, the difference between the farm organisation’s optimised form and the previous configurations is shown, emphasising the annual energy produced depending on the capacity factor.
Streszczenie. Optymalizacja rozmieszczenia turbin wiatrowych na farmie jest ważnym etapem budowy farmy wiatrowej. W niniejszej pracy uwzględniono Koznicę, górzysty teren dostępny pod farmy wiatrowe, w celu optymalizacji konfiguracji parku 10 turbin. Roczne pomiary przeprowadzone we wskazanym miejscu góry Koznica potwierdziły potencjał energetyki wiatrowej. W niniejszej pracy skupiono się na analizie wpływu odległości między turbinami wiatrowymi na energię wytwarzaną w konfiguracjach 2, 3 i 5 średnic odległości między turbinami, z wykorzystaniem określonego typu turbiny o określonych parametrach technicznych. Analiza interakcji prowadzona jest pod kątem efektu czuwania, mającego wpływ na roczną moc wyjściową i sprawność farmy wiatrowej, w zależności od konfiguracji farmy. Efekt kilwateru jest tutaj pokazany jako deficyt prędkości wiatru. Ta intensywność deficytu jest usuwana z aktualnej i poprzedniej intensywności poszczególnych turbin. Na koniec pokazano różnicę między zoptymalizowaną formą organizacji gospodarstwa a poprzednimi konfiguracjami, podkreślając roczną produkcję energii w zależności od współczynnika wydajności. (Oddziaływanie miedzy turbinami w złożonej terenowej farmie wiatrowej)
Keywords: wind turbine, capacity factor, efficiency, energy yield, complex terrain.
Słowa kluczowe: farmy wiatrowe, turbiny, oddziaływanie między turbinami
Introduction
Airflow as a potential energy source is free. Air is used as the main source of energy production in wind farms and the initial assumption is that it, as an interaction fluid, will have identical energy potential for all turbines on the farm under consideration. In order for the flow of this interaction fluid not to be affected from the previous turbine to the next, it is necessary to have an optimal possible distance between the turbines. Objectively, the optimal distance is impossible to achieve to a large extent in the case of terrains such as this one that is the subject of analysis in this case. This is due to the frequent ups and downs of the hilly terrain for which the analysis is performed. Energy is a vital key to socio-economic development and economic growth [1]. Wind energy constitutes a clean and economical source to generate electricity and is suitable for countries with moderate to high wind potential [2]. Based on Global Wind Energy Council (GWEC) data’s 2018, the worldwide newly installed wind energy capacity exceeds 60 GW in 2020, distributed over about 100 countries, and it is estimated that the globally installed wind energy capacity will exceed 800 GW [3]. Wind energy has the potential to produce power for each hour of the day and in different capacities due to different wind speeds [4]. To make the most of wind energy, between the other, improvements in the design, construction and materials must be made to have the highest energy conversion efficiency [5]. Today, wind power is considered a booming sector, and wind turbine manufacturers face difficulties meeting the market demand [6]. They are manifested in different forms, such as in the construction of the rotor part of the turbine, with the addition of other units, i.e., mini turbines [7 – 9], thus creating multiple rotors. Such a method is not yet widely used and what is known is that it contributes to a significant reduction in the total cost of a wind farm. During planning a wind farm, it is necessary to assess the wind resources of the potential site [10]. The element that requires further study is the fatigue of the structure because of the turbulence generated and the problems with reduced overall efficiency for operating in this form if it is not preceded by static side analysis [11]. According to the work [12], significant problems which must be solved to support the development of wind energy are the insurance of power transmission capacity of the electricity network, balancing the energy generated by wind power plants related to the error control of forecasting, and transition of the energy system from conventional to renewable generation. In this study, a detailed description of the parameters that characterise the placement of wind turbines in a farm according to the software and analytical method is realised. Wind measurements must be as accurate as possible to achieve optimal placement of turbines in a wind farm [13]. Greater accuracy of measured data means a more extended period of measurement and collection of wind parameters at the place where the wind farm will be built. Calculations regarding the optimisation of the placement of wind turbines on the wind farm in Koznica were made through WAsP software where the change of the interaction of the turbines between themselves can be simulated and clearly understood [14], in addition to the numerical method WEST, which is more appropriate. Studies have shown a very good correlation between the data obtained from the use of the software in question and the numerical form of the simulation [15]. Installed wind energy capacity has grown from less than 20 gigawatts (GW) in 2000 to 590 GW by the end of 2018 and already provides 6% of the electricity consumed in the world [16]. By knowing the important role that renewable-energy sources play in this context, identifying suitable sites for installing renewable-energy facilities is a crucial task [17, 18]. The wind farm layout optimisation (WFLO) problem consists of finding the turbine positions that maximise the expected power production in terms of coordinates and altitude of hub height [19]. However, the effect of wind veer causing a partial yaw error over the rotor span is rarely considered. Analysis of such effects becomes increasingly important as the dimensions of the wind turbine rotors increase [20]. To estimate the energy potential when it comes to wind energy, measurements must be made on the source side, and in this case, the key data is the wind speed. Measurements are a significant part of the cost of investing in a wind farm, and it is usually attempted to simulate the interactions of the individual turbines in a wind farm through some software such as CFD [21, 22]. To help in understanding the wind farm processes, some of the widely used wind energy application programs are being used, such as WAsP, WindPro, WindFarmer, WindSim, and Windographer [23 – 25]. However, because WAsP was developed for linear, steady flow analyses, its applicability for analyses of wind flow over complex terrain is very limited. In recent years, nonlinear, unsteady flow analyses have become possible because of the rapid improvement of computers [26 – 28]. In the last part of this work, further investigations have been carried out to compare the WEST results with linear simulation WAsP. Finally, considering commercial models of a wind turbine, the wind potential has been estimated for each turbine in this park. It is important to remark that the scope of the WEST method is not to yield more accurate or exact results concerning WAsP but to be a cheaper and faster alternative for simulations, to have good results in less time. The paper takes into consideration a very detailed and unrealized analysis of the complex mountain terrain. The more contributing is the fact that in the case of installing wind turbines in our case we have a significant change in terms of altitude. The impact of such a change is negative. This is because in such a case some “fictitious tunnels” are created which are negative loads for the turbines.
Material and Methods
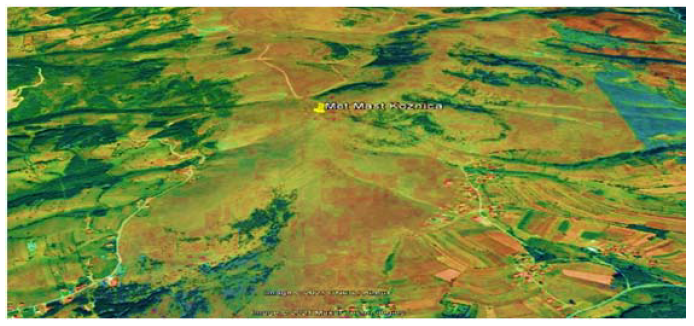
The wind farm considered in this study is in Koznice, a mountainous terrain without obstacles such as tall buildings, rocks, or trees. The considered terrain of 20 km – 20 km is considered. The determination of the coordinates is done based on the map of wind density and speed, of course, for each configuration looking to meet that condition. Figure 1 shows the specified location of Koznica, specified by its met mast.
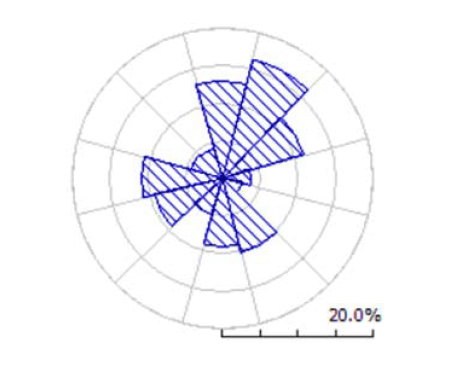
The two most essential elements that are important when analysing a potentially potential place in the field of wind energy are the intensity of the average wind speed and its direction. The wind direction in Koznica is shown in figure 2.
Regarding the interaction of air masses with special emphasis, it is important to take the interaction between the height referred to build the wind park and the complex terrain represented with the degree of roughness. In detail, in table 1 are presented the average speeds at heights 40, 60 and 84m.
Table. 1. Wind speed intensity
| Measurement height, m | 84 | 60 | 40 |
| Average wind speed, m/s | 6.16 | 5.85 | 5.64 |
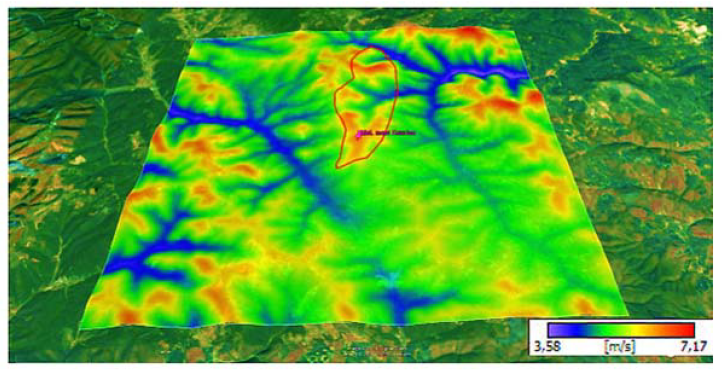
Then for energy calculation are considered 3 type of wind turbines and their number is 10. The average annual wind speed of Koznica at 84 m height above ground level is shown in Fig. 3. Maps are created using the WAsP software based on annual data from one-year measurement of met mast of location Koznica and formed digital maps of terrain orography and roughness.
Types of wind turbines considered are presented in table 2 with their technical data.
Table. 2. Main data for wind turbines used in the study, thrust coefficient, CEF, and wake decay coefficient.
| WT Type | D | Pf | Zh | Wr | Wind speed, m/s | Thrust Coefficient | α |
| Siemens SWT-130-3.3 | 130 | 3.3 | 10 | 12.5 | 6.6 | 0.80 | 0.0609 |
| Vestas V-126-3.45 | 126 | 3.45 | 87 | 20 | 6.9 | 0.785 | 0.0627 |
| GE Wind GE-130-3.4 | 130 | 3.4 | 85 | 18 | 6.5 | 0.83 | 0.0628 |
Power production modelling
To estimate the power production of WF under the wake effect, we need at the first stage to determine the power generated by each WT. There are many expressions to approximate the power curve of WT that are elaborated in detail by [29, 30]. Thus, the power production of WT is estimated as follows:
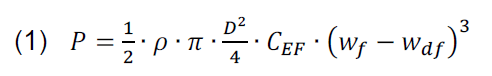
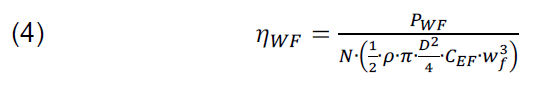
where CEF represents the efficiency factor expressed as follows:

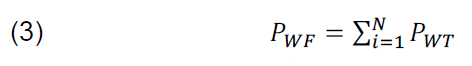
In the present study, CEF is assumed to be equal to 50%. The total power generated by WTs operating under wake effect is:
Wind farm efficiency is obtained using this equation:
According to Jensen wake model, the wdf – wind velocity deficit is expressed as follows:
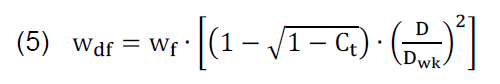
Based on the Jensen model as described in figure 4 graphically, it is said that the near wake region is for 2D, Intermediate is 2-3D, and far wake > 5D distance. To see this effect then it is used for a real wind farm with real wind speed, direction and standard deviation data [31-33].

As stated initially, the difference in energy produced is not high for the best case according to Jensen and optimisation according to software and terrain taken in study [34-36]. The expression for electricity calculation is multiplied by 0.98, as a correction coefficient that brings innovation in the field of energy calculation. Difference in energy yield for each case is described in figure 5. We see that the huge amount of energy yield is for the highest distance between wind turbines, 5D.
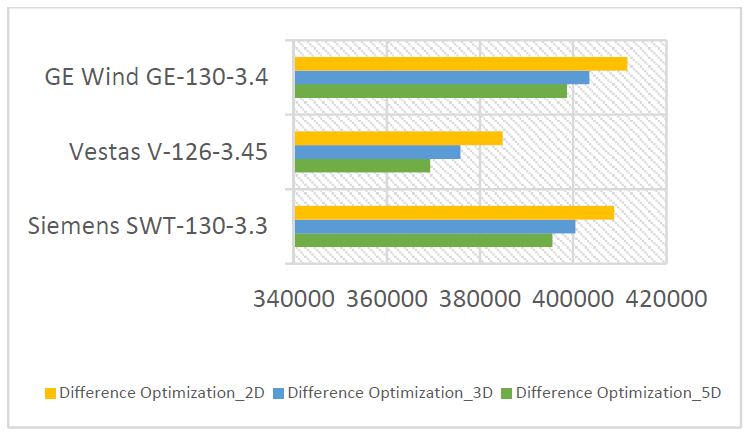
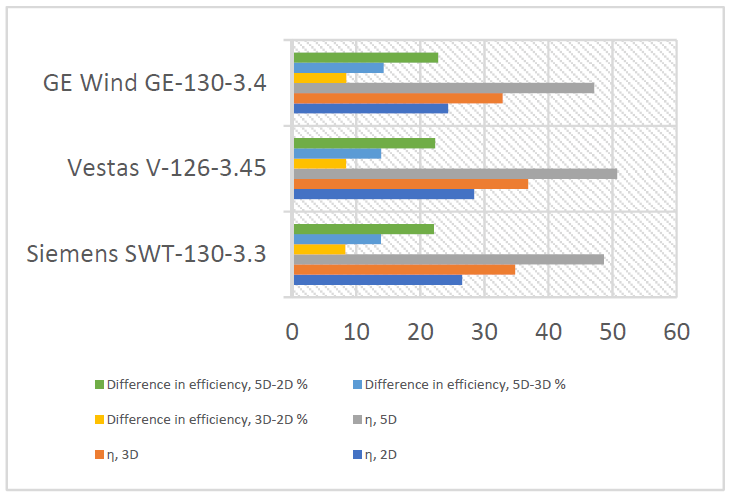
The following figure shows the ratio of the largest amount of energy generated during the year for the placement of turbines at 5D distance compared to 3D and 2D cases and 3D/2D cases.
After analysing the change in the intensity of the annual energy produced within the distances then the optimisation model is formed so that we can have a clear reflection of the speed in each position of the turbines and the organising of the park, presented in figure 7.

To carry out the analysis of the produced energy and efficiency it is necessary to present the data of their speed and coordinates. The data are valid for the measuring height of 110m as the average data for all turbines. The distance shown is in order from 1-2, 2-3, onwards.
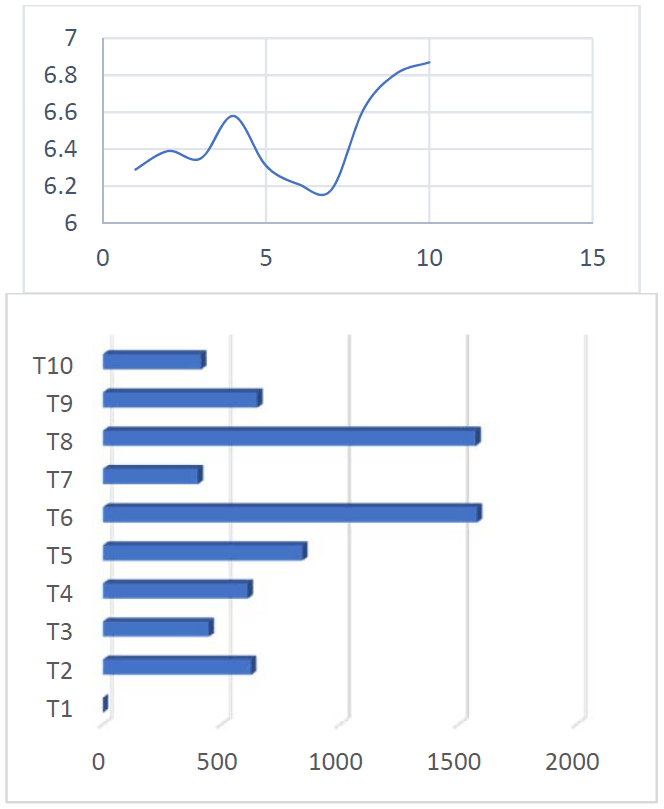
From the previous figure in the optimisation configuration, we have in each turbine the speed above 6 m/s which is an indicator for the wake effect.
Conclusions
In this paper, the Jensen model has been used to study and evaluate the wind energy potential of a wind farm in Kosovo, exactly Koznica. This model allowed reconstructing the distribution of wind fields of complex territories, providing helpful information about wind farm layout optimisation. The interaction between the wind turbines is explained in terms of the wake effect created by the previous turbine in the next one. Finally, in the last part of this paper, all turbines in that windfarm have been investigated by WAsP simulations, confirming the new proposed methodology as an acceptable way for windfarm analysis. It has been shown in the paper that the wind speed deficits obtained from the Jensen wake model for a wind turbine, as a function of wind direction, depend on how we observe wakes. Results are different when considering that the deficits are observed by a point measurement, met mast, compared with those observed by a second turbine due to partial wake interaction. Moreover, the remarkable correlation between the approximated method through many calculations and that achieved by the WAsP software can be noticed, due to the linearity that accompanies them. When comparing the use of such a method with different software, we can see that we have a higher correlation with WAsP software because the modelling is linear. Future research will focus on the investigation of the structure and characteristics of the wakes originated from large wind farms under different ABL flow cases involving different land surface covers and different atmospheric stability conditions.
REFERENCES
[1] Joselin Herbert G.M., Iniyan S., Sreevalsan E., Rajapandian S., A review of wind energy technologies. Renewable and Sustainable Energy Reviews. Volume 11, Issue 6, August 2007.
[2] NA. Kallioras, N.D. Lagaros, M.G. Karlaftis, P. Pachy, Optimum layout design of onshore wind farms considering stochastic loading. Adv. Eng. Softw. 88, 8–20 (2015). https://doi.org/10.1016/j.advengsoft.2015.05.002
[3] Wu, X.; Hu, W.; Huang, Q.; Chen, C.; Chen, Z.; Blaabjerg, F. Optimized Placement of Onshore Wind Farms Considering Topography. Energies 2019, 12, 2944.
[4] Demolli H., Sakir A., Ecemis A., and Gokcek M., “Wind power forecasting based on daily wind speed data using machine learning algorithms,” Energy Convers. Manag., vol. 198, 2019.
[5] Glassbrook, K.A., Carr, A.H., Drosnes, M.L., Oakley, T.R., Kamens, R.M., Gheewala, SH, 496 2014. Life cycle assessment and feasibility study of small wind power in Thailand. Energy for 497 Sustainable Development 22, 66–73.
[6] Abbes M., Belhadj J. Development of a methodology for wind energy estimation and wind park design. JOURNAL OF RENEWABLE AND SUSTAINABLE ENERGY 6, 053103 (2014)
[7] Watson, S., Moro, A., Reis, V., Baniotopoulos, C., Barth, S., Bartoli, G., Bauer, F., Boelman, E., Bosse, D., Cherubini, A., Croce, A., Fagiano, L., Fontana, M., Gambier, A., Gkoumas, K., Golightly, C., Latour, M., Jamieson, P., Kaldellis, J., and Wiser, R., Future emerging technologies in the wind power sector: A European perspective,Renewable and Sustainable Energy Reviews, Vol. 113, 10 2019, pp. 109-270.
[8] Flynn, D., Rather, Z., Ardal, A., D’Arco, S., Hansen, A.D., Cutululis, N.A., Sorensen, P., Estanquiero, A., Gomez, E., Menemenlis, N. and Smith, C., 2017. Technical impacts of high penetration levels of
wind power on power system stability. Wiley Interdisciplinary Reviews: Energy and Environment, 6(2), p.e216.
[9] Cherubini A, Papini A, Vertechy R, Fontana M. Airborne wind energy systems: a review of the technologies. RenewSustainEnergyRev2015; 51:1461–76.
[10] M. Ayala, J. Maldonado, E. Paccha, and C. Riba. Wind Power Resource Assessment in Complex Terrain: Villonaco Case-study Using Computational Fluid Dynamics Analysis. Energy Procedia, 107(September 2016):41–48, 2017.
[11] Porté-Agel, F., Bastankhah, M. & Shamsoddin, S. Wind-Turbine and Wind-Farm Flows: A Review. Boundary-Layer Meteorol 174, 1– 59 (2020). https://doi.org/10.1007/s10546-019-00473-0.
[12] Jonaitis, A.; Gudzius, S.; Morkvenas, A.; Azubalis, M.; Konstantinaviciute, I.; Baranauskas, A.; Ticka, V. Challenges of IntegratingWind Power Plants into the Electric Power System: Lithuanian Case. Renew. Sustain. Energy Rev. 2018, 94, 468–475.
[13] Al-Abadi A, Youjin K., Ertunç. Ö, Delgado A. (2016). Turbulence impact on wind turbines: experimental investigations on a wind turbine model. Journal of Physics Conference Series 753(3). https://doi.org/10.1088/1742-6596/753/3/032046.
[14] Mortensen, N. G. (2018). Wind resource assessment using the WAsP software. DTU Wind Energy. DTU Wind Energy E, No. 174
[15] Milanese M, Congedo PM, Colangelo G, et al. (2019) Numerical method for wind energy analysis in WTG sitting. Renewable Energy 136: 202–210.
[16] Yusta J., Arantegui R., Measuring the internationalisation of the wind energy industry. Renewable Energy 157 (2020). Volume 157, September 2020, Pages 593-604.
[17] Díaz-Cuevas, P. GIS-Based Methodology for Evaluating the Wind-Energy Potential of Territories: A Case Study from Andalusia (Spain). Energies 2018, 11, 2789.
[18] Asnaz M.S.K., Yuksel B., Ergun K. (2020) Optimal Siting of Wind Turbines in a Wind Farm. In: Machado J., Özdemir N., Baleanu D. (eds) Mathematical Modelling and Optimisation of Engineering Problems. Nonlinear Systems and Complexity, vol.30 Springer, Cham. https://doi.org/10.1007/978-3-030-37062-6_6.
[19] Gu H., Wang J., Irregular-shape wind farm micro-siting optimisation. Energy 57, 535-544 (2013).
https://doi.org/10.1016/j.energy.2013.05.066.
[20] Bardal, L. M., Sætran, L. R., and Wangsness, E.: Performance Test of a 3 MW Wind Turbine – Effects of Shear and Turbulence, Energy Proced., 80, 83–91, https://doi.org/10.1016/j.egypro.2015.11.410, 2015.
[21] Tabas, D.; Fang, J.; Porté-Agel, F. Wind Energy Prediction in Highly Complex Terrain by Computational Fluid Dynamics. Energies 2019, 12, 1311.
[22] Richmond, M. Antoniadis, A. Wang, L. Kolios, A. Al-Sanad, S. Parol, J. Evaluation of an offshore wind farm computational fluid dynamics model against operational site data. Ocean Engineering Volume 193, 1 December 2019, 106579.
[23] Yılmaz U., Balo F., and Sua S. Simulation Framework for Wind Energy Attributes with WAsP. Procedia Computer Science. Volume 158, 2019, Pages 458-465
[24] Carvalho, D. & Rocha, A. & Santos, C. Silva & Pereira, R., 2013. “Wind resource modelling in complex terrain using different mesoscale–microscale coupling techniques,” Applied Energy, Elsevier, vol. 108(C), pages 493-504.
[25] Gasset, N.; Landry, M.; Gagnon, Y. A Comparison of Wind Flow Models for Wind Resource Assessment in Wind Energy Applications. Energies 2012, 5, 4288–4322.
[26] Uchida, T.; Takakuwa, S. A Large-Eddy Simulation-Based Assessment of the Risk of Wind Turbine Failures Due to Terrain-Induced Turbulence over a Wind Farm in Complex Terrain. Energies 2019, 12, 1925.
[27] Mohamed B, Fadela B, Mounir K (2015) Optimisation of the wind turbines location in Kaberten wind farm in Algeria. Energy
[28] CL Archer, A. Vasel-Be-Hagh, C. Yan, S. Wu, Y. Pan, J.F. Brodie, A.E. Maguire, Review and evaluation of wake loss models for wind energy applications, Appl. Energy 226 (2018) 1187e1207.
[29] J. Scire, F. Robe, M. Fernaua, R. Yamartino, A User’s Guide for the CALMET Meteorological Model, Technical Report Version 5, Earth Tech Inc., Concord, MA, USA, 2000.
[30] M. Milanese, L. Tornese, G. Colangelo, D. Laforgia, A. de Risi, Numerical method for wind energy analysis applied to Apulia Region, Italy, Energy 128 (2017) 1e10.
[31] F. González-Longatt, P. Wall, and V. Terzija, “Wake effect in wind farm performance: Steady-state and dynamic behavior,” Renewable Energy, vol. 39, no. 1, pp. 329–338, Mar. 2012.
[32] CL Archer, A. Vasel-Be-Hagh, C. Yan, S. Wu, Y. Pan, J.F. Brodie, A.E. Maguire, Review and evaluation of wake loss models for wind energy applications, Appl. Energy 226 (2018) 1187e1207.
[33] Bachhal A., Vogstad K., Lal Kolhe M., Chougule A., Beyer G.H. Wake and Turbulence Analysis for Wind Turbine Layouts in an Island. ICPRE 2018. E3S Web of Conferences 64, 0 (2018).
[34] Lopez-Villalobos, C.A.; Rodriguez-Hernandez, O.; Campos-Amezcua, R.; Hernandez-Cruz, G.; Jaramillo, O.A.; Mendoza, J.L. Wind Turbulence Intensity at La Ventosa, Mexico: A Comparative Study with the IEC61400 Standards. Energies 2018, 11, 3007.
[35] Emejeamara, F.; Tomlin, A.; Millward-Hopkins, J. Urban wind: Characterisation of useful gust and energy capture. Renew. Energy 2015, 81, 162–172.
[36] W. Miao, C. Li, G. Pavesi, J. Yang, X. Xie, Investigation of wake characteristics of a yawed HAWT and its impacts on the inline downstream wind turbine using unsteady CFD, J. Wind Eng. Ind. Aerodyn. 168 (2017) 60e71.
Authors. First author is Msc. Ass. Bukurije Hoxha, Faculty of Mechanical Engineering, University of Prishtina, street “Sunny Hill”, nn, 10000, Prishtina, e-mail: bukurije.hoxha@uni-pr.edu. Second author is Prof. Dr. Risto V. Filkoski, Faculty of Mechanical Engineering, Ss Cyril and Methodius, Rudjer Boshkovic Str. 18, 1000 Skopje, R.N. Macedonia, e-mail: risto.filkoski@mf.edu.m
Source & Publisher Item Identifier: PRZEGLĄD ELEKTROTECHNICZNY, ISSN 0033-2097, R. 98 NR 4/2022. doi:10.15199/48.2022.04.02
