Published by Ji SHENGCHANG, Zhu LINGYU, Li YANMING,
State Key Laboratory of Electrical Insulation and Power Equipment, Department of electric engineering, Xi′an Jiaotong University
Abstract. Vibration signal analysis method is one of effective methods to monitor the condition of transformer windings and core. In this paper, the multi-channels vibration measurement system is set up and the vibration signals on the oil-tank surface of running transformer in the field are measured. The influences of transformer type and sensor positions on the measured vibration signals are analyzed. The results show that, the same type of transformer’ oil tank vibration signals have almost same characteristics, and the vibration signals measured on a transformer tank surface have similar characteristics only at the same position of phase “A” (or “a”) and “C” (or “c”). Moreover, the attachment position of each sensor should be marked on the tank surface with paint, which is the reference position in the next measurement. It was recommended that the permissible error in the position of the sensor is within 5cm. The vibration characteristics acquired in the field are applied to diagnose a transformer suffered three-phase short circuit, and the results presented show the accuracy and efficiency of the acquired transformer tank vibration characteristics.
Streszczenie. Analiza sygnału wibracji jest jedną z metod monitorowania stanu uzwojeń i rdzenia transformatora. W artykule zastosowano wielokanałowy analizator wibracji do badania pracującego transformatora. Analizowano wpływ pozycji czujnika dla różnych typów transformatora. Stwierdzono, że sygnały wibracji miały podobny charakter dla jednego rodzaju transformatora i że sygnały są podobne dla tej samej pozycji czujnika. Rekomendowane jest więc zaznaczanie pozycji czujnika (z tolerancją 5 cm) dla otrzymania powtarzalności pomiarów. Otrzymane sygnały wibracji mogą być wtedy wykorzystywane do diagnostyki. (Analiza sygnału wibracji transformatora i jej wykorzystanie)
Keywords: Transformer, oil tank, vibration characteristics, in the field, windings and core
Słowa kluczowe: transformator, wibracje, diagnostyka.
Introduction
Throughout transformer’s life, mechanical shocks during transportation and installation, insulation aging, repeated thermal processes and multiple short-circuit forces will cause winding deformations or core clamping pressures drop. It leads, particularly, to the reduction of the capability to withstand future short circuit electro-mechanical stresses, to the increase of the winding vibration and, consequently, to the increase of the solid insulation mechanical fatigue. In this way, the isolation can be degraded and short circuits between turns will appear. The defects mentioned can create PDs and combustible gases, thus converting the mechanical defect into the problem of insulation [1, 2]. From these considerations, the relevance of an early detection of winding deformations or core clamping condition is clear. Some techniques, such as frequency-response analysis (FRA) [1, 3] or leakage reactance measurement (LRM) [4], are widely used to detect changes in transformer geometry, especially winding deformations. Although, in recent years, some publications have appeared reporting some online applications of these techniques [5, 6], at the moment they are used only in offline tests. Steady-state vibration recorded on the tank surface provides essential information about running conditions both for windings and the magnetic core in power transformer [7]. Therefore, vibration signal analysis method is one of effective methods to monitor the condition of transformer windings and core, it is a complementary technique to FRA or LRM having the advantage that it can be used for on-line monitoring and, thus, catastrophic failures can be avoided between successive maintenance outages.
In recent years, much research has been devoted to the vibration signal analysis method for monitoring power transformer [7-17]. In [7-10], different vibration models have been developed to calculate tank vibrations, taking into account transformer operating conditions, such as on-load current, applied voltage, temperature, and etc. There are also many measurements taken on the test transformer in laboratory or on the power transformer in manufactory [11-17], and some tank vibration characteristics were presented, such as the relationship between the vibration amplitude and load current. In [14], it is presented that the acquired vibrations must be identified and related to the state change of the monitored transformer by means of comparisons either with a similar new transformer or the averaged values of a set of transformers of similar type and age. But this conclusion has no data supporting. Until now, only [18, 19] presents some vibration data measured on the running transformer in the field, but in-depth study has not been done, such as comparison of vibration signals for different type of transformer, comparison of vibrations at different positions on the transformer tank. Therefore, it is necessary to study the transformer′ oil-tank surface vibration characteristics in the field, which can guide the application of vibration signal analysis method.
In this paper, based on the multi-channels vibration measurement system, the tank vibrations of some running power transformers in the field are measured, the influence of transformer type and sensor position to the vibration signals are analyzed deeply. Furthermore, the transformer tank vibration characteristics is applied to diagnose a transformer which has suffered three-phase short-circuit.
Measurement system
The multi-channels vibration measurement system developed for the running transformer is shown in Fig.1. Each of these vibration accelerative sensors has a sensitivity of 100mv/g, its scope is 50g (g is acceleration of gravity) as well as the frequency response within 0.4~10kHz range. The function of charge amplifier is to transform the charge signals exported by the vibration sensors to voltage signals and magnify it synchronously. The A/D card with USB ports is chosen to convert the analogy voltage signals to digital signals with a resolution of 12 bit, maximum sampling frequency is of 200 kHz. Then the digital vibration signals are exported and processed by the notebook computer (NB).
The recommended sensor positions are shown in Fig.2 [17]. Usually 12 points are used, 6 at high voltage bushing side of the transformer tank and 6 at low voltage bushing one (further HV and LV side, respectively), approximately equally distant from monitored elements. The simultaneous installation of all sensors is not necessary; even one sensor can be used, being sequentially installed on all points. But in this paper, vibration signals of 12 points are acquired synchronously. Temporary sensor installation is easily achieved through magnetic fixation. Points of sensor installation have not been chosen near manholes, pipelines or stiffening ribs. To permit repetitive sensor installation just at the same positions, they can be marked on the tank surface with paint. In [17], it was recommended that the permissible error in the position of the sensor is of 15-30cm, however, there has no vibration data measured in the field for supporting such recommendation, which is worthy of further study.
Fig.3 shows the on-scene picture of multi-channels vibration measurement system which is used to measure the vibration signal of transformer tank in the field. In the dotted circle, it is one of vibration sensors installed on the tank through magnetic fixation, and its amplified image is shown in the real-line circle. Other instruments shown in Fig.3, such as charge amplifier, A/D sampling card and notebook computer, are also illustrated via the dotted arrows.
Transformer Vibration signal measurement and analysis
A. Same position for the different transformer
1) Different type For different types of transformers, the vibration signals measured at the same positions of oil-tank surface are shown in Fig.4 (a) and Fig.4 (b). The transformer type is SSZ9-M-50MVA/110kV and SFZ-20MVA/110kV respectively.
Fig.4 shows that to the different types of transformers, the vibration signals measured at the same surface positions present different characteristics. The main vibration frequency of SSZ9-M-50MVA/110kV transformer is of 200Hz, however, SFZ-20MVA/110kV transformer′ is of 300Hz. Furthermore, for the vibration amplitude of each frequency, the difference of two types is also very obvious. The nonlinearity of core magnetostriction leads to the existence of high order harmonic. But why the magnitude of 200Hz or 300 Hz is the largest? The reason is that the core has the primary natural vibration frequency of about 200Hz or 300Hz. With the excitation of core magnetostriction, resonance takes place. For different types of transformers, the cores are clamped with different pressure. Therefore, their primary natural vibration frequency is different, which leads to above measurement results. It also means that the vibration signals measured on different types of transformers’ tank surface are not comparable, even though which are acquired at the same position.
2) Same type The vibration signals on the oil-tank surface of two same types of transformers (Type: SFZ-240MVA/345kV, it is called as 1# and 2# transformer respectively) are measured and recorded. When two transformers’ on-load current is equal, the frequency spectrums of vibration signals are shown in Fig.5. Fig.5 shows that spectrum characteristics of two same types of transformers are almost similar. However, at the main vibration frequency (300 Hz), the vibration magnitude of 1# and 2# transformer is 11.4mV and 12.7mV respectively, that is to say that 2# transformer’s vibration magnitude is greater than 1# transformer’ about 10.2%. Furthermore, at the other frequency, the vibration magnitude of 2# transformer is slightly greater than that of 1# transformer. The reason leading to above phenomenon is that 1# and 2# transformer’s tap position is on -2.5% and 2.5% respectively when vibration measurement is taken on. In [15], it has been presented that the vibration magnitude of each frequency component is almost proportional to square of open-circuit voltage. Such oil tank vibration characteristics acquired in this paper conform to results in [15]. If two transformers′ vibration signals are normalized according to square of applied voltage, not only their spectrum characteristics are similar, but also their vibration magnitude is almost equal. For example, at the primary frequency (100Hz), the vibration magnitude of 1# and 2# transformer is 1.89mV and 2.14mV respectively. The 2# transformer’s vibration magnitude is 1.94mV when it is normalized by square of 1.05 (namely, (1+2.5%)/(1-2.5%)), which is almost equal to that of 1# transformer (1.89mV).
When 1# transformer’s tap position (-2.5%) is as same as 2# transformer’, the vibration signals of 1# and 2# transformer’ oil-tank surface are measured and recorded at current of 310A and 350A respectively, the frequency spectrums of vibration signals are shown in Fig.6.
Fig.6 shows that spectrum characteristics of two same types of transformers are almost similar at different current. However, at the fundamental frequency (100Hz), the vibration magnitude of 1# and 2# transformer is 1.89mV and 2.45mV respectively, that is to say that 2# transformer’s vibration magnitude is greater than 1# transformer’ about 29.6%. The 2# transformer’s vibration magnitude is 1.92mV when it is normalized by square of 1.13 (namely, 350/310), which is almost equal to that of 1# transformer (1.89mV). The reason leading to above phenomenon can be explained as follows.
• The fundamental frequency component consists of vibration signals of the windings and that of the core. The high frequency vibration of tank surface is mainly caused by magnetostriction of core and independent of windings vibration [15].
• The core vibration is mainly dependent on the voltage applied to the primary winding which is independent of the load [15].
• Because 1# transformer’s tap position is as same as that of 2# transformer, then the vibration signal’ harmonic components of two transformers are almost equal. Furthermore, the fundamental frequency component caused by core vibration should be equal.
• The windings’ fundamental frequency vibration signal was proportional to the square of the loading current [15]. Therefore, when two transformers′ vibration magnitudes of fundamental frequency are normalized by square of loading current, they will be almost equal.
The above results mean that when there are no historical data, same types of transformer’ vibration signals normalized according to square of applied voltage and loading current (only for fundamental frequency component) can be compared with each other.
B. Different position for the same transformer
1) Top and bottom position at side of same phase From Fig.2 it can be seen that for the vibration sensors installed at the top and bottom of the same phase′s oil tank surface, such as position “1” and “2”, position “3” and “4”, they are at the symmetrical position. For a transformer, the spectrums of vibration signals measured at position “1” and “2” are shown in Fig.7.
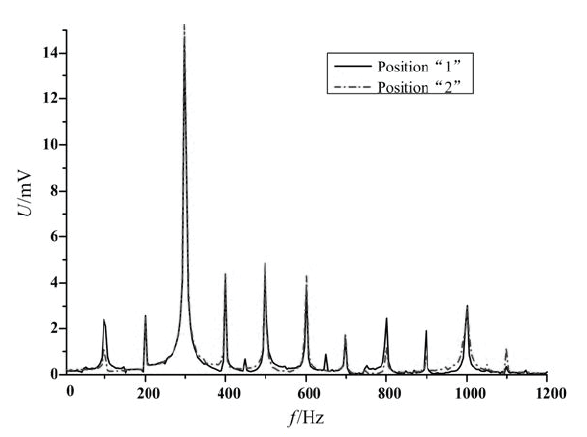
Fig.7 shows that for the vibration signals at top-bottom symmetrical position, their spectrums are almost similar. However, there exists obvious difference at some frequency, such as 100Hz, 300Hz, 600Hz, and etc. This phenomenon can be explained as follows.
• The main sources of tank vibration are forces appearing in the winding and the core.
• Winding vibrations are due to electro-dynamic forces caused by the interaction of the current in a winding with leakage flux. These forces are proportional to the current squared. Obviously, the leakage flux of the winding bottom position is almost equal to its top position′s. On the other hand, the current flowing through the winding is independent of position. Thus, for the top and bottom position, the winding vibrations are similar.
• The core vibration caused by magnetostriction forces is proportional to squared voltage [15]. Thus, for the top and bottom position, the core vibrations are similar.
• Core and winding vibrations interact and transmit through the oil and the transformer supporting elements to the tank. For the top-bottom symmetrical positions, the oil tank structures are different, for example, at the top of tank there are HV, LV bushings and oil reservoir, but the bottom of tank is fixed on the ground, which means that the tank surfaces at the top and bottom position have different nature vibration characteristic.
• Therefore, although the vibrations of core and winding are almost similar, the vibration spectrums at top-bottom symmetrical position still have some differences.
The above results and analysis mean that for the top-bottom symmetrical position shown in Fig.2, such as position “1” and “2”, position “3” and “4”, the measured vibration signals can not be compared with each other.
2) HV and LV side In this case, the vibration signals are measured at two sides of the tank: at high voltage bushing side and at low voltage bushing one. From Fig.2 it can be seen that these positions are left-right symmetrical. For a transformer, the spectrums of vibration signals measured at position “5” and “7” are shown in Fig.8, which presents that the vibration signals’ magnitudes of position “5” and “7” are equal at almost all frequencies, except at frequency of 200Hz, 300Hz and 700Hz. Such results also demonstrate that vibration signals of HV and LV side can not be used to estimate the condition of windings and core by comparing with each other.
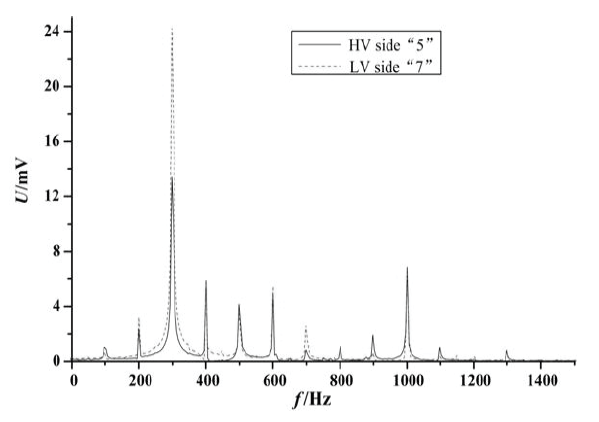
The analysis about difference of vibration characteristics at the top-bottom symmetrical position can explain the phenomenon shown in Fig.8. The structures of HV and LV side oil tank are different, especially, the HV and LV bushing have different structural dimension, which makes the HV and LV side tank have different natural vibration characteristics. Thus, although activated by the same vibration source (winding and core vibration), the left-right symmetrical positions at the tank of HV and LV side have different vibration response.
3) The same position at side of different phase For a transformer, the spectrums of vibration signals measured at position “1”, “3” and “5” are shown in Fig.9.
Fig.9 shows that at position “1” and “5”, the vibration signals measured on the oil tank surface present same characteristics, which are different from that measured at position “3”. The above measurement results are easy to explain. Each phase’s tank vibration will be influenced by that of the other two phases. For example, the position “1” will be influenced by position “3” and “5”. On the other hand, the influence effect is related to the distance between each other. The position “1” and “5” are symmetrical, that is to say, the structure of tank, vibration source and influencing of other phases are both same at these two positions, which leads to their same vibration characteristics. However, the position “3” is at the middle of oil tank, and the vibration signal measured at this position would be influenced by the other two phase’s winding and core vibrations, moreover, the distances from position “3” to position “1” and “5” are equal, which leads to its vibration characteristics be different from the sideward tank’s.
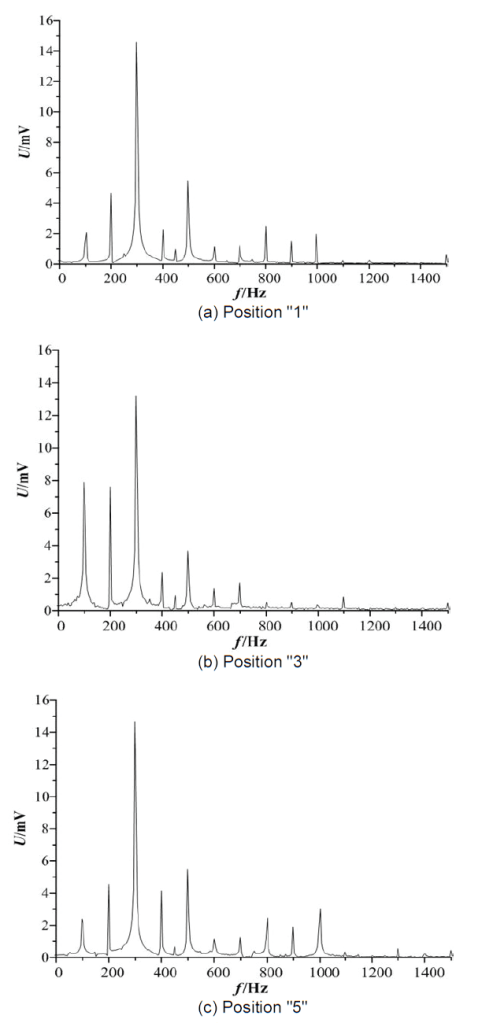
The above measurement results means that the vibration signals measured at the same position on oil-tank of phase “A” (or “a” ) and “C” ( or “c” ) have same characteristics, therefore, each phase’s windings and core condition can be diagnosed by comparing their vibration signals. However, the above method can not be used to vibration signals measured on tank surface of phase “B” (or “b”).
4) Around the measured position When the vibration signals on the transformer oil tank are measured in the field, a sensor attachment position is regarded as the referred point, and then the installing position of this sensor is moved up, down, left and right 5cm and 10cm respectively. The vibration signals at the original position and changed position after sensor is moved are all recorded. When sensor is at the original position and position is moved up 5cm, the measured vibration signals′ spectrums are shown in Fig.10.
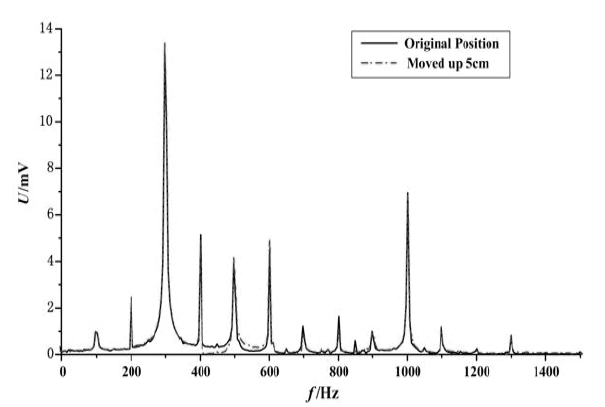
From Fig.10 it can be seen that when the attachment position of sensor is moved up 5cm, the vibration signal has slightly change compared with the original position’. Only the vibration magnitude at the main frequency increases from 12.9mV to 13.4mv, which enlarges about 3.9%. According to [5] and [7], when the relative value of the transformer vibration magnitude changed above 20%, the windings and core were deemed having serious fault and the transformer must be out of running. This means that the difference of 3.9% is within the acceptable scope and will not lead to wrong discrimination.
When the sensor is moved down, left and right 5cm respectively, the same result can be drawn as the above, which is that the vibration signal measured at the new position has slightly difference compared with the original position ‘.
When the sensor is moved up 10cm from its original position, the vibration signals are shown in Fig.11.
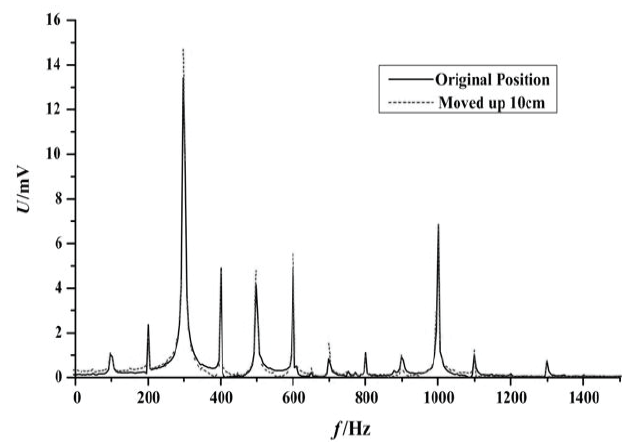
From Fig.11 it can be seen when the sensor is moved up 10cm, the vibration signal measured at the new position has little change at some frequencies, such as 100Hz, 200Hz and 400Hz. However, at other frequencies there is obvious difference compared with that of the original vibration signal, such as at the main vibration frequency (300Hz), the vibration magnitude enlarges from 12.9mV to 14.8mV, and increases about 14.7%. Furthermore, such great change is caused by the displacing of vibration sensor’s attachment position but not the fault of windings or core. That is to say, at this condition, any decisions can not be made about the compression of windings or core.
When the sensor is moved down, left and right 10cm respectively, the same result can be drawn as the above, which is that the vibration signal measured at the new position has great difference compared with that of the original position.
Also, in the field the vibration signals were measured when the attachment position of sensor were changed at the range of 6~9cm. Compared with the original vibration signal, the signal measured at the new position demonstrate that farther the distant of sensor are moved, greater the vibration signal changes.
With respect to the above results, it was recommended that the permissible error in the position of the sensor is within 5cm, which is different from the conclusion drawn in [17].
Application of vibration characteristics
In the HeXing substation, Hangzhou power bureau, China, 1# transformer suffered three-phase short-circuit at Nov. 2009, the short-circuit fault lasted for about 90s. The transformer type is OSFPSZ9-150MVA/220kV. Then, the vibration signals were acquired by the multi-channel vibration measurement system. According to the Part III, B(3), the vibration signals measured at the same position on oil-tank of phase “A” (or “a” ) and “C” ( or “c” ) have the same characteristics and they can be used to diagnose each phase’s windings and core condition by comparing with each other. The results of the measurement at position “7” and “11” are shown in Fig. 12.
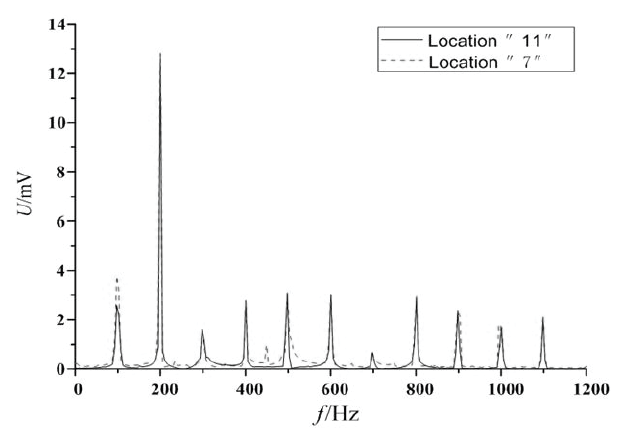
From Fig.12 it can be seen that spectrum characteristics of vibration signals at position “7” and “11” are almost similar. However, at the fundamental frequency (100 Hz), the vibration magnitude of position “7” and “11” is 3.78mV and 2.58mV respectively, which means that the vibration magnitude of position “7” is greater than that of position “11” about 46.5%.
According to [14], [17] and [19], the fundamental frequency component consists of vibration signals of the windings and that of the core, and the high frequency vibration of tank surface is mainly caused by magnetostriction of core and independent of windings vibration. Therefore, the high frequency vibration measured on the tank surface can be used to diagnose the condition of core directly. In this case, for the harmonics with the frequency of 200Hz and above, the magnitudes of vibration signals at position “7” and “11” are almost equal, which means the condition of 1# transformer core is well. Thus, it can be concluded that the winding at position “7” has occurred serious fault which leads to the great increase of the magnitude of fundamental frequency vibration.
In the same substation, there is a 2# transformer, whose type and age are as the same as that of 1# transformer. In order to verify the above conclusion, we also measured the vibration signal at the same position as 1# transformer’ (“7”). Two transformer’ load current and tap changer position are also same. The result is shown in Fig.13.
According to Part III, A(2), same types of transformers vibration signals normalized according to square of applied voltage and loading current can be compared with each other. From Fig.13 it can be seen that spectrum characteristics of 2# transformer’ vibration signal at position “7” is as the same as that of 1# transformer at position “11”. For 2# transformer, the fundamental frequency component of vibration signal at position “7” is 2.6mV, which is almost equal to that of 1# transformer at position “11”. In the other word, at the same position (“7”), the fundamental frequency component of 1# transformer is larger than that of 2# transformer about 46.5%. Thus, it can be concluded that 1# transformer’s windings at position “7” has occurred serious fault, which further verifies above diagnostic result. Therefore, it is decided that 1# transformer must be shut down and overhaul must be performed in the manufactory.
Based on above diagnostic result deduced from vibration signal analysis method, the transformer is isolated from the system and transported to the transformer manufactory, where the overhaul of windlass cover is performed, the visual inspection results are shown in Fig.14.
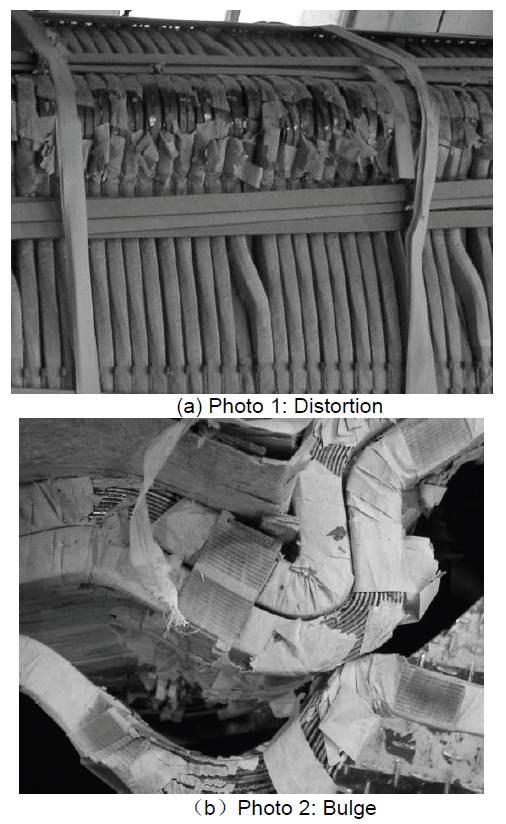
From Fig.14 it can be seen there is a severe deformation in the upper disks of low voltage windings of phase “c”. The results verify above diagnostic result. In the other word, the transformer tank vibration characteristics acquired in the field can be used to monitor the condition of transformer.
Conclusions
Vibration signal analysis method is one of effective methods to monitor the condition of transformer windings and core, which is a complementary technique to FRA or LRM and has the advantage of on-line monitoring. However, until now, in-depth study has not been done on transformer tank vibration characteristics in the field, which limits its effective application. In this paper, the vibration signals on the oil tank surface of power transformer are measured in the field, and the vibration characteristics of transformer tank are studied, which is outlined as follows.
1) The vibration signals on the oil-tank surface of different types of transformers have great difference and they can not be compared with each other. On the other hand, the same types of transformers’ oil-tank vibration signals have almost same characteristics, which mean that if there are no historical data, diagnosis can be carried out by comparing same types of transformers’ vibration signals at the same position. It must be stated that when comparison is made, vibration signals should be normalized according to square of applied voltage and loading current (only for fundamental frequency component).
2) For the vibration signals measured on the oil-tank surface of a transformer, at the top-bottom symmetric positions of same phase and the left-right symmetric positions of HV and LV side, the vibration characteristics have obvious difference at some frequencies. Therefore, the vibration signals measured at these positions can not be compared with each other to diagnose the condition of transformer windings and core.
3) The tank surface vibration signals at the same position of phase “A” (or “a”) and “C” (or “c”) have similar characteristics, and they can be used to diagnose each phase’s windings and core condition by comparing with each other. However, the above method can not be used to vibration signals measured at the same position of phase “B” (or “b”), whose characteristics are different from that of phase “A” (or “a”) and “C” (or “c”).
4) When vibration signals of transformer oil-tank surface are measured, the attachment position of each sensor should be marked on the tank surface with paint, which is the reference position in the next measurement. It is recommended that the permissible error in the position of the sensor is within 5cm, which is different from the conclusion drawn in [17].
At last, the transformer tank vibration characteristics presented in this paper was applied to diagnose a transformer suffered three-phase short circuit, and it was deduced that windings at position “7” has occurred serious fault. The overhaul of windlass cover verified the validity of diagnostic result. The conclusions presented in this paper will guide the application of vibration signal analysis method in the field.
Acknowledgement: This paper is supported by the National Natural Science Foundation of China (Grant No.50907046).
REFERENCES
[1] V. Sokolov, Z. Berler, V. Rashkes, “Effective Methods of Assessment of Insulation System Conditions in Power Transformers”, in Electrical Insulation Conference EIC/EMCW-99, Cincinnati, OH, October 26-28, 1999.
[2] G. V. Antipov, V. Y. Gorshunov, V. N. Malinovskii, A. P. Sklyarov, and N. N. Khublarov, “System for diagnosing the mechanical condition of the windings of high-power double-wound transformers”, Meas. Techn., vol. 39, no. 9, pp. 93–97, 1996.
[3] J. A. Lapworth and T. J. Noonan, “Mechanical condition assessment of power transformers using frequency response analysis”, presented at Proc. Annu. Int. Conf. Doble Clients.
[4] A. Babare, F. Cannata, G. Caprio, S. Sacchetti, and G. Zafferrani, “Ennel-diagnossis of on- and off-line large transformers”, in Proc. Cigré Symp., Berlin, Germany, pp. 110–04, 1993.
[5] T. Leibfried and K. Feser, “Monitoring of power transformers using the transfer function method”, IEEE Transactions on Power Delivery, vol. 14, no. 4, pp. 1333–1339, Oct. 1999.
[6] S. Birlasekaran and F. Fetherston, “Off/On-Line FRA condition monitoring technique for power transformer”, IEEE Power Eng. Rev., vol. 19, pp. 54–56, Aug. 1999.
[7] J.C. Lavalle, “Failure Detection in Transformer Using Vibrational Analysis”, MS dissertation, MIT, Cambridge, MA, USA, 1986.
[8] S.H Lee, “Modeling of Winding Vibration Amplitude for Diagnosis of Power Transformer”, MS dissertation, Soongsil University, 1994.
[9] C. Booth, J. R. McDonald, and R. Aresi, “The use of neural networks for the estimation and classification of vibration behavior in power transformers,” in Proc. Amer. Power Conf., 1995, pp. 1132–1135.
[10] Belén García, Juan Carlos Burgos, and Ángel Matías Alonso, “Transformer Tank Vibration Modeling as a Method of Detecting Winding Deformations—Part I: Theoretical Foundation”, IEEE Transactions on Power Delivery, Vol.21, No.1, pp. 157-163, 2006.
[11] M.A Sanz-Bobi, A. Garcia-Cerrada et al, “Experiences Learned from the On-line Internal Monitoring of the Behavior of a Transformer”, in Electric Machines and Drives Conference Record, 1997. IEEE International, TC3/11.1-TC3/11.3, 1997.
[12] Masato Mizokami, Masao Yabumoto, Yasuo Okazaki, “Vibration Analysis of a 3-Phase Model Transformer Core”, Electrical Engineering in Japan, Vol.119, No.1, pp. 1-8, 1997.
[13] Chan-Soo Chung, Chi-Hyoung You, and et al, “Fault Discrimination of Power Transformers Using Vibration Signal Analysis”, in Integrating Dynamics Condition Monitoring and Controlling Conference 21st Century, Rotterdam, Holand, pp.523-529, 1999.
[14] Cipriano Bartoletti, Maurizio Desiderio, Danilo Di Carlo, et at, “Vibro-Acoustic Techniques to Diagnose Power Transformers”, IEEE Transactions on Power Delivery, Vol.19, No.1, pp. 221-229, 2004.
[15] Ji Shengchang, Cheng Jin, Li Yanming, “Research on Vibration Characteristics of Windings and Core of Oil –filled Transformer”, Journal of Xi’an Jiaotong University,Vol.39, No.6, pp. 616~619, 2005
[16] Belén García, Juan Carlos Burgos, and Ángel Matías Alonso, “Transformer Tank Vibration Modeling as a Method of Detecting Winding Deformations—Part II: Experimental Verification “, IEEE Transactions on Power Delivery, Vol.21, No.1, pp. 164-169, 2006.
[17] Ji Shengchang, Luo Yongfen, Li Yanming, “Research on Extraction Technique of Transformer Core Fundamental Frequency Vibration Based on OLCM”, IEEE Transactions on Power Delivery, Vol.21, No.1, pp. 1981-1988, 2006
[18] Mechefske CK, “Correlating Power Transformer Tank Vibration to Winding Looseness”, Insight—J. Non Destruct. Test. Cond. Monitor., Vol. 37, no. 8, pp. 599-604, 1995
[19] Z. Berler, A. Golubev, V. Rusov, and et al, “Vibro-Acoustic Method of Transformer Clamping Pressure Monitoring”, in Conference Record of the 2000 IEEE International Symposium on Electrical Insulation, Anaheim, CA USA, April 2-5, pp.263~266, 2000.
Authors: Ji Shengchang is with Xianning west road 28#, State Key Laboratory of Electrical Insulation and Power Equipment, Xi′an Jiaotong University, Xi′an, ShannXi, Province, Republic of China. (email: jsc@mail.xjtu.edu.cn) Li Yanming is with Xianning west road 28#, Department of electric engineering, Xi′an Jiaotong University, Xi′an, ShannXi, Province, Republic of China. (email: ymli@mail.xjtu.edu.cn)
Source & Publisher Item Identifier: PRZEGLĄD ELEKTROTECHNICZNY (Electrical Review), ISSN 0033-2097, R. 87 NR 2/2011
