Published by Electrotek Concepts, Inc., PQSoft Case Study: Harmonic Measurement Data Evaluation, Document ID: PQS1001, Date: March 15, 2010.
Abstract: Utility power system harmonic problems can often be solved using a comprehensive approach including site surveys, harmonic measurements, and computer simulations.
This case study presents a harmonic data analysis for a utility 12.47kV substation monitoring location for a two-week period. The analysis included trends of the rms voltage and current and statistical summaries of the voltage and current distortion values. The results of the analysis showed that the harmonic distortion levels were below the IEEE Std. 519 voltage limits.
INTRODUCTION
A harmonic measurement analysis case study was completed for a 12.47kV utility substation bus. The two-week monitoring period was from May 17, 2009 thru June 1, 2009. The power quality instrument used to complete the harmonic measurements was the Dranetz-BMI Encore SeriesTM. The instrument samples voltage at 256 points-per-cycle, current at 128 point-per-cycle, and follows the IEC 61000-4-3 method for characterizing harmonic measurement data. This involves analysis of continuous 200msec samples and storing aggregated 10-minute minimum, average, and maximum trend data. The measurement and statistical analysis was completed using the PQView® program (www.pqview.com).
MEASUREMENT RESULTS
Figure 1 shows the measured rms voltage regulation trend on the 12.47kV substation bus during the two-week period. Various pole-mounted distribution feeder capacitor banks (e.g., 600 kVAr) are switched on-and-off each day using time clock controls in an attempt to maintain a relatively constant voltage. Statistical analysis of the measurement data yields a minimum rms voltage of 12.27kV, an average voltage of 13.02kV, and a maximum voltage of 13.56kV. In addition, the CP95 value was 13.39kV. CP95 refers to the cumulative probability, 95th percentile of a value.
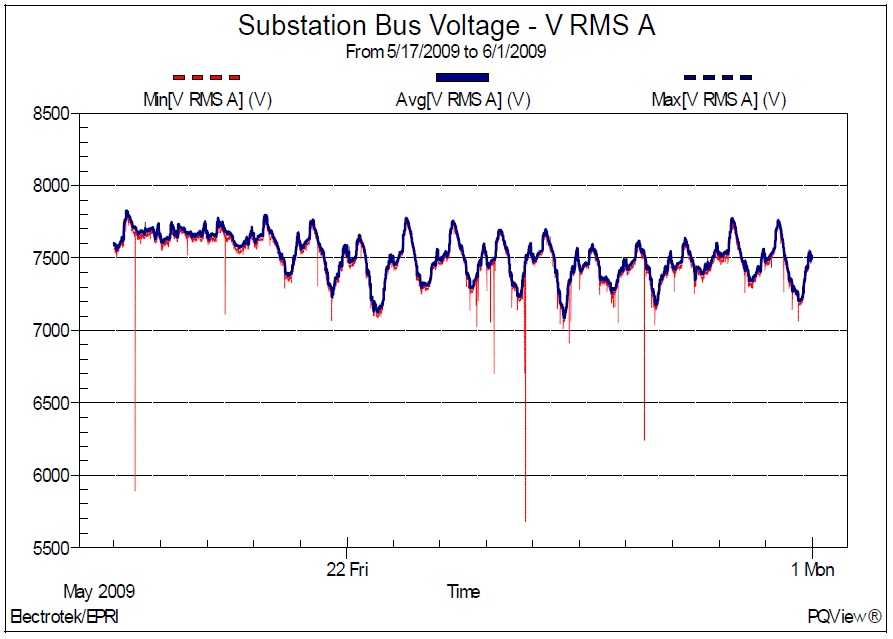
Figure 2 shows the corresponding measured voltage distortion trend and histogram during the two-week period. Statistical analysis of the measurement data yields a minimum distortion of 1.13%, an average distortion of 1.73%, and a maximum distortion 2.83%. The CP95 value was 2.30%.
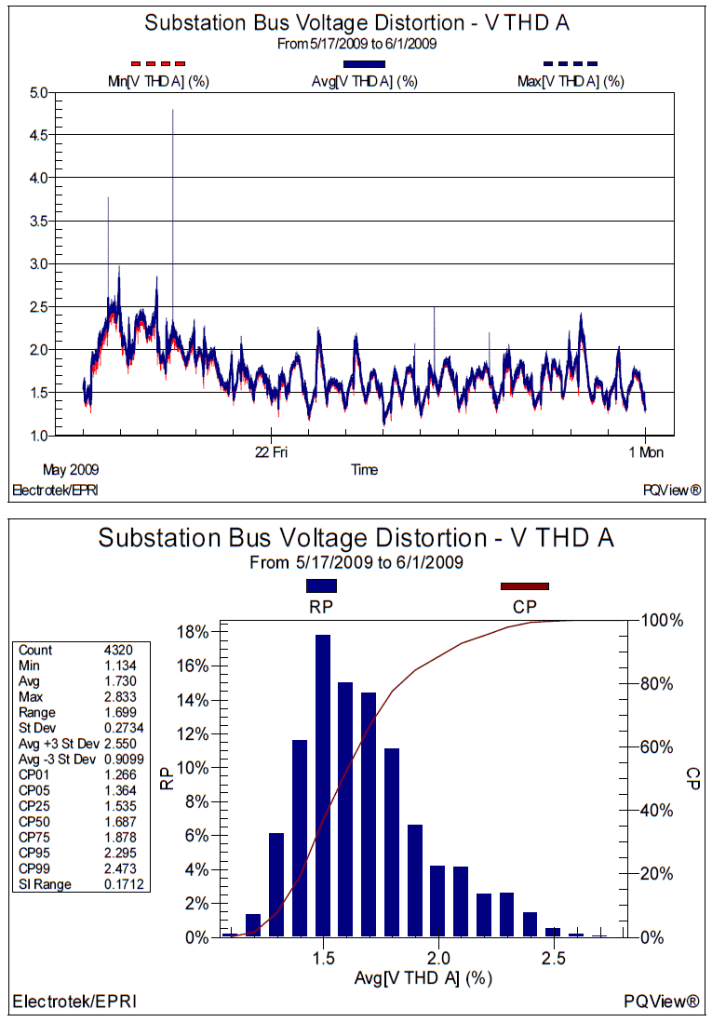
Figure 3 shows the corresponding rms current trend. Statistical analysis yields a minimum current of 378A, an average current of 690A, and a maximum current of 1165A. CP95 value was 1014A.
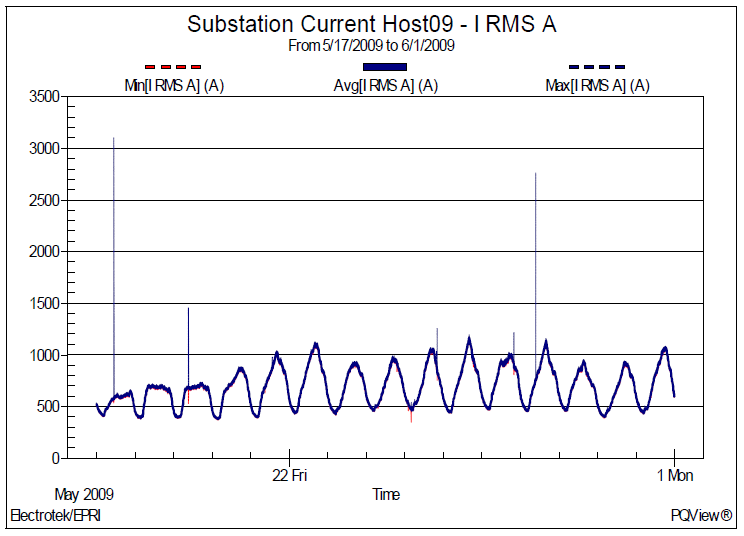
Figure 4 shows the current distortion trend. Statistical analysis yields a minimum distortion of 4.39%, an average distortion of 7.89%, and a maximum distortion 14.24%. CP95 value was 11.73%.
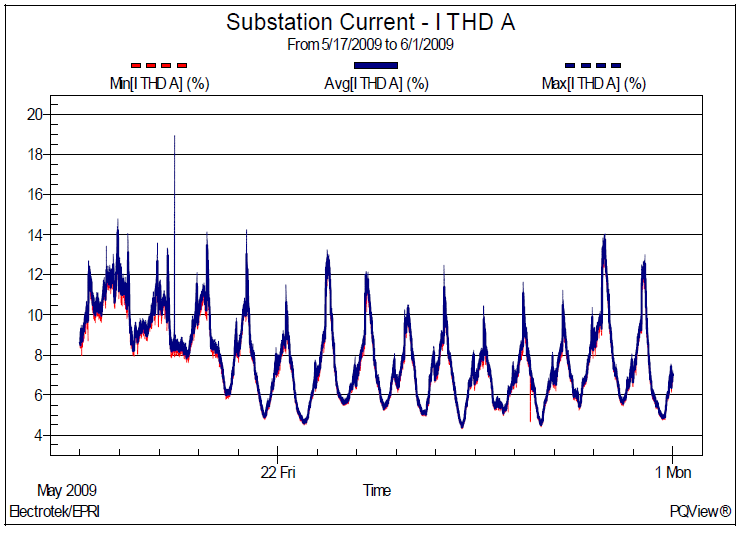
Figure 5 shows the corresponding statistical summary of total harmonic voltage distortion and number of individual harmonics. The analysis shows that the predominate harmonics for the measured substation bus voltages were the 3rd, 5th, 7th, and 9th. The measured values were below the IEEE Std. 519 voltage distortion limits, which are 5% THD and 3% for any individual harmonic.
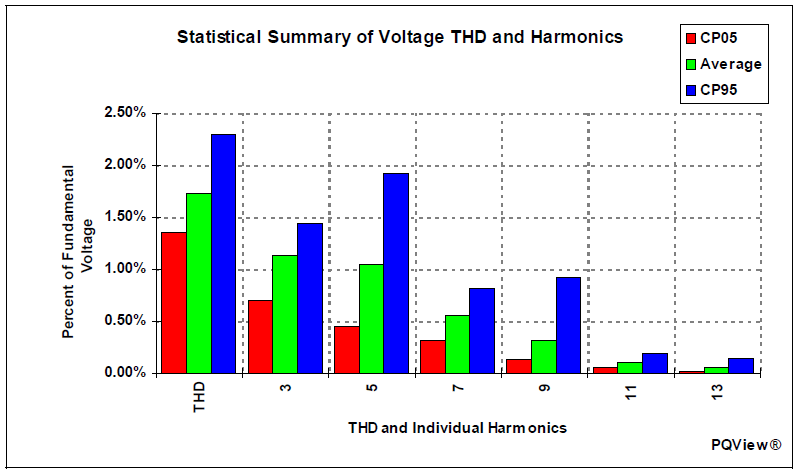
Figure 6 shows the corresponding statistical summary of total harmonic current distortion and number of individual harmonics. The base current for the statistics summary was 1082A.
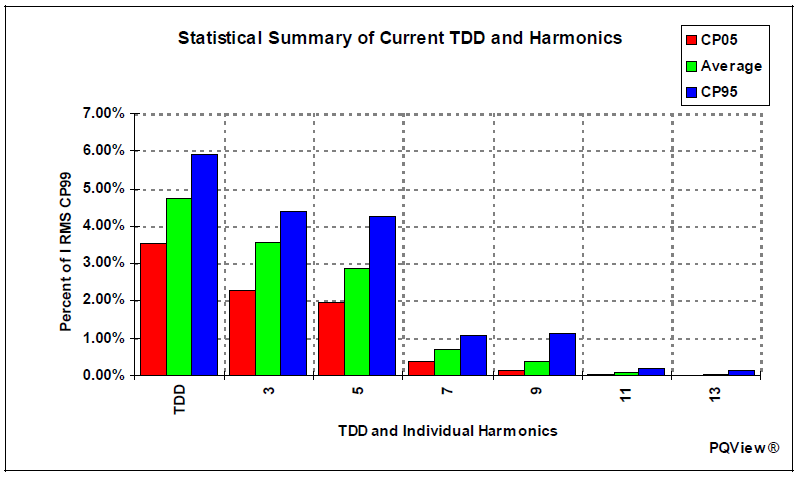
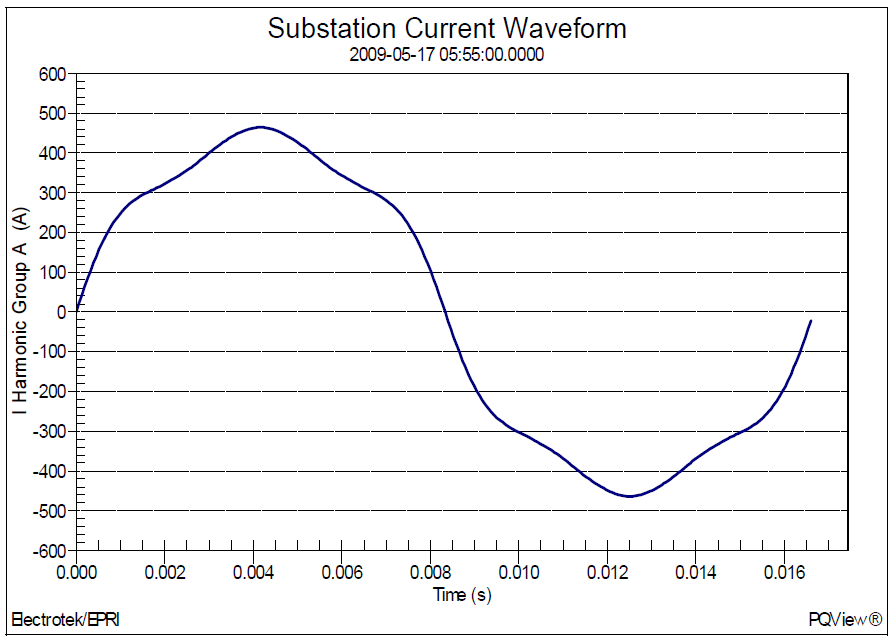
Figure 7 shows one sample calculated harmonic current waveform from the measured harmonic spectrum data. The waveform was created using an inverse DFT with 256 points per cycle. The fundamental frequency current value was 469A, the rms current value was 472A, and the current distortion was 11.8%.
SUMMARY
This case study presents a harmonic data analysis for a 12.47kV substation monitoring location for a two-week period. The analysis included trends of the rms voltage and current and statistical summaries of the voltage and current distortion values. The results of the analysis showed that the harmonic distortion levels were below the IEEE Std. 519 voltage limits.
REFERENCES
1. Power System Harmonics, IEEE Tutorial Course, 84 EH0221-2-PWR, 1984.
2. IEEE Recommended Practice for Monitoring Electric Power Quality,” IEEE Std. 1159-1995, IEEE, October 1995, ISBN: 1-55937-549-3.
3. IEEE Recommended Practices and Requirements for Harmonic Control in Electrical Power Systems, IEEE Std. 519-1992, IEEE, ISBN: 1-5593-7239-7.
RELATED STANDARDS
IEEE Std. 519-1992
IEEE Std. 1159-1995
GLOSSARY AND ACRONYMS
ASD: Adjustable-Speed Drive
CF: Crest Factor
DPF: Displacement Power Factor
PF: Power Factor
PWM: Pulse Width Modulation
THD: Total Harmonic Distortion
TPF: True Power Factor
