Published by Electrotek Concepts, Inc., PQSoft Case Study: Distribution Substation Capacitor Bank Evaluation, Document ID: PQS1014, Date: October 15, 2010.
Abstract: This case study presents a utility distribution substation capacitor bank harmonic analysis. The simulations were completed using the SuperHarm program. The investigation included frequency response and harmonic distortion simulations for a utility substation that included a step-down transformer and a number of distribution feeders with a significant number of small capacitor banks and several industrial customers.
INTRODUCTION
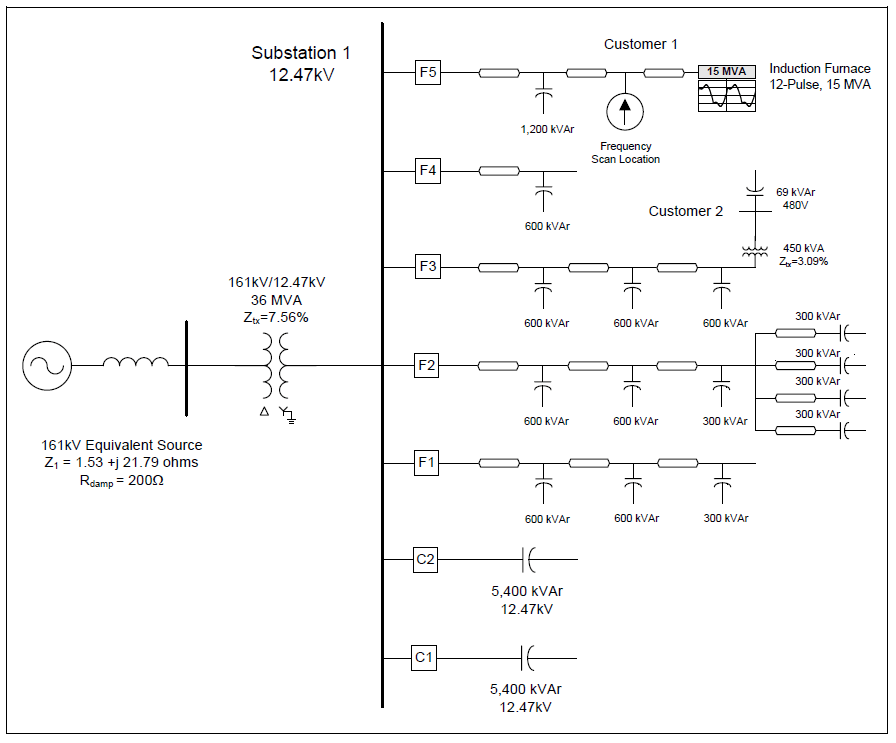
A utility distribution substation capacitor bank harmonic analysis case study was completed for the system shown in Figure 1. The 12.47 kV utility substation included a 36 MVA, 161 kV/12.47 kV step-down transformer and several distribution feeders that included a significant number of small capacitor banks and several industrial customers.
There were two 5,400 kVAr, 12.47 kV capacitor banks at the substation bus, a 1,200 kVAr capacitor bank at one customer location, and a number of 300 kVAr and 600 kVAr capacitor banks on four distribution feeders. Each distribution feeder also included a number of distributed harmonic producing nonlinear loads representing a variety of customer facilities.
The customer loads included a 450 kVA step-down transformer supplying a 69 kVAr, 480 V power factor correction capacitor bank and a 15 MVA, 12-pulse induction furnace. The harmonic characteristics of the various customer nonlinear loads were determined from field measurements at the meter point for each customer. The case study was completed using the SuperHarm® program. The accuracy of the simulation model was verified using three-phase and single-line-to-ground fault currents and other steady-state quantities, such as steady-state voltage rise.
SIMULATION RESULTS
The utility was experiencing blown fuses on feeder capacitor banks when the 15 MVA induction furnace was in operation. Capacitor banks that were switched on to improve the voltage regulation for the distribution feeders caused harmonic resonances that caused very high voltage and current distortion levels that also led to the fuse failures.
The configuration of the distribution system capacitor banks included one larger substation capacitor bank that was switched in two steps, one capacitor bank connected at the customer primary, and 14 smaller feeder capacitor banks. The feeder capacitor banks included five that were temperature-controlled, six that were fixed, and three that were fixed, but were de-energized during the winter months. The simulation analysis for the case study included 12 distinct capacitor bank configurations that were investigated.
Fault currents at various points on the distribution system and the voltage rise at 12.47 kV bus with the 5,400 kVAr capacitor banks in-service were used to verify the accuracy of the harmonic simulation model. The steady-state voltage rise at the substation bus for each 5,400 kVAr, 12.47 kV capacitor bank was approximately 1.8%.
Figure 2 shows the harmonic current characteristic for one operating point of the 12-pulse induction furnace. The current had a fundamental frequency value of 650 A, an rms value of 652 A, and a THD value of 3.3%. The highest harmonic current components were the 11th at 2.75% and the 13th at 1.65%. The waveform shown in Figure 2 was created using an inverse DFT with 256 points per cycle.
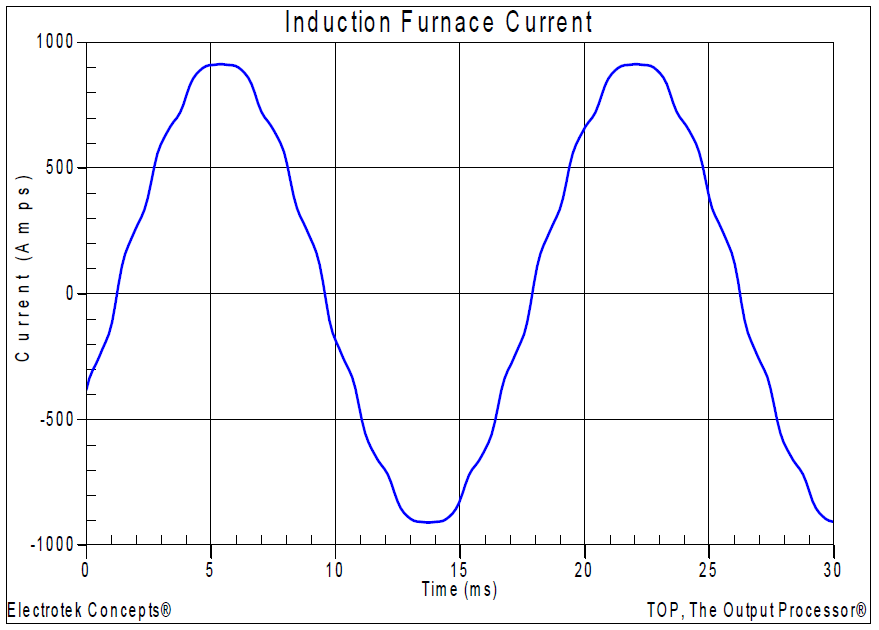
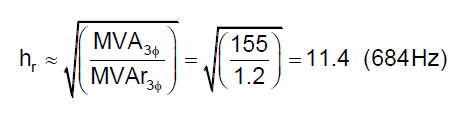
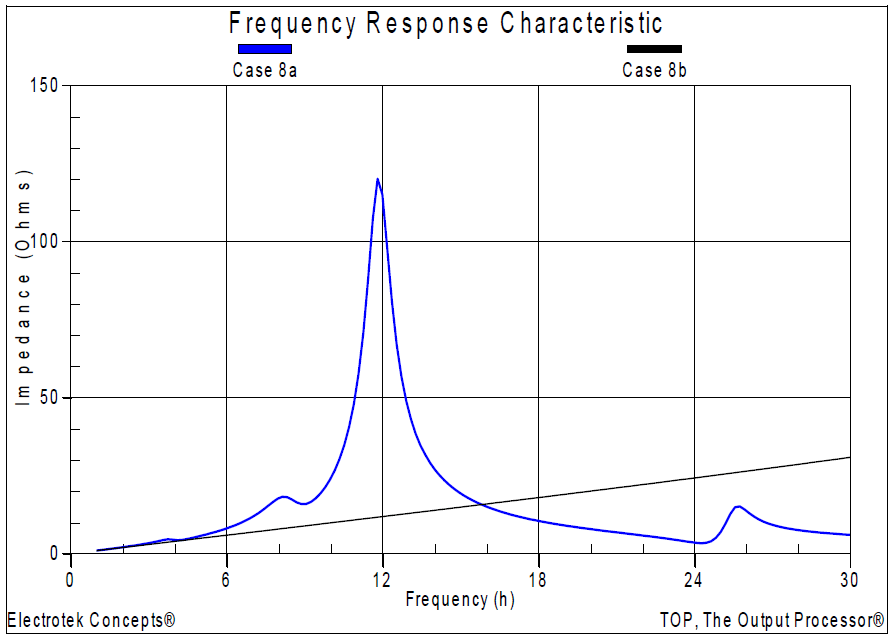
Figure 3 shows the impedance vs. frequency simulation result with the 1,200 kVAr, 12.47 kV feeder capacitor bank in service (Case 8b). The frequency scan was placed at Customer 1. The base-case result with no utility or customer capacitor banks in-service (Case 8a) was also shown on the graph so the two conditions can be easily compared. The simulated parallel resonance due to the addition of the shunt capacitor bank was 708 Hz (11.8th harmonic). A simple expression may be used to validate this result:
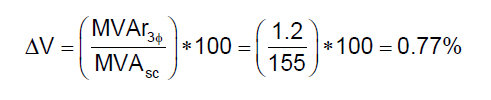
In addition, the simulated steady-state voltage rise with the 1,200 kVAr, 12.47 kV capacitor bank in-service was 0.8%. This value may be validated using the following expression:
where:
hr = parallel resonant frequency (x fundamental)
ΔV = steady-state voltage rise (per-unit)
MVA3ϕ = three-phase short circuit capacity (MVA = √3*12.47 kV*7.17kA≈155MVA)
MVAr3ϕ = three-phase capacitor bank rating (MVAr)
A more thorough investigation of the effect of the various substation and feeder capacitor banks was completed using a batch solution capability that allows multiple data cases to be completed consecutively. A batch identification variable was used to create a number of different operating conditions with the repeated solution of the same date case. Different distinct frequency scan output files were also created for each set of system conditions. This simulation process allowed the implementation of sophisticated techniques to simplify certain analysis procedures.
The batch solution involved 12 different cases, representing three different substation capacitor bank conditions, two winter capacitor conditions, and two temperature-controlled capacitor bank conditions. Figure 4 shows the impedance vs. frequency simulation results for the different operating conditions for the two 5,400 kVAr, 12.47 kV substation capacitor banks. The frequency scan was placed at Customer
The base-case result with no utility or customer capacitor banks in-service was also shown for reference. The simulated parallel harmonic resonant frequency with neither substation capacitor bank in-service was 708 Hz (11.8th harmonic). Addition of the first 5,400 kVAr capacitor bank reduced the resonant frequency to 390 Hz (6.5th harmonic), while the addition of both 5,400 kVAr capacitor banks further reduced the resonant frequency to 312 Hz (5.2nd harmonic).
The magnitude of the simulated impedance at the lower-order harmonics was significantly reduced with the substation capacitor banks in-service. This would suggest that the voltage distortion at the customer and substation buses would indeed be somewhat lower with the substation capacitor banks in-service. The resulting voltage distortion levels will be shown later in the case.
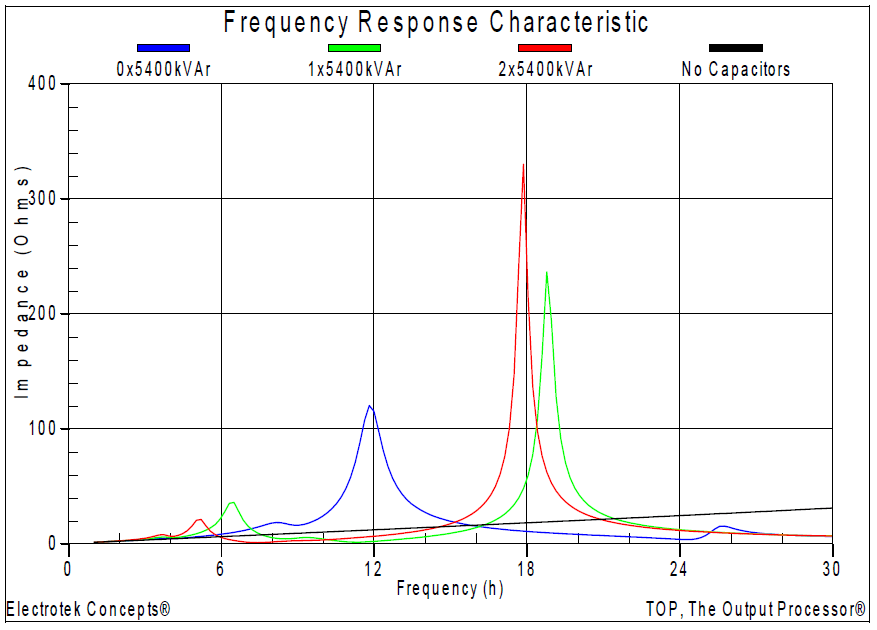
Figure 5, Figure 6, and Figure 7 show the impedance vs. frequency simulation results for various feeder and substation capacitor bank configurations. The base-case result with no utility or customer capacitor banks in-service was also shown for reference. The codes used for the simulation legends included:
“W” Winter Season Feeder Capacitor Banks, Either Off or On (e.g., W Off, W On)
“T” Temperature-Controlled Feeder Capacitor Banks, Either Off or On (e.g., T Off, T On)
Figure 5 shows the simulated frequency response characteristics for the cases with no substation capacitor banks (5,400 kVAr, 12.47 kV) in-service. The most severe resonances were near the 11th and 19th harmonics.
Figure 6 shows the corresponding simulated frequency response characteristics for the cases with one 5,400 kVAr substation capacitor bank in-service. The most severe parallel resonances were near the 19th harmonic.
Figure 7 shows the corresponding simulated frequency response characteristics for the cases with both 5,400 kVAr substation capacitors bank in-service. The most severe parallel resonances are near the 17th harmonic.
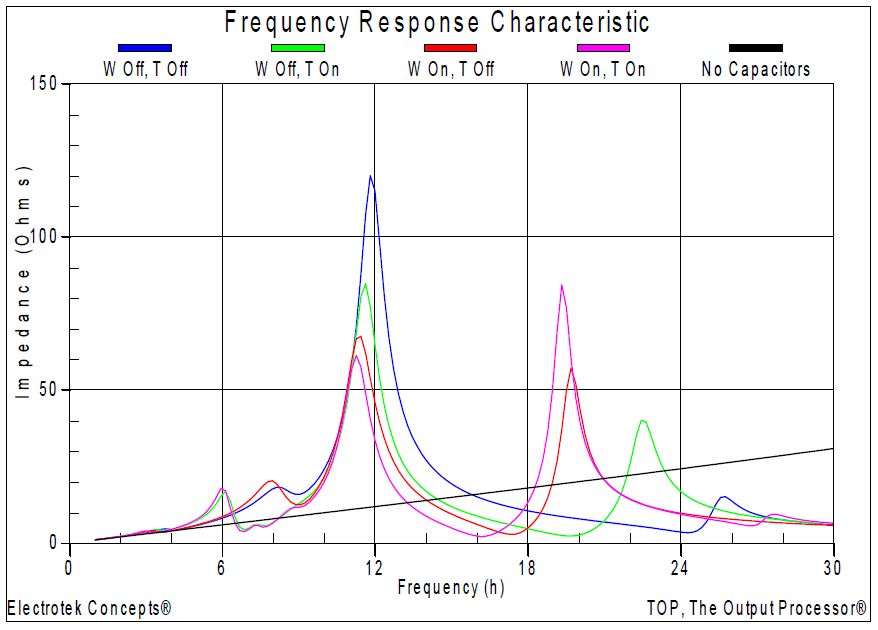
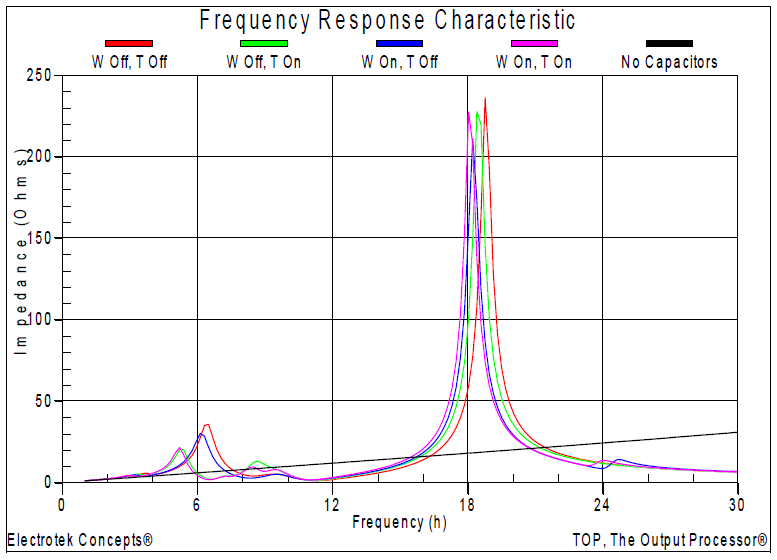

Table 1 summarizes the harmonic distortion simulation results that corresponded with the frequency scans shown in the previous three figures. The table includes the same simulation legend codes, as well as the voltage distortion (VTHD) at the 12.47 kV substation bus and at the 12.47 kV bus at Customer 1. For reference, the voltage distortion values with no utility or customer capacitor banks in-service was 2.25% at the substation bus and 4.13% at the customer bus.
As was illustrated with the previously simulated frequency response characteristics, the worst case harmonic distortion levels were when neither of the 5,400 kVAr substation capacitor banks were in-service. The severe distortion levels for these operating conditions resulted in a number of feeder capacitor bank fuses failing when the induction furnace was operating near capacity.
Distortion cases 8c through 8f corresponded to the frequency response characteristics previously shown in Figure 5. These were the most severe harmonic distortion levels at both the customer and utility substation buses. The high distortion levels were primarily due to the 11th harmonic resonance along with the 11th and 13th harmonic current components created by the 12-pulse induction furnace. Distortion cases 8g through 8j corresponded to the frequency response characteristics shown in Figure 6, while distortion cases 8k through 8n corresponded to the frequency response characteristics shown in Figure 7.
Table 1 – Summary of the Voltage Distortion Levels with Various Capacitor Banks In-Service
| Case Number – Case Description | 12.47 kV Substation Bus | 12.47 kV Customer #1 Bus |
|---|---|---|
| Case 8c – 0x5400kVAr, W Off, T Off | 8.09% | 16.29% |
| Case 8d – 0x5400kVAr, W Off, T On | 7.66% | 15.01% |
| Case 8e – 0x5400kVAr, W On, T Off | 8.68% | 16.18% |
| Case 8f – 0x5400kVAr, W On, T On | 8.17% | 15.18% |
| Case 8g – 1x5400kVAr, W Off, T Off | 2.79% | 2.95% |
| Case 8h – 1x5400kVAr, W Off, T On | 4.35% | 4.72% |
| Case 8i – 1x5400kVAr, W On, T Off | 3.09% | 3.25% |
| Case 8j – 1x5400kVAr, W On, T On | 4.86% | 5.33% |
| Case 8k – 2x5400kVAr, W Off, T Off | 4.81% | 5.62% |
| Case 8l – 2x5400kVAr, W Off, T On | 3.50% | 4.16% |
| Case 8m – 2x5400kVAr, W On, T Off | 5.93% | 6.83% |
| Case 8n – 2x5400kVAr, W On, T On | 3.18% | 3.86% |
The power conditioning solution alternative that was investigated during the study was converting one of the existing feeder capacitor banks into a passive shunt single-tuned harmonic filter. Passive filters are made of inductive, capacitive, and resistive elements. They are relatively inexpensive compared with other means for eliminating harmonic distortion, but they have the disadvantage of potentially adverse interactions with the power system. They are employed either to shunt the harmonic currents off the line or to block their flow between parts of the system by tuning the elements to create a resonance at a selected harmonic frequency.
Filters are generally tuned slightly below the harmonic frequency of concern. This method allows for tolerances in the filter components and prevents the filter from acting as a direct short circuit for the offending harmonic current. It also minimizes the possibility of dangerous harmonic resonance should the system parameters change and cause the tuning frequency to shift slightly higher. The filter design involved converting the existing 1,200 kVAr, 12.47 kV capacitor bank at Customer 1 into a 4.7th harmonic filter.
Figure 8 shows the impedance vs. frequency simulation results with the Customer 1 power factor correction capacitor bank reconfigured as a 4.7th harmonic filter. The previous worst-case frequency scan and the base-case with no utility or customer capacitor in-service banks was shown for reference. As can be observed in the figure, the frequency response characteristic shows the very low impedance at the filter tuning frequency. Figure 9 shows the effect of various feeder capacitor banks on the frequency response with the harmonic filter in-service.
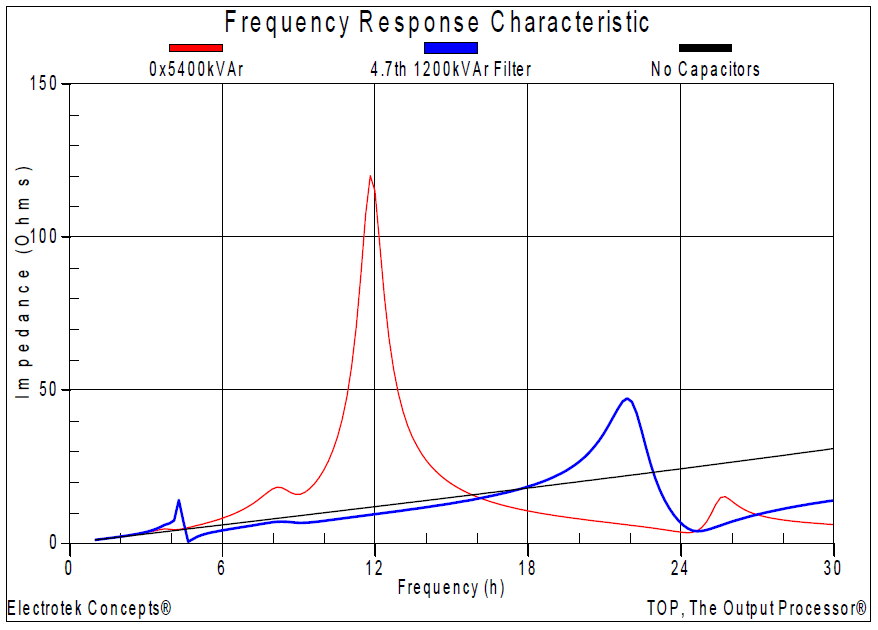
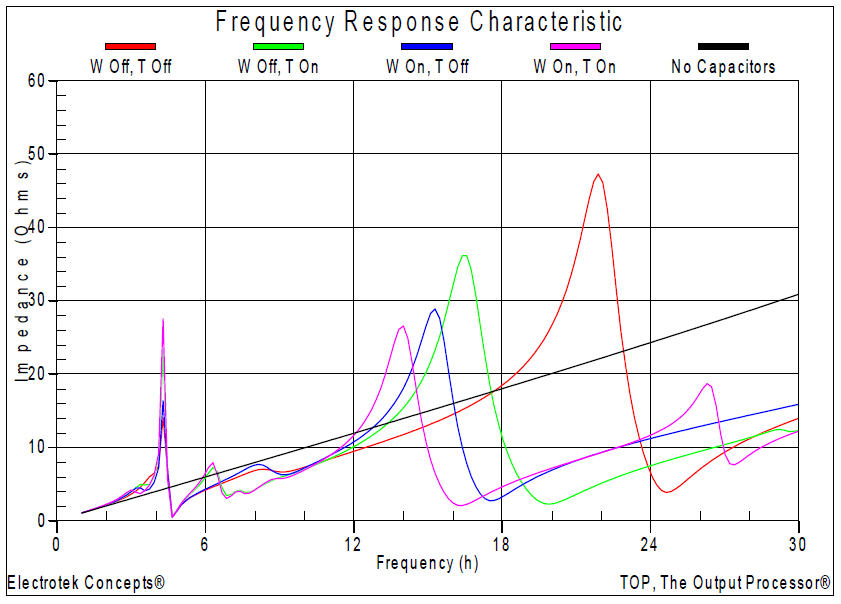
Table 2 summarizes the harmonic distortion simulations with the 1,200 kVAr, 4.7th harmonic filter in-service. The table includes the same simulation legend codes, as well as the voltage distortion (VTHD) at the 12.47 kV substation bus and at the 12.47 kV bus at Customer 1. The results shown in the table highlight the fact that all of the voltage distortion levels were below the commonly-used voltage distortion (VTHD) limit of 5%
Table 2 – Summary of the Voltage Distortion Levels with the Harmonic Filter Bank In-Service
| Case Number – Case Description | 12.47 kV Substation Bus | 12.47 kV Customer #1 Bus |
|---|---|---|
| Case 8n – 0x5400kVAr, W Off, T Off | 2.02% | 3.04% |
| Case 8o – 0x5400kVAr, W Off, T On | 2.08% | 3.27% |
| Case 8p – 0x5400kVAr, W On, T Off | 2.35% | 3.57% |
| Case 8q – 0x5400kVAr, W On, T On | 2.84% | 3.97% |
| Case 8r – 1x5400kVAr, W Off, T Off | 3.05% | 2.42% |
| Case 8s – 1x5400kVAr, W Off, T On | 2.55% | 1.88% |
| Case 8t – 1x5400kVAr, W On, T Off | 4.17% | 3.60% |
| Case 8u – 1x5400kVAr, W On, T On | 2.45% | 1.95% |
| Case 8v – 2x5400kVAr, W Off, T Off | 2.03% | 2.07% |
| Case 8w – 2x5400kVAr, W Off, T On | 3.12% | 2.68% |
| Case 8x – 2x5400kVAr, W On, T Off | 2.31% | 2.39% |
| Case 8y – 2x5400kVAr, W On, T On | 3.43% | 2.90% |
SUMMARY
This case study summarized a utility distribution substation capacitor bank harmonic analysis. The investigation included frequency response and harmonic distortion simulations for a 12.47 kV utility substation that included a 36 MVA, 161 kV/12.47 kV step-down transformer and a number of distribution feeders with a significant number of small capacitor banks and several industrial customers.
The utility capacitor banks included two 5,400 kVAr, 12.47 kV capacitor banks at the substation bus, a 1,200 kVAr capacitor bank at one customer facility, and a number of 300 kVAr and 600 kVAr capacitor banks on four distribution feeders.
The customer loads included a 450 kVA step-down transformer supplying a 69 kVAr, 480 V power factor correction capacitor bank and a 15 MVA, 12-pulse induction furnace. In addition, each distribution feeder also included a number of distributed harmonic producing nonlinear loads representing a variety of customer facilities.
The power conditioning mitigation alterative selected was to convert the 1,200 kVAr, 12.47 kV capacitor bank at one customer facility into a shunt passive harmonic filter tuned to the 4.7th harmonic which, in turn, reduced the harmonic voltage distortion levels for all of the simulated contingencies to below the specified limit.
Due to the excessive component duty requirements, the capacitor bank units that were used in the shunt harmonic filter design were rated at 14.4 kV for application on the 12.47 kV customer primary bus.
REFERENCES
1.IEEE Recommended Practice for Monitoring Electric Power Quality,” IEEE Std. 1159-1995, IEEE, October 1995, ISBN: 1-55937-549-3.
2.IEEE Recommended Practices and Requirements for Harmonic Control in Electrical Power Systems, IEEE Std. 519-1992, IEEE, ISBN: 1-5593-7239-7.
3.R.C. Dugan, M.F. McGranaghan, S. Santoso, H.W. Beaty, “Electrical Power Systems Quality,” McGraw-Hill Companies, Inc., November 2002, ISBN 0-07-138622-X.
RELATED STANDARDS
IEEE Std. 1159, IEEE Std. 519
GLOSSARY AND ACRONYMS
ASD: Adjustable-Speed Drive
CF: Crest Factor
DPF: Displacement Power Factor
PF: Power Factor
PWM: Pulse Width Modulation
THD: Total Harmonic Distortion
TPF: True Power Factor
