Published by Norberto ANGULO1, Antonio PULIDO1, Felipe DÍAZ1, Fabián DÉNIZ1, Expedito SÁNCHEZ1, Rafael SÁNCHEZ2, Universidad de Las Palmas de Gran Canaria (1), Mancomunidad del Sureste de Gran Canaria (2)
Abstract. The main aim of this paper is to determine the photovoltaic capacity of Gran Canaria Island, part of the Canary Islands, an archipelago with high levels of solar irradiation. The method: an individual research focused on each municipality of the island, calculating the energy to be produced by each of them, separately. From the analysis, it can be concluded that the best option for PV in the island is the building integrated systems, especially the roof integrated ones.
Streszczenie. Celem pracy jest określenie możliwości fotowoltaicznych wispy Gran Canaria w archipelago wysp Kanaryjskich o bardzo dużym nasłonecznieniu. W konkluzji stwierdzono że najlepszym rozwiązaniem jest budowa zintegrowanego systemu dachowego. (Dachowy zintegrowany system fotowoltaiczny na wyspach Kanaryjskich)
Keywords: Solar energy; Distributed Generation; Roof Integrated PV Systems.
Słowa kluczowe: energia słoneczna, system c=dachowy.
Introduction
The enviable geographical location of the Canary Islands is characterized by high levels of solar irradiation; making the archipelago a suitable region to host photovoltaic systems. However, the current implantation of this systems on land is unviable due to the limitations of the territory (7529 km2), the high rates of population (2.100.000 inhabitants, January 2010), and the abundance of protected areas (46% of the surface). Therefore, the future of photovoltaic energy within the Canary Islands in general; and within the island of Gran Canaria in particular; comes along with the construction of photovoltaic systems on top of the buildings, connected to the main network. Each building would host low power systems, what, in addition, would allow the decentralization of the electricity generation; and the consequent improvement of the current power system, increasing its output.
PV in Spain in general and in the Canary Islands in particular begins to be implemented in a serious way since 2004 as a result of the emergence of a regulatory framework providing a bonus for the generation through renewable energy sources (RD 436/2004).
One year later, the Spanish Government launched a detailed plan for introducing renewable energy generation systems. This plan, known as “Plan de Energías Renovables” (PER), set the expected numbers of the photovoltaic energy in Spain: 400 MW installed for 2010, and therefore, 363 MW to be installed within a period of 5 years (2005-2010). This plan specified as well the scheduled installed power in Canarias for 2010, 17,24MW; what meant the installation of 16,04MW within 5 years, a 93% of the total power.
The Canary Islands Government, in order to adapt its energy policy to the dictates of the Spanish Government, in 2006 created the “Plan Energético de Canarias” also known as PECAN. It tried to make possible, the installation of power in the Archipelago through renewable energy to reduce the dependence on fossil fuels in the power system from 99.9% in 2006 to 74% in2015 achieving a demand coverage of 30% by 2015 through renewable energy. European directives advise on coverage of 22% of demand in that period, so the PECAN lead the Canary Islands to a state of sustainability above the European expectations. Furthermore, the emplacement of these power systems on buildings’ roofs lead to a decentralization of the electricity generation that satisfies the European objectives referred to the new electricity distribution models.
The in-situ generation leads to an important reduction of electrical losses in conductors. To conclude, taking into account this type of renewable energy helps the region to succeed in the achievement of a state of sustainable development and technological advance.
Analysis of a grid connected PV System
This research is based on the Liu and Jordan updated method [1].
The method involves calculating the values of both direct and diffuse irradiation, using for this purpose some approximated expressions for the specific latitude of Gran Canaria Island. The diffuse irradiation can be obtained by using the following formula:
(1) kT = RGH / REH
Where kT is the clearness index, defined as the ratio of the measured total horizontal solar radiation to the corresponding diffuse horizontal radiation; RGH is the total horizontal solar radiation, REH is the extra-terrestrial horizontal radiation.
To obtain the direct irradiation:
(2) RNH = RGH – RDH
RNH is the direct horizontal irradiation, being RDH the diffuse horizontal irradiation.
This method allows calculating the direct and diffuse irradiation over inclined surfaces (RNI and RDI) using RGH as the only input required data.
The different values are obtained empirically from the measurement stations of the “Instituto Tecnológico de Canarias” (ITC) in Gran Canaria Island. In this case, there are seven stations all around the island.
A. PV system study for static structures.
Static structure PV systems are those which orientation and inclination cannot be changed. Systems installed in the northern hemisphere should be south oriented. However, the inclination depends on latitude. The analysis of the best inclination for Gran Canaria Island has produced the results observed in Fig. 1.
Concluding, the best inclination for PV systems in Gran Canaria Island is south oriented 20º. This way the maximum PV performance is achieved, though 5º variations of the inclination lead to 1% variations of the output. Therefore, the inclination is not really a key parameter when sizing the PV system; variations of 5º in orientation imply 10-15% variation of the energy production. There is no room to doubt of the importance that the PV system design has.

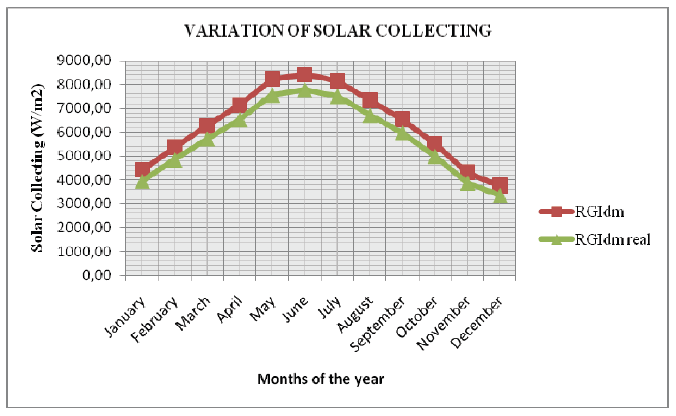
Apart from these parameters, the losses in the facility due to dirt and other effects should be taken into account when designing a PV power plant. These losses can be easily calculated as described by the “Instituto para la Diversificación y Ahorro de la Energía” (IDAE). The losses produced by the different factors, for a grid connected PV system (static structure), are around the 9%. Therefore, the solar collecting varies according to Fig. 2.

The variation of power generation during the day gives us the possibility to design the PV system according to the existing current demand of energy. As a result, a view of the diary demand curve provided by Red Eléctrica de España (REE) helps concluding that PV generation cannot satisfy the energy demand of the island by itself. The PV energy production runs only from 6 a.m. to 7 p.m. remaining the systems out of use the rest of the day. During this interval of time, still the 74,3% of the average monthly demand can be satisfied. The distribution of produced energy is shown in Fig. 3.
B. PV system study with solar tracker (2x).
The use of a solar tracker (double axis), leads to an increase of the power production. These installations are designed so that both, inclination and orientation vary depending on the solar time, date and latitude.
The use of PV systems with solar tracker should be emphasized due to these two meaningful advantages:
Firstly, this system produces an average of 48% more than the static structure; the comparison between both systems is reflected in Fig. 4.
Second, the solar collecting losses due to dirt and other effects are reduced approximately a 3% [1, 2].
According to these advantages, this type of PV systems should be profitable enough to be installed on every roof.
The installation of PV power plants with solar tracker requires a great initial capital outlay. Property developers and owners are not willing to pay that. On the other hand, maintenance costs and space are important items to take into account. The use of the roofs for the installations should generally have no cost; however a great part of the roofs surface should be used for this kind of power plants, what often leads to a waste of the roofs usable space.
C. Solar hours for calculating the electric power production.
The solar hours are computed [3], in order to estimate the electric power generation.
Table 1. Solar hours to calculate the electric production
| MUNICIPALITY | Solar hours. Estatic systems | Solar hours. Solar supporter |
|---|---|---|
| Aldea de San Nicolás | 2095,117 | 3093,913 |
| Santa Lucía de Tirajana | 2042,607 | 2995,287 |
| Mogán | 1876,913 | 2694,666 |
| San Bartolomé de Tirajana | 1862,267 | 2662,571 |
| Galdar | 1855,694 | 2654,169 |
| Las Palmas GC | 1682,643 | 2349,002 |
| Santa Brígida | 1656,108 | 2305,416 |
| Telde | 2043,99 | 2998,454 |
| Ingenio | 2043,436 | 2997,179 |
| Agüimes | 2043,317 | 2996,862 |
| Agaete | 1855,084 | 2652,541 |
| Guia | 1855,45 | 2653,515 |
| Arucas | 1835,727 | 2586,501 |
| Firgas | 1816,01 | 2609,256 |
| Teror | 1656,31 | 2305,843 |
| Valleseco | 1656,209 | 2305,63 |
| San Mateo | 1656,007 | 2305,204 |
| Valsequillo | 1793,581 | 2547,955 |
| Tejeda | 1607,535 | 2204,312 |
| Moya | 1855,328 | 2653,19 |
| Artenara | 2000,202 | 2921,648 |
Maximum power to be installed in Gran Canaria Island
According to the previous researches [4, 5]; along with the determined maximum surface of PV panels; the maximum installable power can be calculated for each municipality. The chart below includes the results.
Table 2. Possible installed power and energy generated
| MUNICIPALITY | P SFCRinstalled (MW) | E SFCRgenerated (GWh/year) |
|---|---|---|
| Aldea | 93,6 | 196,10 |
| Santa Lucía | 658 | 1344,04 |
| Mogán | 388 | 728,24 |
| San Bartolomé | 1400 | 2607,17 |
| Gáldar | 132 | 244,95 |
| Las Palmas GC | 2960 | 4980,62 |
| Santa Brígida | 59 | 97,71 |
| Telde | 1004 | 2052,17 |
| Ingenio | 323 | 660,03 |
| Agüimes | 656 | 1340,42 |
| Agaete | 73 | 135,42 |
| Guía | 111 | 205,95 |
| Firgas | 36 | 66,09 |
| Arucas | 292 | 530,27 |
| Teror | 87 | 144,10 |
| Valleseco | 31 | 51,34 |
| San Mateo | 21 | 34,78 |
| Valsequillo | 52 | 93,27 |
| Tejeda | 13 | 20,90 |
| Moya | 61 | 113,18 |
| Artenara | 13 | 26,00 |
| TOTAL | 8463,6 | 15672,75 |


Conclusions
An economic study about roof integrated PV power plants concludes that these facilities are viable. The estimated payback period is 16 years. This study is focused on Gran Canaria Island as a whole. However, any change in the regulation may turn these facilities into an unviable business.
With regard to the photovoltaic capacity in Gran Canaria Island, it has to be said that to install a photovoltaic field of such dimensions is not feasible from a technical standpoint, given the low-power system in which we are involved and the consequences of instability that this kind of generation can produce. In addition, 8464 MW exceeds PECAN and PER prospects.
Assuming the viability of this system, thereby obviating all technical and legal restrictions, the role that PV can develop in today’s society contributes to improve the power system performance.
The rate of installed power and produced energy is drawn in Figure 6 and 7.
REFERENCES
[1] Lorenzo E., Electricidad Solar. Ingeniería de los Sistemas Fotovoltaicos. Ed. Madrid-Universidad Politécnica de Madrid-Sevilla-Progensa (1994)
[2] Manual de Energía Solar Fotovoltaica. Ed. Madrid- IDEA. (1993)
[3] A lcor E. , Instalaciones Solares Fotovoltaicas. Ed. Progensa,
[4] Díaz F., Valido D., Déniz F., Cruz J., Hernández G. , Roof integrated photovoltaic generation possibilities in Gran Canaria (Canary Islands), 19th European Photovoltaic Solar Energy Conference and Exhibition (2004)
[5] Díaz F., Déniz F., Val i do D., Cruz J . , Photovoltaic generation in Gran Canaria (Canary Islands): Energy and environmental incidence. Great Wall World Renewable Energy Forum and Exhibition (GWREF2006) (2006)
[6] Fernández J.M. , Compendio de energía solar: Fotovoltaica, Térmica y Termoeléctrica. Ed. Progensa
[7] Gar c ía M., Manual de Mantenimiento de Instalaciones Fotovoltaicas Conectadas a Red. (2010)
Authors: Dr eng. Norberto Angulo, E-mail: nangulo@die.ulpgc.es; eng. Antonio Pulido, E-mail: apulido@die.ulpgc.es; eng. Felipe Díaz, E-mail: fdiaz@die.ulpgc.es; dr eng. Fabián Déniz, E-mail: fdeniz@die.ulpgc.es; eng. Expedito Sánchez, E-mail: expe.sanchez@gmail.com; Dept. Ingeniería Eléctrica, Universidad de Las Palmas de Gran Canaria, 35017 Las Palmas de Gran Canaria, eng. Rafael Sánchez, Mancomunidad del Sureste de Gran Canaria, 35118 Las Palmas de Gran Canaria, E-mail: mancomunidad@surestegc.org.
Source & Publisher Item Identifier: PRZEGLĄD ELEKTROTECHNICZNY (Electrical Review), ISSN 0033-2097, R. 88 NR 1a/2012
