Published by Marcin SZEWCZYK, Tomasz KUCZEK, Mariusz STOSUR, Wojciech PIASECKI, Marek FLORKOWSKI, Marek FULCZYK, ABB Corporate Research Center in Krakow, Poland
Abstract. In the present paper simulations of the propagation of lightning overvoltages in a typical HV GIS substation are presented. The influence of HV LC filter on maximum overvoltages peak values was analyzed. Additionally, an improvement to the surge protection by using a HV filtering element introduced at the connecting point between the GIS substation and the transmission line has been proposed.
Streszczenie. W artykule przedstawiono symulacje wyładowań atmosferycznych i propagacji fali przepięciowej w typowej stacji GIS wysokiego napięcia. Zaprezentowano możliwość zapewnienia dodatkowej ochrony przeciwprzepięciowej poprzez ograniczenie maksymalnej wartości przepięć za pomocą wysokonapięciowego filtra w miejscu połączenia przesyłowej linii napowietrznej ze stacją GIS. (Wpływ filtra LC wysokiego napięcia na ograniczenie przepięć piorunowych w stacjach gazowych typu GIS)
Keywords: insulation coordination, GIS, substation, lightning overvoltages, LC low pass filter, modeling, ATP/EMTP.
Słowa kluczowe: koordynacja izolacji, stacja GIS, przepięcia piorunowe, LC filtr dolno-przepustowy, modelowanie, ATP/EMTP.
Introduction
Studies of power systems involving lightning surge phenomena are performed to design transmission lines and substations as well as for the insulation coordination of power system equipment. Lightning overvoltages are generated by a current stroke to a tower structure, which results in complex surge phenomena propagating throughout the transmission lines and substations. An overvoltage is a voltage wave which is superimposed on the rated voltage of the network. It is characterized by: the magnitude (in kV), the rise time (in μs) and the rate of rise called steepness (in kV/μs). Overvoltages which can disturb electrical installations and loads can have lightning or switching origin.
GIS substations are protected against switching and lightning overvoltages by means of surge arresters. The protective levels of the arresters are selected so that the overvoltages appearing at the protected elements are lower than the corresponding insulation coordination levels.
In insulation coordination practice an assumption is made that in all cases an air insulated surge arrester (AIS) is obligatory, and is installed at the gantry of the substation. A GIS surge arrester, installed at the transformer terminal, is also required.
Due to the fact that lightning phenomenon is by nature high frequency, special modeling approaches have to be applied. This paper describes modeling principles of frequency dependent elements using the ATP/EMTP software package. A typical system consisting of a high voltage transmission line and a 400 kV GIS substation has been modeled. Lightning phenomena including both direct stroke and back-flash stroke have been simulated for HV LC filter working conditions in order to evaluate key factors influencing the maximum overvoltage peak values.
Models of studied system
An incoming 23 km overhead transmission line was represented by a frequency dependent JMarti model. It was implemented in the ATP/EMTP software with the Line/Cable Constants subroutine [1].
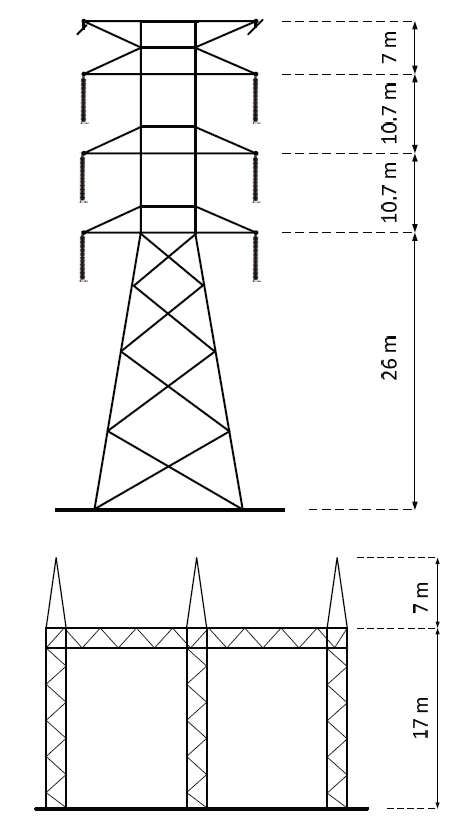
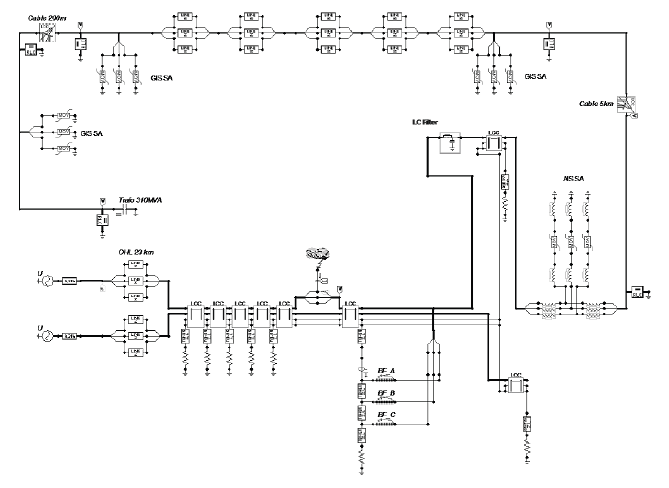
Two parallel lines with conductors per bundle were introduced, as presented in Figure 1. During the lightning strike an overvoltage wave is generated, which propagates and deflects at any point of discontinuity. For this reason it is important to model 5 separate spans of overhead line (400 m each) counting from the portal tower (gantry). A propagating surge wave can be also deflected from the tower base, thus the tower footing resistance (TFR) was implemented as a constant value of resistance equal to 20 Ω. The tower structure (Fig.1) was represented by means of a lossless distributed parameter line, which consists of a surge impedance equal to 172 Ω, a wave propagation speed of 290 m/μs and an associated height. The portal tower (Fig. 1) surge impedance value was equal to 70 Ω [1,4-5].
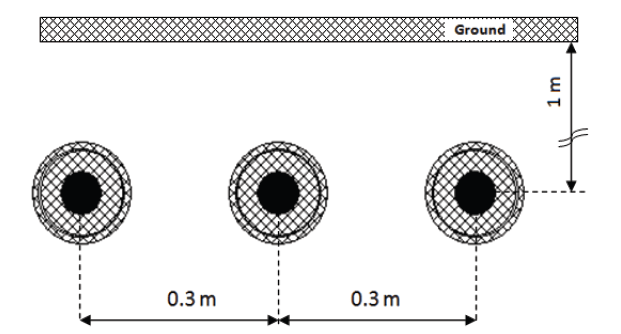
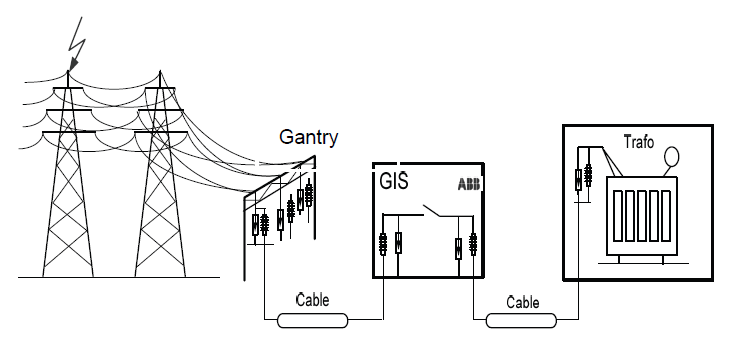
The HV cable that interconnects the GIS substation with the overhead transmission line has a length equal to 5 km, whereas the cable between GIS substation and power transformer is 0.2 km long. Both cables were modeled as frequency dependent elements with Line/Cable Constants subroutine [1-2]. A flat formation with 0.3 m spacing between each cable and 1 m vertical depth position were used. Its arrangement and basic parameters are presented in Figure 2 and Table 1.
Table 1. HV cable data [5]
| Parameter | Value |
|---|---|
| conductor cross section | 2500 mm2 |
| XLPE insulation thickness | 25.8 mm |
| XLPE relative permittivity | 2.5 |
| overall diameter | 146 mm |
Due to the high frequency nature of the lightning phenomenon, various pieces of substation equipment were modeled as appropriate phase-to-ground capacitances Cp-g [pF] and surge impedances Z [Ω] with associated length L [m] and wave propagation speed v [m/μs]. Values used in the analyses are given in Table 2.
Table 2. Substation apparatus data [5]
| Apparatus | Parameters |
|---|---|
| GIS busbars | Z = 60 Ω, v = 290 m/μs |
| 310 MVA transformer 400 kV terminals | 2000 pF |
| circuit breaker | 50 pF |
| GIS spacer | 15 pF |
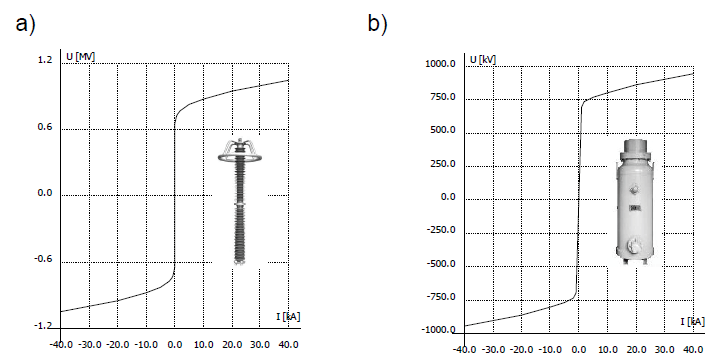
For the overvoltage mitigation purposes both air and gas insulated surge arresters are installed in a substation. In the model they are represented by nonlinear U-I characteristics at 8/20 μs current surge, as presented in Figure 3. Lead lengths and phase-to-ground capacitances have been added, 1 μH/m and 25 pF respectively.
The insulators are represented by the Leader Progression Model. This model considers an equivalent leader, which propagates along the insulator. Back-flash occurs when the leader length reaches length of the insulator gap (assumed to 4.5 m) in specific time equal to that of real leaders. The leader velocity and its propagation are described by a formula (1) given by [4]:
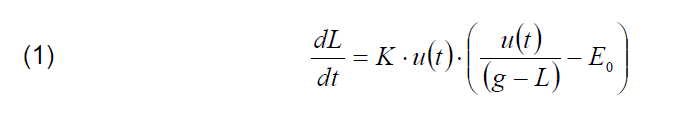
where: K – constant [m2/([kV]2· s)], E0 – average gradient voltage [kV/m], u(t) – voltage across the gap [kV], g – gap length [m], L – leader length [m].
Studies
The studied 400 kV network consists of two parallel incoming transmission lines, a GIS substation and HV cables that interconnect the GIS substation with overhead lines (5 km) and the GIS substation with power transformer (0.2 km). An air insulated surge arrester is installed at the portal tower, whereas gas insulated surge arresters are connected at the GIS substation and HV terminals of 310 MVA transformer (Fig.4). A new solution has also been introduced. It was proposed to install a passive overvoltage mitigating device at the portal tower (Fig.4), comprising a high voltage LC low-pass filter [6].
Lightning strokes occurring at the overhead transmission lines incoming at the 400 kV GIS substation have been simulated by means of CIGRE wave shape [2]. Two different scenarios and lightning current magnitudes were used:
– direct stroke to the phase wire with 30 kA current,
– stroke to shield wire causing back-flash across the insulator chain to the phase wire with 200 kA current.
For each case maximum overvoltage peak values have been calculated and compared to the Basic Insulation Level (BIL) of 1425 kV [3-4].
ATP/EMTP simulation results
The objective of these studies was to analyze the influence of HV LC filter on overvoltages in a typical power network consisting of an overhead line (OHL), cables and GIS substation as well as to select such parameters, which are the most appropriate for mitigation of Fast Transients in a GIS substation.
Table 3. Scope of work
| Overvoltage mitigation device | Run 1 – Fig.6 | Run 2 – Fig. 7 |
|---|---|---|
| AIS surge arrester | connected | connected |
| LC filter | connected | not connected |
| GIS surge arrester at substation entrance | not connected | connected |
| GIS surge arrester at substation exit | not connected | connected |
| GIS surge arrester at Transformer HV terminals | not connected | connected |
The parameter optimization analysis was performed for a typical 400 kV GIS substation in which the HV filter has been applied in order to mitigate Fast Transients caused by lightning strokes. The HV LC filter has been located between overhead line (OHL) and HV cables that interconnect a GIS substation (Fig.4). For each of the above cases, voltages in three points were observed: at the transformer terminal (TRAFO), the GIS entrance (GIS IN) and the GIS exit (GIS OUT). A detailed scope of work was presented in Table 3.
The ATP/EMTP model of the 400 kV power network and GIS substation involved in the simulations is shown in Figure 5.
The Fast Transients analyses were performed in order to check the effectiveness of the HV LC filter at suppressing the overvoltages that occurred during lightning strokes [7]. The following scenarios with respect to the scope of work from Table 3 have been considered:
• BF Tower 2 – back-flash at tower 2,
• BT Tower 3 – back-flash at tower 3,
• DS 50 m – direct stroke 50 m from tower 1,
• DS 300 m – direct stroke 300 m from tower 1.
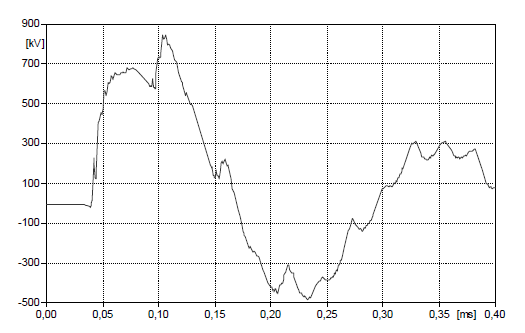
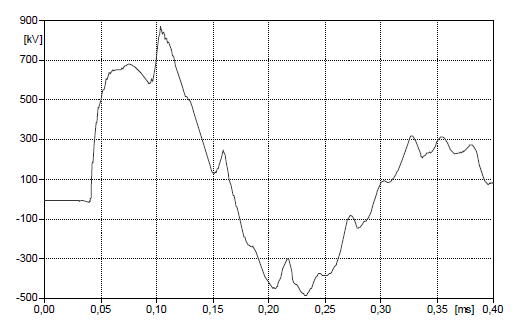
The maximum overvoltage peak values for the simulated cases are summarized in Figure 6 (run 1). For comparison, results for normal cases in system (without HV LC filter) are given in Figure 7 (run 2).
Overvoltages have been calculated at the three points of consideration and for different surge arresters combinations as presented in Table 3 with reference to diagram illustrated in Figure 5.
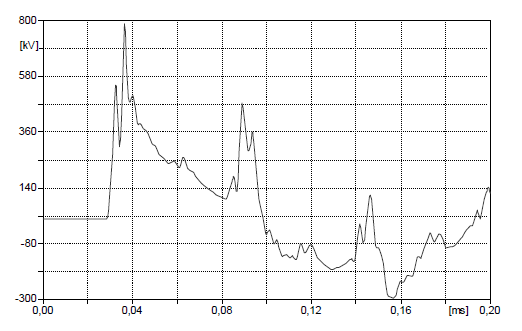
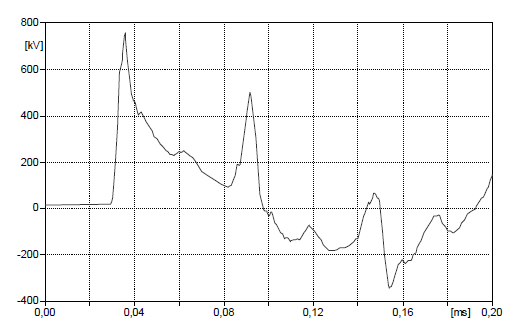
Calculated ATP/EMTP simulation waveforms are presented in Figures 8 to 13.
It has been determined that in the system studied, it is potentially possible to omit the installation of GIS surge arresters in the power system. When only the GIS surge arresters within the GIS substation are omitted (i.e. when the only surge arresters are: the AIS SA at the gantry and the GIS SA at the transformer terminal), the overvoltages are below the insulation coordination level (80% of BIL) (Fig.6). Hence, the GIS surge arresters within the GIS substation of interest are optional.
For further reduction of the overvoltages and for improving the insulation coordination margin, a HV LC filter can be applied. The reduction is substantial for direct strokes, for which the insulation coordination level is exceeded when only the AIS surge arrester at the gantry is applied. In this case the insulation coordination margin can be achieved by adding the GIS surge arrester at the transformer terminal. The proposed additional solution is a passive element consisting of a line trap main coil (L) and a coupling capacitor (C). It has been proven that the proposed filter provides sufficient insulation coordination margins.
Conclusions
The Insulation Coordination study for a typical system consisting of 400 kV GIS substation interconnected by a HV cables has been performed using the ATP/EMTP software. Back-flash and direct stroke scenarios for lightning overvoltage analyses were studied. The overvoltages have been calculated at essential points of the substation: at the transformer HV terminal, substation entrance and substation exit.
An alternative solution to the use of an additional GIS surge arrester has been proposed. The passive element consisting of a line trap main coil and a coupling capacitor installed at the portal tower have been introduced. It should be noted that when the HV LC filter was installed the lightning overvoltages were kept below the BIL, especially in the worst cases where all GIS surge arresters in the power system were not installed. Hence it is suggested to use the solution proposed as an additional transient mitigation device.
REFERENCES
[1] Dommel H.W., Electromagnetic Transients Program, Reference Manual (EMTP) Theory Book, BPA, Portland, Oregon, (1986)
[2] CIGRE WG33.0, Guide to procedure for estimating the lightning performance of transmission lines, CIGRE brochure 63, Oct. (1991)
[3] IEC 60071-1:2006, Insulation co-ordination – Part 1: Definitions, principles and rules
[4] Andrew R. Hileman, Insulation Coordination for Power Systems, CRC Press Taylor and Francis Group, New York, (1999)
[5] IEEE Fast Front Transients Task Force, Modeling Guidelines for Fast Front Transients, IEEE Transactions on Power Delivery, Vol. 11, pp. 493-506, Jan. 1996
[6] S tosur M. et al., Impact of high voltage GIS substation configuration on lightning overvoltages, NIWE-11 Conference, Sept. (2011) (a copy in print for Electrical Review)
[7] IEC 60099-4:2009, Surge arresters – Part 4: Metal-oxide surge arresters without gaps for a.c. systems
Authors:
Marcin Szewczyk, Ph.D. Eng. E-mail: marcin.szewczyk@pl.abb.com;
Tomasz Kuczek, M.Sc. Eng. E-mail: tomasz.kuczek@pl.abb.com;
Mariusz Stosur, Ph.D. Eng. E-mail: mariusz.stosur@pl.abb.com;
Wojciech Piasecki, Ph.D. Eng. E-mail: wojciech.piasecki@pl.abb.com;
Marek Florkowski, D.Sc. Eng. E-mail: marek.florkowski@pl.abb.com;
Marek Fulczyk, Ph.D. Eng. E-mail: marek.fulczyk@pl.abb.com;
ABB Corporate Research Center, Starowiślna 13A Str., 31-038 Kraków, Poland;
Source & Publisher Item Identifier: PRZEGLĄD ELEKTROTECHNICZNY (Electrical Review), ISSN 0033-2097, R. 88 NR 5a/2012
