Published by Electrotek Concepts, Inc., PQSoft Case Study: Study of 345 kV Transient Recovery Voltages, Document ID: PQS0602, Date: January 1, 2006.
Abstract: Transient recovery voltage (TRV) is the voltage across the terminals of a pole of circuit breaker following current zero when interrupting faults. TRV waveshapes can be oscillatory, exponential, cosine-exponential or combinations of these forms. TRVs due to short-line faults (SLFs) are characterized by triangular-shaped waveshapes and a very steep initial rate-of-rise. An engineering study found that for a number of cases, the TRV waveshapes exceeded their related TRV capability limits for the first 10-50 μsec. The results also indicated that clearing SLFs on lines leaving the 345kV substations would result in an initial rate-of-rise of the recovery voltage (RRRV) that exceeds the breaker’s SLF capability. The study evaluated the application of an additional capacitance on the line side of the circuit breakers. This capacitance reduces the initial RRRV to within the related SLF capability. This case study presents a summary of the model development and simulations completed during the 345kV TRV study.
INTRODUCTION
Due to the concern for excessive TRVs during breaker operations, an engineering study was preformed to evaluate the proposed 345kV substation design, as well as the impact on nearby utility equipment. The study evaluated the concerns and possible solutions, such as adding capacitive devices, to protect against the harmful transients that may damage the surrounding equipment and power system.
The analysis of high-frequency TRVs frequently requires the use of sophisticated digital simulation tools. Simulations provide a convenient means to characterize transient events, determine resulting problems, and evaluate possible mitigation alternatives. Occasionally, they are performed in conjunction with system monitoring for verification of models and identification of important power system problems. The complexity of the models required for the simulations generally depends on the system characteristics and the transient phenomena under investigation.
The transient analysis for the study was performed using the PSCAD program. This program can be used for the analysis of circuit switching operations, capacitor switching, lightning transients, and transients associated with the operation of power electronic equipment.
STUDY METHODOLOGY
The TRV evaluation for various fault conditions was based on the methods provided in IEEE Std. C37.06, IEEE Std. C37.04, and IEEE Std. C37.011. This involved analysis of the most severe conditions, including the clearing of a three-phase ungrounded symmetrical fault at the breaker terminal when the system voltage is at a maximum and SLFs.
The study considered normal cases where the system operates with all breakers and lines in service and various contingencies where only one breaker is available to clear a fault. For both of these conditions, three-phase ungrounded and single-line-to-ground faults were evaluated.
TRV is the voltage across the terminals of a pole of circuit breaker following current zero when interrupting faults. TRV waveshapes can be oscillatory, exponential, cosine-exponential or combinations of these forms. TRVs due to SLFs are characterized by triangular-shaped waveshapes and a very steep initial rate-of-rise. The triangular shape of the recovery voltage arises from positive and negative reflections of the traveling waves that oscillate between the open breaker and the fault. Due to the short distance involved between the fault location and the open breaker, the initial RRRV can be very steep.
According to IEEE Std. 37.011-1994, the most severe oscillatory or exponential recovery voltages tend to occur across the first pole to open of a circuit breaker interrupting a three-phase ungrounded symmetrical fault at its terminal when the system voltage is at a maximum. When the TRV performance meets the withstand criteria when subjected to the fault condition mentioned above, a SLF evaluation is not necessary. This is due to the fact that SLF TRV capability is higher than that of a three-phase ungrounded fault.
MODEL DEVELOPMENT
The model development process included steps for data collection, data approximation, data simplification and model verification.
The TRV system model was based on short-circuit data that consisted of positive and zero sequence impedance data in the ASPEN Oneliner format. The study area included the substation and the adjacent system (see Figure 1). The boundary of the study area was represented with equivalent sources and transfer impedances such that the electrical representation of the study area (at 60 Hz) was nearly identical to the original representation.

In the study, all transmission lines were represented with a frequency dependent line model to account for traveling wave phenomena. Generating units were represented with ideal sources behind sub-transient impedances. The accuracy of the transient model was verified by comparing three-phase and single-line-to-ground fault currents at all buses. A subset of the fault cases is summarized in Table 1.
Table 1 – Steady-State Fault Simulations Completed for Model Verification

The model represented a reduction of the entire system to determine the system equivalents and corresponding fault levels. It should be noted that the corresponding PSCAD model did not include mutual coupling between transmission lines. In addition, typical X/R ratio values were used where the short-circuit model did not include resistance (e.g., lines, transformers, etc.), and relatively large transfer impedances were ignored. Considering these factors, accuracy within 3% was considered acceptable for the 60 Hz short-circuit model verification.
Circuit Breaker Data
In evaluating the TRV withstand capability for the 345kV breakers, the following references were used:
- ANSI C37.06-2000 Tables 3 and 6 (Note 6 for Table 3)
- IEEE C37.04-1999, Section 5.9, Table 2 and Figure 5
The new 345kV breakers have the following ratings:
Rated Maximum Voltage: 362 kV
Rated Continuous Current: 3000 A
Rated Short-Circuit Current: 63 kA
Rated Interrupting Time: 2 Cycles
Rated Transient Inrush Current: 25 kA
Rated Transient Inrush Current Frequency: 4250 Hz
TRV-related data is shown in Table 2 and Table 3.
Table 2 – Rated TRV Capability of 362kV, 3000 A, 63kA Breaker
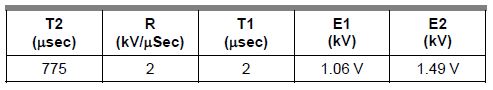
Table 3 – Multipliers for Various Interrupting Levels for Terminal Faults

The waveshape of the exponential component E1 for terminal faults below 30% of the breaker rating is 1-cosine. Based on Table 2 and Table 3 and the discussion in Section 5.9 of IEEE Std. C37.04-1999, the TRV limit envelopes were derived and graphically represented using a MATLAB program. Figure 2 shows the TRV envelopes (or withstand capabilities) for several fault levels. Capability envelopes when interrupting fault currents below 30% of its rated short-circuit current have a waveshape of 1-cosine, while for fault currents above 30% of breaker rating, the waveshape has an exponential-cosine form.

Capacitance Values for Substation Equipment
Equivalent values of capacitance for substation equipment were the lumped values at the breaker terminals. Since the capacitance values for the 345kV equipment at the studied substations were not supplied by the utility, it was agreed that typical capacitance ranges based on Annex B of IEEE Std. C37.011-1994 would be used. Three equivalent capacitance values (minimum, maximum, and average) were determined. Table 4 shows an example of the collection of typical capacitance values for each bus section in the model.
Table 4 – Typical Capacitance Values Based on Annex B of IEEE Std. C37.011-1994

This process was repeated for all of the 345kV substation equipment in the system model. The minimum values of equivalent capacitance were used throughout the simulation process for both normal and contingency cases.
SIMULATION RESULTS
The TRV evaluation was conducted for the most severe operating conditions, including both three-phase ungrounded faults at the breaker terminal and SLFs. The study considered both normal cases where the system operates with all breakers and lines in service and contingency cases where the only one breaker is available to clear the fault.
Three-Phase Ungrounded Terminal Faults
The simulation results for the three-phase ungrounded fault clearing cases were summarized in tables similar to Table 5. The table shows the respective case identifier, the breaker number, the peak current that the breaker interrupted, this peak current as a percentage of the rated value (63kA), the peak TRV in kV, and a note to report whether the TRV was within the breaker’s capability envelope. A “YES*” note signifies that the TRV waveshape slightly exceeded the TRV capability for the first 10-50 μsec, but it met the TRV SLF capability. A “NO” note signifies that the TRV waveshape did not meet the TRV capability limit.
Table 5 – TRV Evaluation of Three-Phase Terminal Faults

Figure 3 and Figure 4 show several examples of the simulation results for the three-phase ungrounded fault clearing cases summarized in Table 5. Figure 3 shows the recovery voltage for breaker 4560 for Case A1 and Figure 4 shows the recovery voltage for breaker 4592 for Case A3. Each graph of TRV includes an overlay of the withstand capability.


Short-Line Faults
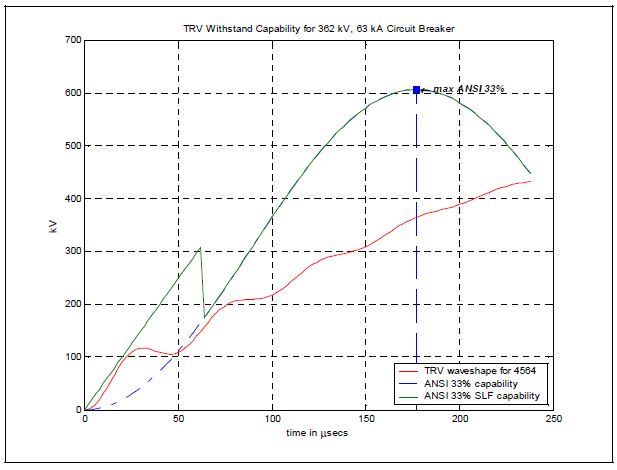
The simulation results for the SLF cases were recorded and compared to their respective TRV withstand and SLF capabilities. Figure 5 shows an example of the simulation results for a SLF clearing case. When compared to their respective terminal fault case, the magnitude of the peak fault current interrupted was lower due to the additional line impedance between the fault location and the breaker terminals. However, the RRRV was higher due to the traveling waves that oscillate between the fault location and breaker terminals.

As can be seen in Figure 5, the initial TRV for the case with no added capacitance exceeds the related SLF capability. Additional cases were then completed for each faulted transmission line to evaluate the effectives of various capacitance values for reducing the RRRV for each 345kV substation breaker.
The case with 15ηF added is shown in Figure 6.
SUMMARY
The engineering study included an evaluation of the TRV performance for various breaker operations for new 345 kV breakers. A number of observations and conclusions based on the simulation results included:
1.The TRV evaluation for the new 345kV circuit breakers in the substations was conducted for the most severe operating conditions, including clearing both three-phase ungrounded faults at the breaker terminal and SLF.
2.Three capacitance values, representing a range of equivalent capacitances for substation equipment, were determined based on information provided by the utility and from Annex B of IEEE Std. C37.011-1994.
3.The TRV evaluation considered both normal cases where the system operates with all breakers and lines in service and contingency cases where only one breaker is available to clear a fault. Both three-phase ungrounded and single-line-to-ground faults were evaluated for these conditions.
4.For a number of cases, the TRV waveshapes exceeded their related TRV capability limit for the first 10-50 μsec after the breaker had opened. These cases were then compared to their corresponding SLF capability.
5.For a number of normal and contingency cases, the TRV waveshapes exceeded their related capability limit. For these cases, the breaker’s withstand capability was exceeded due to the peak of the recovery voltage, rather than the initial rate-of-rise.
6.With respect to clearing SLF on lines leaving the 345kV substations (2 km from the substation), the simulations indicated that the initial RRRV will exceed the related SLF capability. One method for mitigating this condition is with the application of an additional capacitance on the line side of the breaker. This capacitance reduces the initial RRRV to within the related SLF capability.
7.Simulations were completed to evaluate the application of an additional capacitance on the line side of breakers. These cases used the same capacitance values at each of the line terminals. The additional capacitance of 15ηF/phase generally reduced the initial RRRVs to within the related SLF capability.
REFERENCES
- Study of 345kV Transient Recovery Voltages on the Illinois Power System, Sixth International Conference on Power System Transients (IPST), Montreal, Canada, June 19-23, 2005.
- PSCAD, Version 4.0.2 Professional, http://www.pscad.com.
- IEEE AC High Voltage Circuit Breakers Rated on a Symmetrical Current Basis – Preferred Ratings and Related Required Capabilities, IEEE Standard C37.06, May. 2000.
- IEEE Standard Rating Structure for AC High-Voltage Circuit Breakers, IEEE Standard C37.04, June. 1999.
- IEEE Application Guide for Transient Recovery Voltage for AC High Voltage Circuit Breakers Rated on a Symmetrical Current Basis, IEEE Standard C37.011, September. 1994.
RELATED STANDARDS
IEEE Std. C37.06, IEEE Std. C37.04, IEEE Std. C37.011
GLOSSARY AND ACRONYMS
TRV: Transient Recovery Voltage
RRRV: Rate of Rise of the Recovery Voltage
