Published by Electrotek Concepts, Inc., PQSoft Case Study: Common Power Quality Waveform Signatures, Document ID: PQS0901, Date: October 15, 2009.
Abstract: Power quality problems encompass a wide range of disturbances and conditions on utility and customer power systems. They include everything from very fast transients (microseconds) to long duration (hours) outages. Problems also include steady state (e.g., harmonic distortion) and intermittent (e.g., voltage flicker) phenomena. This wide variety of conditions makes the development of standard measurement and analysis procedures very difficult. Therefore, it is beneficial to characterize power quality measurements and their related problems into common categories using standard data formats.
This case study presents a collection of representative waveforms for various power system fault and power quality events, including voltage sags, momentary interruptions, voltage swells, harmonics, capacitor switching transients, transformer energizing transients, and ferroresonance.
INTRODUCTION
The term power quality refers to a wide variety of different parameters that characterize the voltage and current at a given time and at a given point on the power system. It is important to have a clear understanding of these parameters and the variations in them that can cause customer problems. Definitions are required to develop a method of categorizing problems so that conditions at different sites can be compared and analyzed.
This case study refers to power quality variations and disturbances. Disturbances signify onetime, momentary events while power quality variations refer to the full range of conditions that can occur, including variations in steady-state voltage and current characteristics (e.g., harmonic distortion). There are currently no clearly accepted definitions for many categories of power quality variations because different manufacturers of measurement equipment often use non-standard definitions to categorize events. In addition, individual industry standards address only a small segment of the total range of power quality variations. Several important factors that should be considered when using power quality categories include:
− The characteristics of the power quality variation. Important characteristics include the magnitude, frequency content, and duration. Some combination of these characteristics can be used to describe virtually any power quality variation.
− The cause of the power quality variation. The condition could be caused by a switching event, lightning, a system fault, or operation of customer equipment. It is important to consider the possible causes of power quality variations in each category.
− Requirements for measurement. Some types of power quality variations can be characterized with simple voltmeters, ammeters, or strip chart recorders. Other conditions require special-purpose disturbance monitors or harmonic analyzers. The characteristics of the power quality variation in each category determine the requirements for monitoring.
− Methods to improve the power quality. Solutions to power quality problems depend on the type of power quality variation involved. Transient disturbances can often be controlled with surge arresters while momentary interruptions could require an uninterruptible power supply (UPS) system for equipment protection. Harmonic distortion may require special-purpose harmonic filters.
− Existing standards and power quality terminology. Existing terminology has become almost standard in describing many types of power quality variations. This terminology has resulted from the definitions used to describe power quality by popular monitoring equipment manufacturers and from the development of standards for some aspects of power quality. When developing a new set of definitions for power quality variations, the existing terminology should be carefully considered.
POWER QUALITY CATEGORIES
The relative importance of a particular category of power quality phenomena for a specific customer will depend on the type of installed electrical equipment. The type of interaction between customer equipment and the power quality phenomena – equipment damage, equipment/process trip, compromised product quality, etc. – and the frequency at which it occurs or could be expected to occur are also critical factors in the evaluation process once the cause has been identified. The range of power quality phenomena is defined by IEEE Std. 1159-1995: Recommended Practice for Monitoring Electric Power Quality (refer to Table 1) [1].
Approaches for resolving equipment or process problems related to each category of phenomena vary widely. Causes, impacts, and appropriate solutions for this range of electrical phenomena have been analyzed in numerous research and study efforts, resulting in the development of proven solution techniques for many common power quality problems.
These efforts have also contributed to a prioritization of the power quality phenomena categories. From the customer’s point of view, the most important problem categories:
− Have the highest negative impact on productivity
− Are difficult to diagnose and characterize
− Are more difficult and/or expensive to resolve
Using these criteria, research and case study investigations have identified the following categories of power quality phenomena to be of highest importance to customers:
− Transients, especially utility capacitor bank switching transients
− Harmonic distortion, especially resonance conditions
− Voltage variations, especially rms voltage sags and interruptions
This does not mean that there are never problems associated with other categories of power quality phenomena. Experience does indicate, however, that the majority of problems (especially from the customer’s perspective) are those listed above.
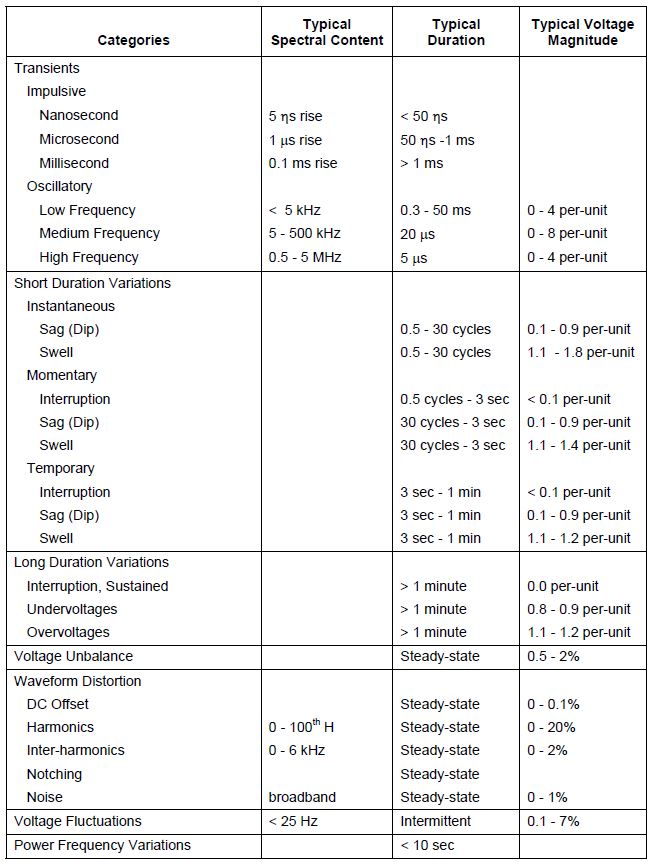
Table 1 defines power quality variation categories. Some of the categories also include subcategories for more accurate description of particular power quality variations. Three primary attributes are used to differentiate among the different categories and subcategories:
- Frequency components
- Magnitude
- Duration
These attributes are not equally applicable to all the categories of power quality variations. For instance, it is difficult to assign a duration to an oscillatory transient, and it is not useful to assign a spectral content to variations in the fundamental frequency magnitude (e.g., sags, swells, overvoltages, undervoltages, and interruptions). Each category is defined by the most important attributes for that particular power quality condition.
These characteristics and attributes are useful for evaluating measurement equipment requirements, system characteristics affecting the power quality variations, and possible measures to correct power quality problems.
This case study presents a number of representative waveforms for an assortment of power system fault and power quality events, which are grouped by the categories provided in IEEE Std. 1159-1995 and shown in Table 1.
Table 1 – Categories of Power System Electromagnetic Phenomena (source IEEE Std. 1159-1995)
POWER QUALITY DATA FORMATS
This case study illustrates a number of representative power quality event waveforms that are stored using the common data interchange formats PQDIF and COMTRADE. PQDIF [2] provides a recommended practice for a file format suitable for exchanging power quality related measurement and simulation data. COMTRADE [3] provides a common format for digital data records of power system fault, test, or simulation events.
PQDIF (IEEE Recommended Practice for the Transfer of Power Quality Data) is an IEEE standard (1159.3-2003) that was developed by the Working Group on Monitoring Electric Power Quality, which is part of the Power Quality Subcommittee of the T&D Committee. It defines a file format suitable for exchanging power quality related measurement and simulation data in a vendor-independent manner. A variety of simulation, measurement and analysis tools for power quality engineers are now available from many vendors. Generally, the data created, measured, and analyzed by these tools are incompatible between vendors. PQDIF provides a set of requirements and attributes for a power quality data interchange format. Key among these is the ability to represent data from a variety of sources (e.g., measured, simulated, or manually created), in the time, frequency, and probability domains.
COMTRADE (IEEE Standard Common Format for Transient Data Exchange for Power Systems) is an IEEE standard (C37.111-1999) first published by the Power System Relaying Committee in 1991. It was updated in 1999 and reaffirmed in 2005. It defines a common format for data files and an exchange medium used for the interchange of various types of fault, test, or simulation data for electrical power systems. The standard also describes the sources of transient data such as digital protective relays, digital fault recorders, and transient simulation programs (e.g., PSCAD/EMTP/ATP) and discusses the sampling rates, filters, and sample rate conversions for the transient data being exchanged.
A viewing program that is capable of reading, displaying, and manipulating PQDIF and COMTRADE files is required for processing the power quality waveforms that are presented in this case study. A free program TOP, The Output Processor® [4] has this capability. The program is widely used in the utility industry for visualizing data from a variety of simulation and measurement sources. Figure 1 shows an example power quality event waveform signature that was measured using a Dranetz-BMI 8010 PQNode. The waveform shows the three-phase voltage on a 25 kV distribution feeder during a SiC arrester failure.

REPRESENTATIVE POWER QUALITY WAVEFORM SIGNATURES
Power quality monitoring is used to characterize variations at various locations on utility and customer power systems. The length of the monitoring period is generally dependent on the nature of the power quality problem. For example, utility capacitor bank switching transients may be collected in several days, while harmonic distortion levels may need to be monitored for weeks, months, or even years to show the influence of load and seasonal variations. The current industry trend for power quality monitoring is fixed instruments that continuously monitor the power system.
Generally, it is advisable to begin monitoring as close as physically possible to the sensitive equipment being affected by the power quality variations. It is important that the monitor sees the same variations as the sensitive equipment. High-frequency transients, in particular, can be significantly different if there is significant separation between the monitor and the affected equipment. Another important monitoring location is the main service entrance. Transients and other voltage variations measured at this location can be experienced by all of the equipment in the facility. This is also the best indication of disturbances caused by the utility system (it is possible that disturbances at the service entrance are caused by events occurring within the facility). Monitoring site selection for diagnostic or evaluative monitoring is usually straightforward, being indicated by customer complaints, equipment failure reports, and other external factors.
This section includes a number of representative waveforms for various power system fault and power quality events, including voltage sags, momentary interruptions, voltage swells, harmonics, capacitor switching transients, transformer energizing transients, and ferroresonance. These waveforms all fall into one of the categories provided in IEEE Std. 1159-1995 (refer to Table 1) and are stored using either the PQDIF or COMTRADE formats. Each waveform includes background information regarding the source (e.g., measurement or simulation), cause, related utility or customer problem, and common solution.
Figure 2 shows a three-phase voltage sag waveform measurement for a remote three-phase fault on a distribution feeder. The magnitude of the resulting sag was approximately 60% for 9 cycles. The instantaneous voltage measurement was captured using a Dranetz-BMI 5530 DataNode and stored using the IEEE PQDIF file format. The customer power conditioning options for this event include UPSs and CVTs. The keywords for the waveform include sag and fault, while the slang terms that should be avoided include glitch, blink, wink, and outage.

Figure 3 shows a voltage rms trend during a distribution feeder momentary interruption sequence. The multiple reclosing interruptions, which are shown in per-unit, lasted approximately 1.2, 9.0, and 22.5 seconds respectively. The measurement was captured using a Dranetz-BMI 8010 PQNode and stored using the IEEE PQDIF file format. The customer power conditioning options for this event include UPSs and CVTs. The keywords for the waveform include interruption and fault, while the slang terms that should be avoided include glitch, wink, and outage.

Figure 4 shows a measured feeder voltage swell that occurred on the unfaulted phases close to a single line-to-ground fault on an overhead 34.5 kV distribution feeder. The swell was approximately 150%. The instantaneous voltage measurement was captured using a Dranetz-BMI 8010 PQNode and stored using the IEEE COMTRADE file format. The customer power conditioning options for this event include UPSs and CVTs. The keywords for the waveform include swell and fault, while the slang terms that should be avoided include glitch and surge.

Figure 5 shows a measured 13.8 kV, 740 amp fundamental, 0.75 displacement power factor arc furnace load current. The waveform is an 18-cycle snapshot of one operating point for the furnace. The instantaneous current measurement was captured using a Dranetz-BMI 5530 DataNode and stored using the IEEE PQDIF file format. The power conditioning options for this event include harmonic filters and SVCs. The keywords for the waveform include current distortion, while the slang term that should be avoided is dirty power.

Figure 6 shows the voltage on a customer secondary bus with moderate notching and distortion (VTHD ≈ 9%). It also shows a transient that was due to utility capacitor bank switching. The instantaneous voltage measurement was captured using a Dranetz-BMI 5530 DataNode and stored using the IEEE COMTRADE file format. The customer power conditioning options for this event include inductive chokes, and harmonic filters. The keywords for the waveform include notching and resonance, while the slang term that should be avoided is dirty power.
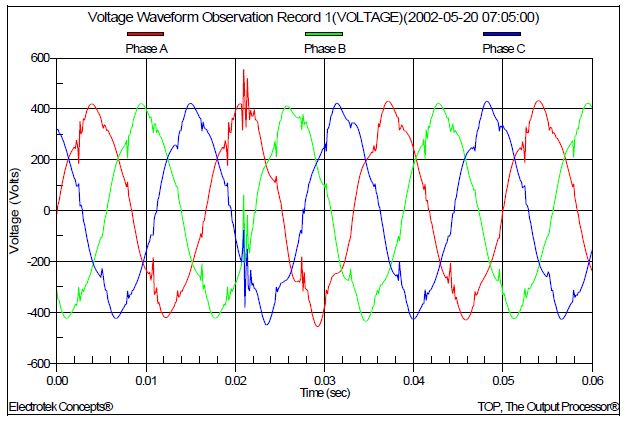
Figure 7 shows a 13.8 kV feeder current before-and-after energization of a 900-kVAr pole-mounted capacitor bank that creates a harmonic resonance that increases the current distortion (ITHD ≈ 13%). The instantaneous current measurement was captured using a Dranetz-BMI 8010 PQNode and stored using the IEEE PQDIF file format. The power conditioning options for this event include arresters and harmonic filters. The keywords for the waveform include capacitor and resonance, while the slang terms that should be avoided include surge, glitch, and spike.
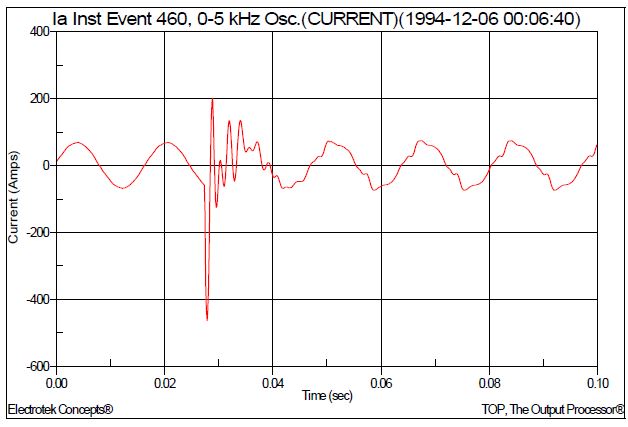
Figure 8 shows a 4.16 kV bus voltage waveform during utility capacitor bank switching. The resulting transient voltage was 1.35 per-unit, while the steady-state voltage rise was 1.2%. The instantaneous voltage measurement was captured using a Dranetz-BMI 8010 PQNode and stored using the IEEE PQDIF file format. The power conditioning options for this event include overvoltage control and arresters. The keywords for the waveform include oscillatory transient and overvoltage, while the slang terms that should be avoided include surge and spike.

Figure 9 shows a measured bus voltage waveform during a multiple restrike event on a 34.5 kV capacitor bank. The worst-case transient voltage was approximately 1.55 per-unit. The instantaneous voltage measurement was captured using a Dranetz-BMI 8010 PQNode and stored using the IEEE COMTRADE file format. The power conditioning options for this event include arresters. The keywords for the waveform include restrike and overvoltage, while the slang terms that should be avoided include surge and spike.

Figure 10 shows the inrush current waveform for a distribution transformer energizing. Transformer inrush current typically decays over a period of about one second. The instantaneous current measurement was captured using a Dranetz-BMI 5530 DataNode and stored using the IEEE COMTRADE file format. The power conditioning options for this event include overcurrent protection, fuses, and reclosers. The keywords for the waveform include transient and overcurrent, while the slang terms that should be avoided include surge, and spike.
Figure 11 shows a phase-to-phase feeder voltage during a ferroresonance event that was caused by an unbalanced switching operation. The peak voltage was approximately 1.42 per-unit. The instantaneous voltage measurement was captured using a Dranetz-BMI 8010 PQNode and stored using the IEEE COMTRADE file format. The power conditioning options for this event include three-phase switches and secondary loads. The keywords for the waveform include ferroresonance and overvoltage, while the slang term that should be avoided is surge.

Figure 12 shows the simulated voltage waveform for a distribution system ferroresonance event on a 13.8 kV feeder. The peak voltage is approximately 2.89 per-unit. There were no arresters included in the model. The instantaneous voltage was created using an EMTP program and stored using the IEEE COMTRADE file format. The power conditioning options for this event include three-phase switches and secondary loads. The keywords for the waveform include ferroresonance and overvoltage, while the slang term that should be avoided is surge.
SUMMARY AND CONCLUSIONS
Power quality problems encompass a wide range of disturbances and conditions on utility and customer systems, ranging from very fast transients to long duration outages. Problems also include steady state and intermittent phenomena, such as harmonic distortion and voltage flicker. This wide range of conditions makes the development of standard measurement and analysis procedures difficult. It is therefore beneficial to characterize power quality measurements and their related problems into common categories using standard data formats.
This case study includes a summary of power quality categories and characteristics. These characteristics and attributes are useful for evaluating measurement equipment requirements, system characteristics affecting the power quality variations, and possible measures to correct power quality problems.
This case study also includes an introduction to the commonly used data interchange formats PQDIF and COMTRADE and a collection of representative waveforms for various power system fault and power quality events. Each waveform includes a brief summary regarding the source (e.g., measurement or simulation), cause, related utility or customer problem, and common solution. Keywords and slang terms that should be avoided are also included with each waveform.
REFERENCES
- IEEE Std. 1159-1995, IEEE Recommended Practice on Monitoring Electrical Power Quality, ISBN 1-5593-7549-3.
- IEEE Std. 1159.3-2003, IEEE Recommended Practice for the Transfer of Power Quality Data, ISBN 0-7381-3578-X.
- IEEE Std. C37.111-R2005, IEEE Standard for Common Format for Transient Data Exchange (COMTRADE) for Power Systems, ISBN 0-7381-1666-1.
- TOP, The Output Processor®, Electrotek Concepts, Inc., http://www.pqsoft.com/top/
RELATED STANDARDS
IEEE Std. 1159.3, IEEE Std. C37.111, IEEE Std. 1159
GLOSSARY AND ACRONYMS
CVT: Constant Voltage Transformer
UPS: Uninterruptible Power Supply
