Published by Electrotek Concepts, Inc., PQSoft Case Study: General Reference – Approach to Systems Monitoring, Document ID: PQS0310, Date: April 16, 2003.
Abstract: Power quality monitoring is an essential service many utilities perform for their industrial and other key commercial customers. Because of the technology and software now available, this monitoring is highly effective. Not only can a monitoring system provide information about the quality of the power and the causes of power system disturbances, but also it can identify conditions throughout the system before they cause problems. Power quality problems are not necessarily limited to the utility power system. Many surveys have shown that the majority of problems are localized within customer facilities. Given this fact, monitoring provides a key opportunity for a utility to protect its reputation and improve its relationship with customers.
This document provides an overview of the approach to systems monitoring.
APPROACH TO SYSTEMS MONITORING
Power quality monitoring is an essential service many utilities perform for their industrial and other key commercial customers. Because of the technology and software now available, this monitoring is highly effective. Not only can a monitoring system provide information about the quality of the power and the causes of power system disturbances, but also it can identify conditions throughout the system before they cause problems. Power quality problems are not necessarily limited to the utility power system. Many surveys have shown that the majority of problems are localized within customer facilities. Given this fact, monitoring provides a key opportunity for a utility to protect its reputation and improve its relationship with customers.
Monitoring system functions include extensive data processing capabilities, easily understood reporting, and universal sharing of information. These systems may be tailored to specific customer needs. The scope can vary from a few monitoring devices to several hundred. Information may be made available through the Internet or in-house via a company network. Reports can be customized to produce pertinent, vital information in a consistent format. Utility and/or customer requirements are the only limiting factor for a system’s flexibility and scope.
An essential requirement for any monitoring system is easy access and analysis of a large volume of data. This involves the ability to generate automated reports and the ability to distribute the data to utility personnel or customers.
Components of a Monitoring System
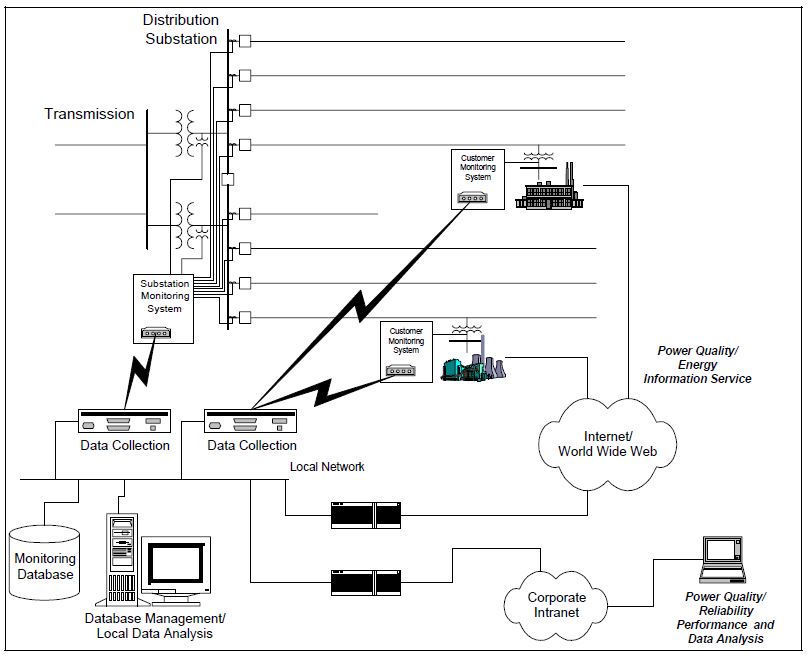
Power quality monitoring systems are structured using basic hardware components. There is no limit to a system’s size. Essential components (illustrated in Figure 1) for the monitoring system include
- Power disturbance monitors
- Mass disk storage for data
- Computer workstations
- Computer for downloads
- Web or company Intranet server
- Analysis software
Objectives for a Power Quality Monitoring Project
The objectives for a monitoring program determine the choice of measurement equipment and triggering thresholds, the methods for collecting data, the data storage and analysis requirements, and the overall level of effort required. Several general classifications for monitoring objectives include:
- Monitoring to characterize system performance. This is the most general requirement. A power producer may find this objective important if it has the need to understand its system performance and then be able to match that system performance with the needs of customers. System characterization is a proactive approach to power quality monitoring. By understanding the normal power quality performance of a system, a provider can quickly identify problems and can offer information to its customers to help them match their sensitive equipment’s characteristics with realistic power quality characteristics.
- Monitoring to characterize specific problems. Many power quality service departments or plant managers solve problems by performing short-term monitoring at specific customers or at difficult loads. This is a reactive mode of power quality monitoring, but it frequently identifies the cause of equipment incompatibility that is the first step to a solution.
- Monitoring as part of an enhanced power quality service. Many power producers are currently considering additional services to offer customers. One of these services would be to offer differentiated levels of power quality to match the needs of specific customers. A provider and customer can together achieve this goal by modifying the power system or by installing equipment within the customer’s premises. In either case, monitoring becomes essential to establish the benchmarks for the differentiated service and to verify that the utility achieves contracted levels of power quality.
Power quality encompasses a wide variety of conditions on the power system. Important disturbances can vary in duration from very high frequency impulses caused by a lightning stroke, to long-term overvoltages caused by a regulator tap switching problem. The range of conditions that a power quality instrument must characterize creates problems both in terms of the monitoring equipment complexity and in the data collection requirements.
The methods of characterizing are important for the monitoring requirements. For instance, characterizing most transients requires high frequency sampling of the actual waveform. Characterization of voltage sags involves a plot of the rms voltage versus time. Outages can be defined just by a duration. Monitoring to characterize harmonic distortion levels and normal voltage variations requires steady-state sampling with trending of the results over time.
It may be prohibitively expensive to monitor all the different types of power quality variations at each location. The priorities for monitoring should be determined up front based on the objectives of the effort. Projects to benchmark system performance should involve a reasonably complete monitoring effort. Projects designed to evaluate compliance with IEEE Standard 519 for harmonic distortion levels may only require steady-state monitoring of harmonic levels. Other projects focused on specific industrial problems may only require monitoring of rms variations, such as voltage sags or momentary interruptions.
Monitoring Equipment
There are many different types of monitoring equipment that form part of a power quality monitoring project. Four basic categories of equipment are often utilized:
1. Digital Fault Recorders (DFR). These may already be in place at many substations. DFR manufacturers do not design the devices specifically for power quality monitoring. However, a DFR will typically trigger on fault events and record the voltage and current waveforms that characterize the event. This makes them valuable for characterizing rms disturbances, such as voltage sags, during power system faults. DFRs also offer periodic waveform capture for calculating harmonic distortion levels.
2.Voltage Recorders. Power providers use a variety of voltage recorders to monitor steady-state voltage variations on distribution systems. These devices are becoming increasingly sophisticated and fully capable of characterizing momentary voltage sags and even harmonic distortion levels. Typically, the voltage recorder provides a trend that gives the maximum, minimum, and average voltage within specified sampling window (for example, 2 seconds). With this type of sampling, the recorder can characterize a voltage sag magnitude adequately. However, it will not provide the duration with a resolution less than two seconds.
3.In-Plant Power Monitors. It is now common for monitoring systems in industrial facilities to have some power quality capabilities. These monitors, particularly those located at the service entrance, can be used as part of a utility monitoring program. Capabilities usually include waveshape capture for evaluation of harmonic distortion levels, voltage profiles for steady-state rms variations, and triggered waveshape captures for voltage sag conditions. It is not common for these instruments to have transient monitoring capabilities.
4.Special-Purpose Power Quality Monitors. The monitoring instrument developed for the EPRI Distribution Power Quality (DPQ) Project was specifically designed to measure the full range of power quality variations. This instrument features monitoring of three-phases and current plus neutral. A 14-bit A/D board provides a sampling rate of 256 points per cycle for voltage, and 128 points per cycle for current. The high sampling rate allowed detection of voltage harmonics as high as the 100th in order and current harmonics as high as the 50th. Most power quality instruments can record both triggered and sampled data. Triggering should be based upon rms thresholds for rms variations and on waveshape for transient variations. Simultaneous voltage and current monitoring with triggering of all channels during a disturbance is an important capability for these instruments. Power quality monitors have proved suitable for substation, feeder locations, and customer service entrance locations.
Analysis of Measurement Data
Analysis of power quality measurement data is an important component of the monitoring project. This section presents some basic methods of summarizing power quality phenomena, including:
- probability distributions
- correlations
- time trends
Distributions
Distributions can be illustrated as histograms of event incidence (frequency, relative frequency or cumulative frequency) versus time interval, event characteristic interval, or site descriptor interval. For example, Figure 2 shows a distribution of steady-state rms voltage measurements. Each bar indicates frequency – the number of samples that possess the characteristic value indicated at the base of the bar. The line plots cumulative frequency, the percent of all samples with the characteristic value less than or equal to the value indicated on the x-axis.

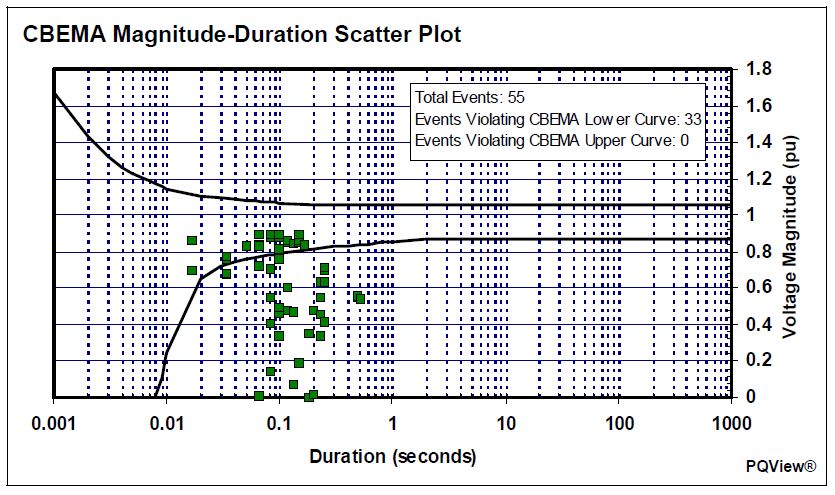
Correlations
A correlation can be visualized graphically as a scatter plot of an event characteristic value or event incidence versus an event characteristic value or a site descriptor value. The most common correlation used for power quality data is the magnitude duration plot which shows voltage variations over a given time period. Events are plotted on a grid with the horizontal axis representing event duration, and the vertical axis representing the maximum (or minimum) rms level recorded during the event. The curves superimposed on the magnitude duration plot in Figure 3 indicate typical computer equipment voltage tolerance, as defined in ANSI/IEEE Standard 446.
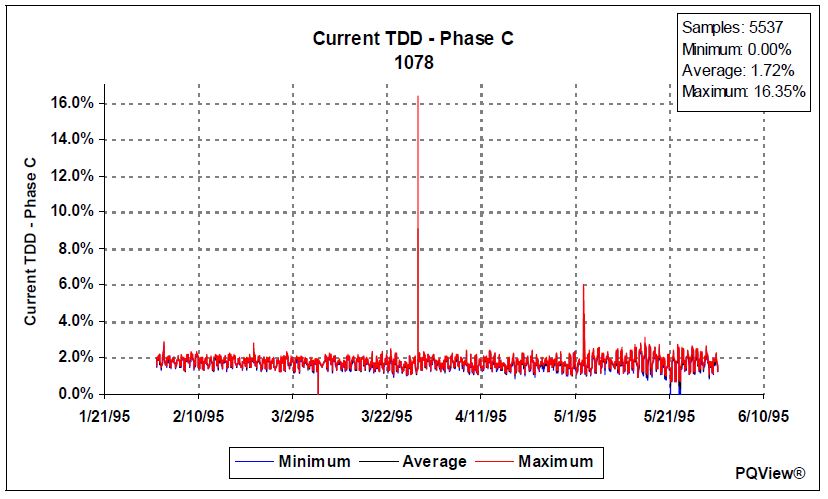
Time Trends
A time trend is a plot of an event characteristic versus time. For example, Figure 4 shows current TDD (total demand distortion) variation over several months at a single monitoring site.
Data Analysis Tools
Most of the graphs illustrated on the previous pages were developed with computer analysis tools, such as spreadsheets, statistical programs, databases, and spreadsheets. A software package for statistical analysis of power quality measurement data was developed under the EPRI DPQ Project. The capabilities of this program, called PQView®, are summarized in Table 1.
Table 1 – PQView Data Analysis Functions
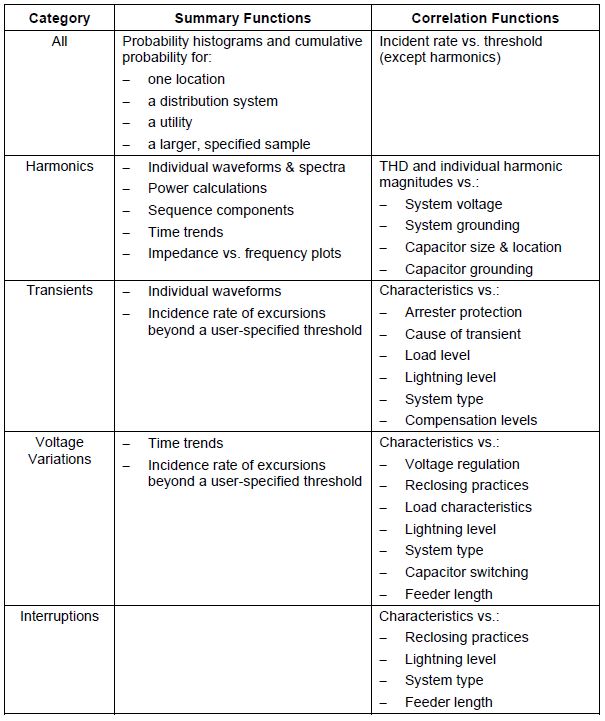
PQView® is a database software application developed by Electrotek Concepts, Inc. that is designed to store and analyze large quantities of power quality-related disturbance and steady-state measurement data. Featuring data management tools that can quickly characterize this data, PQView includes statistical analysis and plotting tools that can provide single- or multiple-site analyses for power systems.
PQView enables users to organize data from a variety of instruments, such as power quality monitors, voltage recorders, in-plant monitors, and fault recorders. It also stores site characteristics and event information. This information is valuable not only in establishing a disturbance’s source, but also the customer equipment sensitivity to power system problems.
PQView brings all this information together in one relational database and provides the means to automate both the loading of new data and the generation of monitoring reports. PQView comes with a base set of reports that provide information on raw measurements, detailed statistical analysis, and executive summaries. These reports enable the user to reach all of the audiences interested in the results and allow reports to be customized as needed.
Using technology developed under EPRI sponsorship, PQView combines powerful features in a user-friendly interface. It utilizes Microsoft® Access as its foundation, providing a database engine, development tools, support for database editing and security, and integration with other Microsoft Windows® applications such as word processing and spreadsheet programs. PQView consists of two major components, the Power Quality Data Manager (PQDM), which creates, loads, and edits power quality databases; and the Power Quality Data Analyzer (PQDA), which generates reports and analyzes the data.
REFERENCES
IEEE Standard 1159. IEEE Recommended Practice on Monitoring Electric Power Quality.
Measuring Voltage and Current Harmonics in Distribution Systems, M. F. McGranaghan, J. H. Shaw, R. E. Owen, IEEE Paper 81WM126-2, November 1981.
A Guide to Monitoring Power Quality, EPRI TR-103208, Project 3098-01, Electric Power Research Institute, April 1994.
RELATED STANDARDS
IEEE Standard 1159
IEEE Standard 1346
IEEE Standard 1250
IEEE Standard 519
GLOSSARY AND ACRONYMS
DFT: Digital Fault Recorders
IEEE: Institute of Electrical and Electronics Engineers
PQDA: Power Quality Data Analyzer
PQDM: Power Quality Data Manager
TDD: Total Demand Distortion
UPS: Uninterruptible Power Supply
