Published by Electrotek Concepts, Inc., PQSoft Case Study: Monitoring Objectives and Screening Procedures – Distribution Feeder Capacitor Bank Application, Document ID: PQS0708, Date: January 1, 2007.
Abstract: Power quality problems encompass a wide range of disturbances and conditions on utility and customer power systems. They include everything from very fast transient overvoltages to long duration outages. Power quality problems also include steady-state phenomena such as harmonic distortion, and intermittent phenomena, such as voltage flicker. This wide variety of conditions that make up power quality makes the development of standard measurement procedures and equipment very difficult. This case study introduces the subject of monitoring objectives and screening procedures and provided a distribution feeder capacitor bank application monitoring example.
MONITORING OBJECTIVES AND SCREENING PROCEDURES
Power quality monitoring is used to characterize harmonics and transients (and other variations) at various locations on utility and customer power systems over a period. The length of the monitoring period is dependent on the nature of the power quality problem. For example, capacitor bank switching transients may be collected in several days, while harmonic distortion levels may need to be monitored for weeks, months, or even years to show the influence of load and seasonal variations. The current trend for power quality monitoring is fixed instruments that continuously monitor the power system.
The objectives of a monitoring program determine the choice of measurement equipment, method of collecting data, disturbance thresholds, data analysis requirements, and the overall effort required. Monitoring objectives generally fall into one of the following categories:
− Diagnostic: Monitoring to characterize power quality problems that are affecting an existing customer, or that may affect a new facility.
− Evaluative: Identify critical design, construction, and environmental parameters that affect power quality; appraise measures to improve power quality; or refine power quality modeling techniques.
− Predictive: Estimate existing levels of power quality on the system.
Generally, it is difficult to design a power quality monitoring program that will satisfy all of these goals. This is due to the site selection criteria conflict. Prediction of system-wide power quality is based on a random selection of monitoring locations. Data from randomly selected sites may be used to diagnose some power quality problems, but diagnostic monitoring is clearly more effective when monitoring locations are targeted – using customer complaints, equipment failure reports, etc. Conversely, data from targeted sites, even if those sites are large in number and well dispersed throughout the system, cannot legitimately be used to extrapolate system-wide power quality levels. A statistical monitoring program may produce, as a by-product, data that is useful for an evaluative effort. However, as with diagnostic monitoring, evaluative monitoring is most effective when situation-specific monitoring sites are targeted.
The objectives of a monitoring program also influence equipment requirements because at present, no instrument is completely satisfactory for performing all types of monitoring. Diagnostic/evaluative monitoring can usually be conducted with portable single-purpose instruments, while predictive monitoring requires permanently installed instruments that can measure the whole range of power quality phenomena.
Screening procedures for characterizing overall power quality levels for a particular utility or customer system include:
− Identify the power quality phenomena of concern. Examples of these include capacitor bank switching voltage and current transients, harmonic distortion, voltage sags and interruptions, etc. The types of disturbances that will be monitored influence the selection of monitoring equipment, transducers, and monitoring locations.
− Identify the system parameters that may affect the disturbance magnitudes and frequencies. Examples of utility system parameters include radial or network feeders, overhead vs. underground, transformer connections, and power factor correction. Examples of customer system parameters include load characteristics, wiring, and grounding practices, protection practices, and power factor correction. Additional factors may include lightning levels, trees or animals, maintenance practices, or construction activity.
− Characterize power quality variations as a function of important system parameters. This requirement will influence the overall monitoring plan and data collection requirements.
− Compare power quality variations on the system with results from published standards or national monitoring efforts. This will provide a benchmark for evaluating the level of concern associated with each type of disturbance.
Screening procedures for a diagnostic evaluation to determine a particular power quality problem for a utility or customer facility include:
− Characterize the problem – which equipment is mis-operating or failing.
− Correlate problems with changes in the system, such as motor starting, capacitor bank switching, operation of nonlinear loads, etc.
− Characterize the magnitudes, durations, and frequencies of the disturbances causing the problem. This will usually require monitoring at different voltage levels – distribution system, customer service entrance, and at the affected equipment.
− Identify possible solutions. Characterizing problems and causes will lead to a range of possible solutions.
FEEDER CAPACITOR BANK APPLICATION
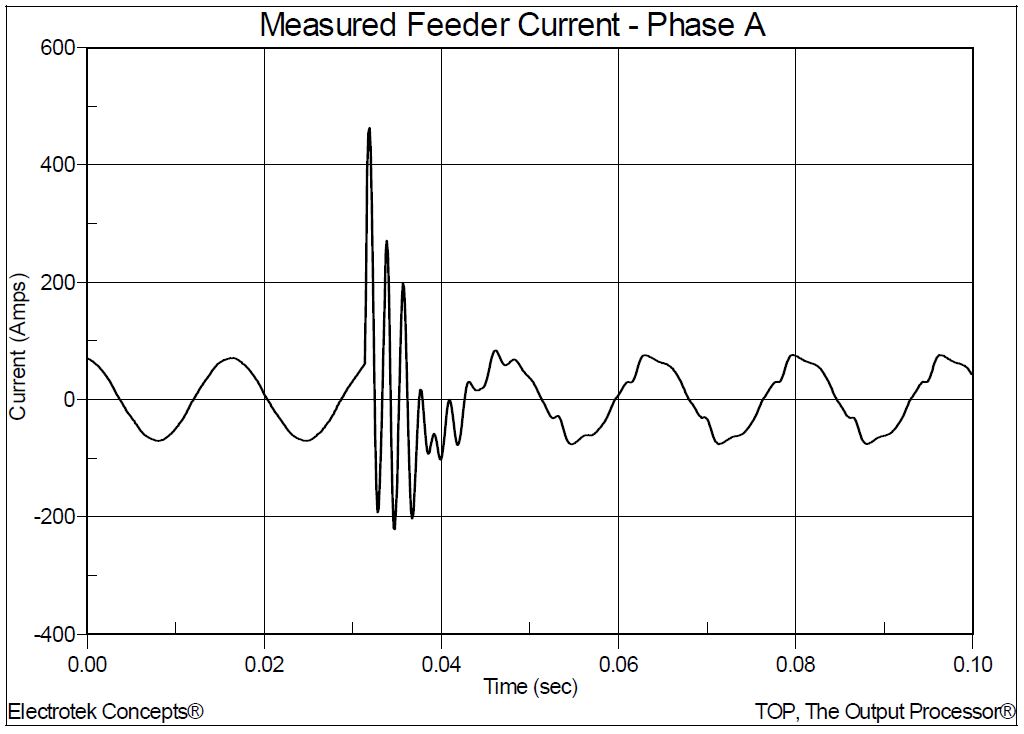
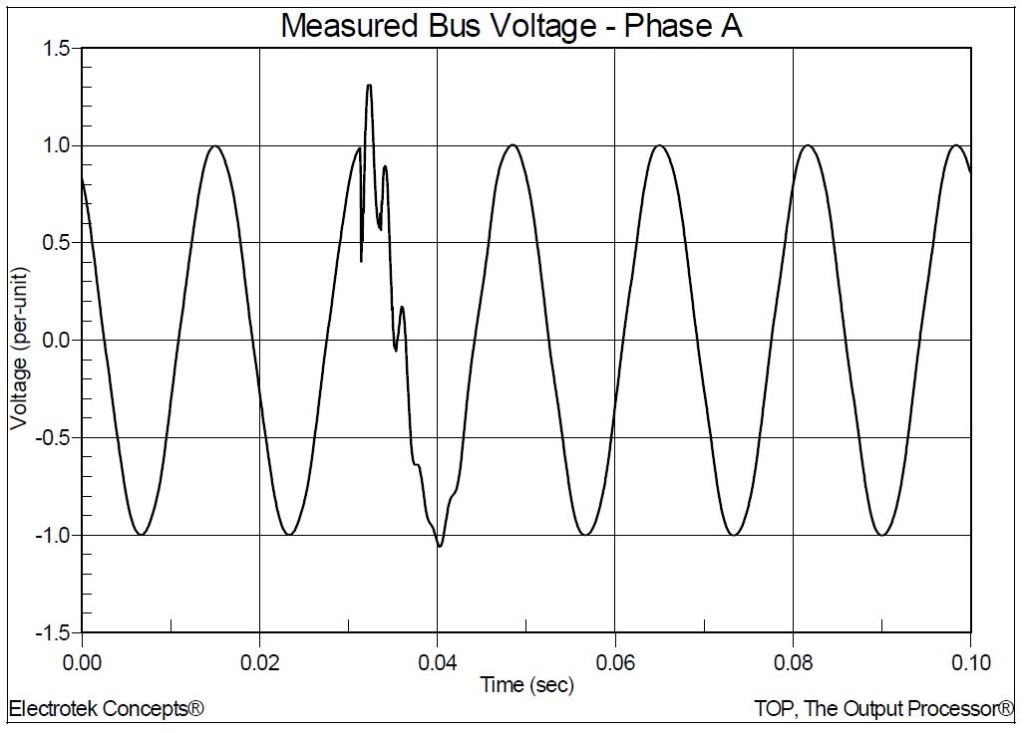
A power quality monitoring example specific to a distribution capacitor bank application is shown in the following four figures. Figure 1 shows a 13.8kV distribution feeder current and Figure 2 shows the bus voltage before and after energization of a pole-mounted 900 kVAr capacitor bank. The resulting transient overvoltage is approximately 1.3 per-unit (130%) and the steady-state voltage rise is approximately 1.2%.
Insertion of the capacitor bank creates a harmonic resonance condition on the feeder, thereby increasing the harmonic current distortion recorded by the power quality monitor. The harmonic current distortion before the capacitor bank is energized is approximately 1.8% and the distortion after energization is approximately 11.8%. A spectral analysis of the harmonic current waveform after energization of the capacitor bank shows that the highest harmonic is the 9th.
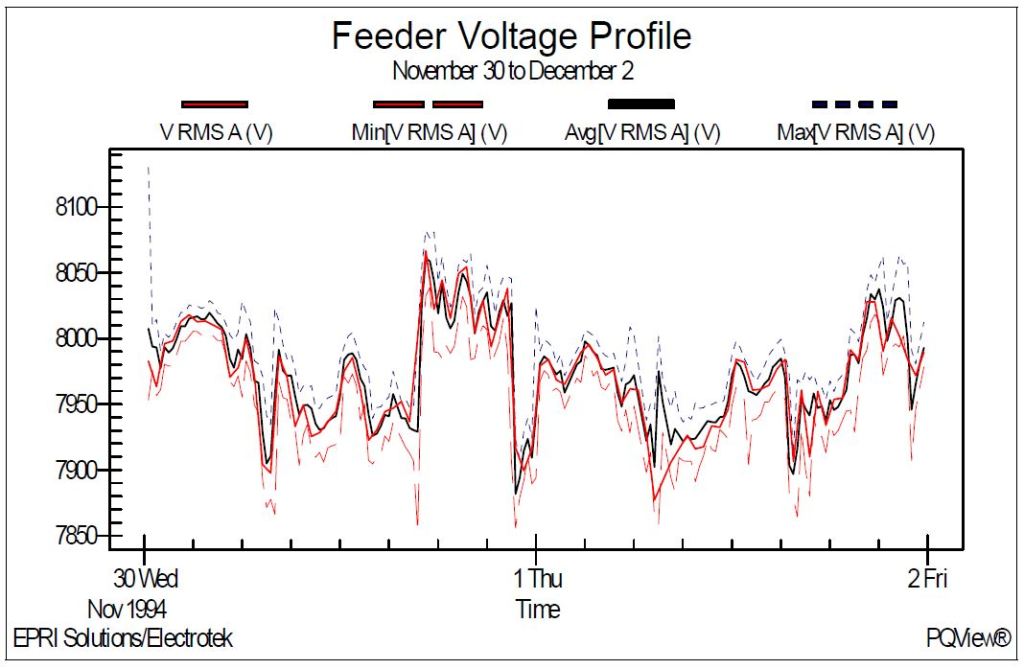
Figure 3 shows the rms voltage trend for the same feeder for a two day period that includes the energization of the feeder capacitor bank. The trend shows the corresponding steady-state voltage rise when the capacitor bank is energized.
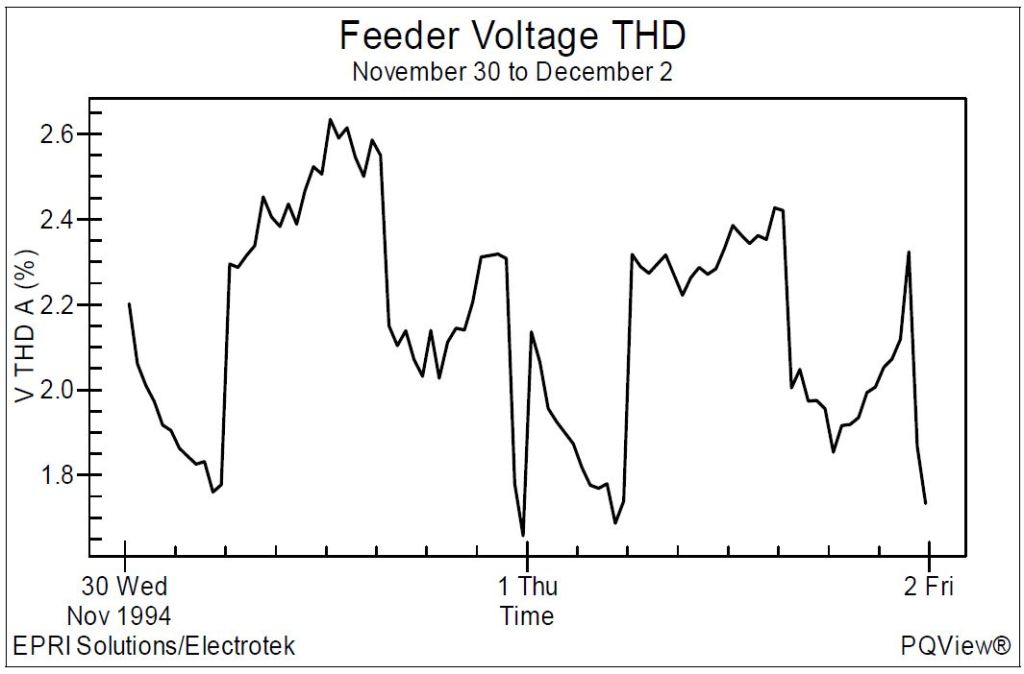
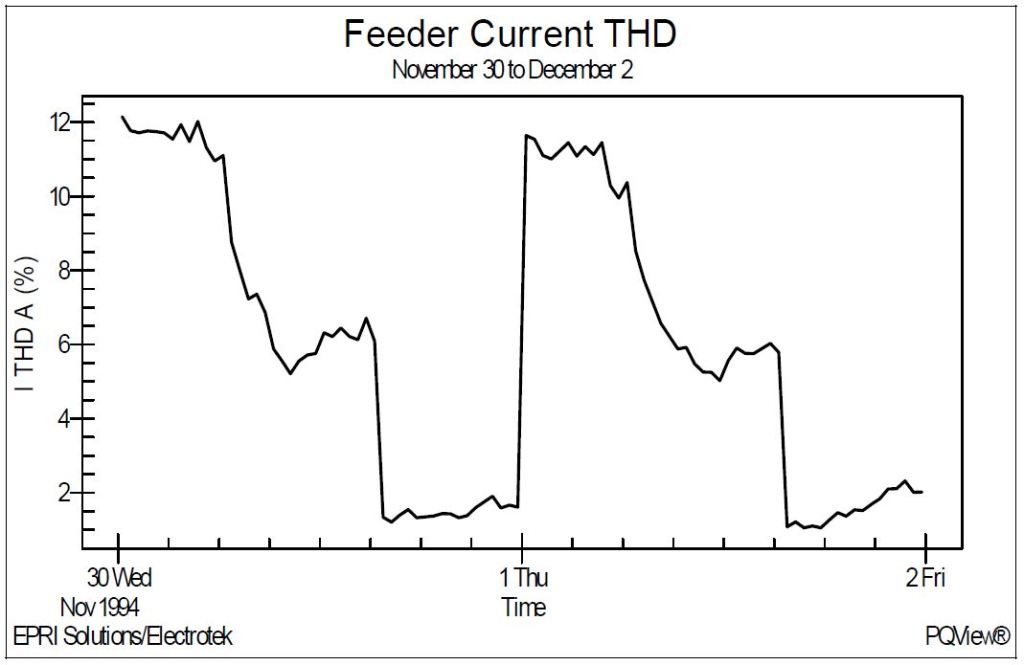
Figure 4 shows the voltage distortion trend and Figure 5 shows the current distortion trend for the same feeder for the same two day period that includes the energization of the feeder capacitor bank. The current distortion before the capacitor bank is energized is approximately 1.8% and the distortion after energization is approximately 11.8%.
SUMMARY
Power quality problems encompass a wide range of disturbances and conditions on utility and customer power systems. They include everything from very fast transient overvoltages (microsecond) to long duration outages (hours or days). Power quality problems also include steady-state phenomena such as harmonic distortion, and intermittent phenomena, such as voltage flicker. This wide variety of conditions that make up power quality makes the development of standard measurement procedures and equipment very difficult. This case study introduces the subject of monitoring objectives and screening procedures and provided a distribution feeder capacitor bank application monitoring example.
REFERENCES
IEEE Standard 1159. IEEE Recommended Practice on Monitoring Electric Power Quality.
Measuring Voltage and Current Harmonics in Distribution Systems, M. F. McGranaghan, J. H. Shaw, R. E. Owen, IEEE Paper 81WM126-2, November 1981.
A Guide to Monitoring Power Quality, EPRI TR-103208, Project 3098-01, Electric Power Research Institute, April 1994.
RELATED STANDARDS
IEEE Standard 1159
IEEE Standard 1346
IEEE Standard 1250
IEEE Standard 519
GLOSSARY AND ACRONYMS
DFT: Digital Fault Recorders
IEEE: Institute of Electrical and Electronics Engineers
PQDA: Power Quality Data Analyzer
PQDM: Power Quality Data Manager
TDD: Total Demand Distortion
UPS: Uninterruptible Power Supply
