Addressing Evolving Customer Technologies and an Increasingly Complex Power Grid
Published by Electric Power Research Institute (EPRI), Inc. Document ID: 3002022396, March 2022.

Introduction
Over the past 50 years, the concept of power quality (PQ) has evolved from being an unknown and undefined concept to being understood as a fundamental component of grid performance, utility economics, and customer satisfaction.
Until the 1970s, most electrical loads were linear and could ride through most grid voltage and current variations. The emergence of microprocessors, process controls, and other equipment sensitive to voltage and current variations, as well as equipment that caused PQ
variations, resulted in an entirely new technology discipline focused on the compatibility between the grid and the devices connected to it. This concept of compatibility is at the heart of PQ issues and research.
While industrial facilities may have the most significant PQ issues, PQ concerns can be important for any customer. For instance, voltage variations caused by large load variations, such as when motors start or when arc furnaces are in use, may cause lights to flicker for customers over a wide area. While light flickers are not as much of a concern these days with LED lights that have their own power supplies, voltage sags occurring over wide areas when there is a fault on the grid can potentially affect a diverse range of equipment and
processes. Consumer electronic devices, like televisions, computers, and now electric vehicle chargers, can affect the grid and other customers by causing harmonic distortion.
These types of issues have been the subject of detailed laboratory and field investigations conducted by EPRI’s PQ research program since the 1980s in coordination with other investigators around the world. EPRI’s PQ research has helped raise awareness of this important topic while providing solutions to utilities. As EPRI celebrates its fiftieth anniversary in 2022, it is timely to take a short look at the history of the PQ research program and related activities in the industry as a whole new set of compatibility challenges emerge.
This white paper attempts to accomplish three things:
- Provide a timeline and overview of selected historical PQ developments and events.
- Offer a starting point for discussions on the topic. In examining this history, lessons learned may be useful when looking for solutions to current and future PQ issues.
- Discuss new challenges in the increasingly complex grid environment associated with new technologies and system configurations that are characteristic of the energy transition.
A PQ problem is any power condition manifested in voltage, current, or frequency deviations that results in the failure or maloperation of customer equipment [8]. These problems can include transients, flickers, voltage sags and swells, and harmonic distortion.
The Concept of Compatibility
The concept of “compatibility” is key to virtually all PQ investigations. To achieve compatibility, one must understand the causes of PQ variations (or emissions) and how these can result in voltage variations that can affect other equipment (interaction of emissions with the system impedance characteristics). Equipment immunity levels must be selected to make sure that equipment can operate properly in the presence of “normal” PQ variations. System variations and equipment immunity levels are both probabilistic phenomena, so achieving compatibility is a probabilistic function as well (Figure 1). This concept of compatibility was best described as part of the International Electrotechnical Commission (IEC) 61000 series of standards, first drafted in the 1990s, which addresses the full range of PQ issues from emissions to immunity, from to measurements to testing. Much research has gone into trying to gain an understanding of the relationship between system variations and equipment immunity levels, the economics of PQ impacts, and solutions to problems when they arise.

Providing the Foundation
Research into PQ events starts with understanding the phenomena associated with PQ variations and impacts. A few of the industry leaders and the publications that resulted from their work are referenced here as foundational in creating a basic understanding
Francois Martzloff—National Institute of Standards and Technology
Early PQ problems often involved transient voltages from lightning and system switching affecting equipment, especially as electronic equipment started to become more common. Transient voltage measurements, transient protection, and grounding practices were implemented to avoid failures due to transient voltages. Francois Martzloff (Figure 2) at the National Institute of Standards and Technology (NIST) was a leader in characterizing these transient voltage concerns, determining how to measure them, and protecting equipment from them. In 1991, Martzolff pulled together state-of-the-art references on surge protection as part of NISTIR 4657 [1].

This early work was sponsored by the key organizations that were already working on the range of PQ issues at the time, including:
- Computer and Business Equipment Manufacturers Association (CBEMA)
- EPRI
- Institute of Electrical and Electronics Engineers (IEEE) Standards Coordinating Committee 22 on Power Quality
- IEEE Surge Protective Devices Committee
Harmonics—Roger Dugan, Mack Grady, Erich Gunther, Mark Halpin
Concerns for distortion due to nonfundamental components of the voltage and current and the potential for resonances at these higher frequencies were understood since the beginning of alternating current systems. Charles Steinmetz [2] first described these concerns, which were soon to become known as harmonics. The mathematical foundation for characterizing harmonics goes back to Jean-Baptiste Joseph Fourier [3] and the concept of Fourier analysis to represent a signal by a superposition of its harmonic components. Harmonic concerns became more pronounced as electronic equipment became more prevalent in the 1980s. In this decade, major advances were made in harmonic analysis methods and in standards for evaluating compatibility (such as IEEE 519 and IEC 61000-3-2). Roger Dugan, working on an EPRI project in the late 1970s, developed one of the first harmonic analysis tools, in parallel to work at Purdue by Mack Grady. There have been many advancements to these tools over the years, in particular by leaders like Erich Gunther. Mark Halpin took this work and led its incorporation into standards.
Harmonics are sinusoidal voltage or current waveforms whose frequency is an integer multiple of the system frequency (60 Hz in U.S. systems). Periodically distorted waveforms, which often are results from the use of nonlinear loads, can be mathematically described as the sum of ideal waveforms of the fundamental frequency and its harmonics [27].
Voltage Sags—Tom Key, Math Bollen, Dan Sabin
Short-duration voltage variations, known as voltage sags, became one of the most important PQ concerns as industrial processes became automated and the controls for these processes began to include electronic equipment that could be affected by these short voltage variations. CBEMA did some of the early work in 1977 to define the concept of characterizing voltage sags by their magnitude and duration so that they could be compared with the ride-through characteristics of equipment. The CBEMA curve is discussed later in this white paper, including the coordination with Tom Key and the EPRI Power Electronics Application Center (EPRI-PEAC). However, these concepts were advanced significantly by Math Bollen, who wrote the book on voltage sags [4], and Dan Sabin, who developed analytical tools for analyzing PQ measurements that became part of standard utility PQ investigations.
Measuring Power Quality—Abe Dranetz, Alex McEachern
Characterizing PQ with measurements has been key for all types of PQ variations and understanding their impacts. Francois Martzloff, whose work was mentioned previously, led in characterizing variations. One of the first portable PQ measurement instrument that brought forth understanding of PQ issues was developed by Abe Dranetz [5]. Dranetz measurements soon became synonymous with PQ investigations. Alex McEachern took this concept to a new level, first with the Basic Measuring Instruments PQ monitor for portable measurements and then with the PQNode, which was the first device for permanent PQ monitoring with an overall data management and analysis platform called PQView (development led by Erich Gunther and Dan Sabin for the large PQ benchmarking project performed in the late 1980s and early 1990s).
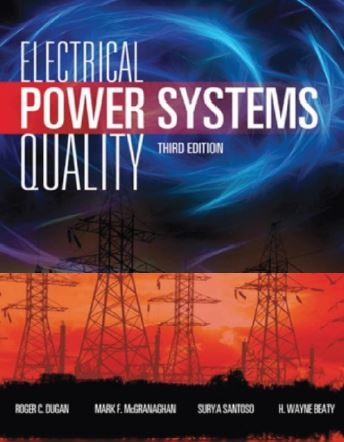
Electrical Power Systems Quality Book—Mark McGranaghan, Roger Dugan, Surya Santoso
Much of this background and the advancements that followed have been documented in the multiple editions of the book Electrical Power Systems Quality (Figure 3). First published in 1996, with subsequent editions released in 2003 and 2012, this textbook has become the de facto textbook for studying PQ issues [6].
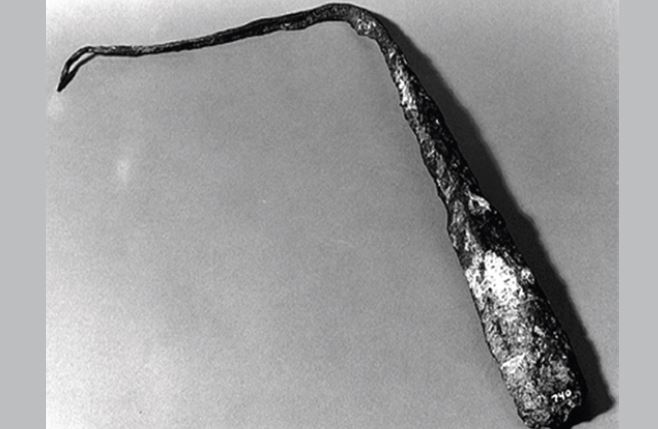
A Harbinger of Things to Come: Ben Franklin Brings Home His Point With the Lightning Rod
Coping with lightning long predates the electric power grid but figures prominently in the history of PQ. One of Benjamin Franklin’s most famous inventions was the lightning rod. In 1749, Franklin described the similarities he observed between electricity and lightning—that is, that both looked like light, appeared in forked arcs, crackled, and were able to kill animals [7]. He became determined to find a method of proving that lightning was in fact electricity.
In 1752, Franklin set out to perform an experiment to test his hypothesis that lightning was indeed electricity. One day as a storm moved in, he used a kite that consisted of a wire and silk handkerchief connected to a hemp string, metal house key, and silk string. The hemp string could grow wet from the rain, which meant it could conduct an electrical charge quickly. Using a Leyden jar, he was able to collect “electric fire”—stored electricity—from the key, thereby providing evidence that lightning was made of electricity.
Even since before the experiment with the kite and key, Franklin advocated for sharp-pointed lightning rods to protect public buildings (Figure 4). Franklin’s invention was seen as an effective deterrent to the scourge of fires from lightning strikes, as fewer damaging lighting strikes hit buildings equipped with lighting rods grounded to the earth. The lightning rod became a valuable tool to mitigate lightning damage and served as a harbinger for future developments in PQ.
Creating a Power Quality Research Program
The connection of more nonlinear loads to the grid in the 1980s and the unique customer issues that emerged prompted growing concern about PQ. Primarily affected were process oriented equipment and microcomputers sensitive to minor changes in the nature of electricity supplied. Initial investigations established a knowledge base, leading to basic definitions of PQ phenomena and uncovering the need for measurement, analysis, and benchmarking capabilities. Utilities began investigating customer PQ issues and educating customers on the basics of PQ. Utilities worked with customers and EPRI to collaboratively identify challenges and possible solutions. Over the years, this knowledge has been organized as part of the EPRI Power Quality Online Resource Center (https://mypq.epri.com/).
A technology transfer pipeline coalesced with utilities, customers, EPRI, and equipment manufacturers working together, and PQ emerged as a business. PQ monitoring advanced, allowing for the first instances of large-scale monitoring and benchmarking, accelerated with monitoring and data analytics developed for the EPRI Distribution Power Quality (DPQ) benchmarking initiatives [8], and resulted in significant accumulations of data used for postmortem analyses. From a business perspective, deregulation reduced the focus on customer equipment causing PQ issues and shifted to ensuring utility service did not cause customers issues. PQ standards continued to develop, covering more phenomena and in greater depth. The IEC emerged as a major force on the standards front. Key technology development included the dynamic voltage regulator and superconducting magnetic energy storage systems that could be the basis of enhanced PQ services demonstrated by American Electric Power [9] and Duke Energy [10].
The EPRI Power Electronics Application Center
The PQ research program at EPRI took off with the creation of the EPRI-PEAC in 1988. This center led equipment testing for compatibility, tested new solutions for PQ problems, developed new tools like the voltage sag generator for evaluating compatibility in customer processes, and helped coordinate conferences and publications that led the industry for many years. Leaders in this center included Tom Key, Arshad Mansoor, and Mark Stephens.
PQ Case Studies: Building the Understanding
One of the keys to creating an awareness and understanding of PQ issues was conducting actual investigations of problems and publishing these as PQ case studies. EPRI has collected more than 100 case studies focused on PQ solutions for utility customers in the Next Generation Online PQ Case Study Library (EPRI, 1002281).
Building a Worldwide Collaboration
As understanding of PQ issues was growing, industry conferences and workshops helped spread the word and build a collaboration that still exists today in this field. Three series of conferences were particularly important:
- International Conference on Harmonics in Power Systems, later renamed as the International Conference on Harmonics and Quality of Power—Alex Emmanuel.
- Power Quality magazine’s Power Quality Conference and John Mungenast Power Quality Leadership Award.
- EPRI Power Quality Interest Group and Power Quality Applications conferences sharing case studies and research results from around the world. These conferences accelerated the adoption of compatibility solutions and tools.
Compatibility Means Economics
As the fundamentals of PQ became understood, it became clear that ultimately, PQ issues are economic issues. For example, if a PQ variation causes the shutdown of a semiconductor chip production process or an automotive production, the consequences can be in the millions of dollars. Evaluating the economics is a combination of forecasting the likelihood of a problem, understanding the impacts, and being able to describe potential solutions. Voltage sags were one of the initial areas where this became especially critical, and Math Bollen and Dan Sabin led in characterizing the problem, as described previously. It is also worthwhile to note the contributions of Larry Conrad in leading the work on IEEE 1346 [11] that focused on the economic evaluation and creating an understanding within the industrial community. The work on the economics of PQ continued in the International Council on Large Electric Systems (CIGRE) and IEC working groups and still continues to this day.
Uninterruptible Power Supply to the Rescue
By the 1930s, electrical power supply had become well established in cities and towns, with almost 90% of people living in urban areas having access to electricity [13]. Given this growing dependence on electricity for daily activities, many electrical engineers and inventors were likely trying to work out solutions to riding through the inevitable dips and interruptions in electrical supply. In 1932, a patent application was filed by John J. Hanley for an “Apparatus for Maintaining an Unfailing and Uninterrupted Supply of Electrical Energy,” a device that would become known as the uninterruptible power supply (UPS). Granted on April 3, 1934, the patent described an apparatus that could be used to change automatically from one source of electrical energy supplying an external circuit to another source of electrical energy with no interruption of electrical flow in the external circuit (Figure 5) [14]. The patent went on to describe how the invention could supply energy temporarily from a battery during the period of time after the main source of electricity had been interrupted and before the circuit had been opened to the new source of electrical energy. Further instructions describe the assembly of the unidirectional current valve needed for the apparatus and the design of an audible warning signal to indicate failure of the original commercial circuit.
The emphasis in the patent application was on maintaining “uninterruptedly and with unfailing certainty” the necessary electrical energy for alarms and signals, such as fire alarms and railway signal systems, “where the safety of property and human life depend upon the unfailing operation of the system.” In addition, mention is made of maintaining the lighting systems for hospital operating rooms and for theaters, the latter of which may have provided the original spark of inspiration for Hanley, given his background.
Whether the safety goals expressed in this patent were fueled by a particular calamity or failure in electrical supply is not known. At the time, according to Hanley’s patent, most fire-alarm systems relied on batteries or other sources of power rather than on a commercial power line. Hanley’s invention would have allowed more systems—not just fire-alarm systems, but railroad-crossing systems, traffic stoplights, burglar alarms, and newly invented smoke detectors—to safely take advantage of utility-supplied power.
Today, the UPS is one of the most ubiquitous PQ mitigation technologies. The largest UPS on record can power an entire city and surrounding communities for about seven minutes. The battery electric storage system in Fairbanks, Alaska, is bigger than a soccer field, weighs 1500 tons, consists of 13,760 liquid electrolyte-filled nickel-cadmium battery cells, and can discharge up to 46 MW [15]. On a much smaller scale, a 900-W UPS with digital display and colored lights is presently being marketed to gamers as a stylish all-in-one device for backup, surge protection, and automatic voltage regulation for personal computers, gaming devices, and peripherals.
There are varying options for protection in cases where voltage sags are the main issue, such as in many industrial processes.

Solutions to issues of voltage sags and momentary interruptions are key to the economic evaluation. These solutions started with a whole industry offering uninterruptible power supplies (UPS) with battery storage to provide ride-through capability. However, many other innovations, from simple protection of process controllers to new power electronic topologies (see, for example, leadership of Deepak Divan in developing novel solutions [12]), were developed and documented in the case studies shared with the industry.
SEMI F47 Standard Improves Compatibility with Many Process Industries (2000)
The semiconductor industry has been vital to the development of electronic devices. Started over 45 years ago, the Semiconductor Equipment and Materials International (SEMI) International Standards Program releases standards aimed at improving product quality and reliability at a reasonable price and steady supply [16]. SEMI F47, which sets equipment voltage sag immunity for the semiconductor industry, was developed through a coordinated effort among semiconductor manufacturers, equipment suppliers, and electric utilities, including many EPRI member companies. The effort began in EPRI’s System Compatibility Research Project Task 24, “Power Quality in Semiconductor Fabrication,” which, through industry collaboration, examined why semiconductor production equipment is susceptible to voltage sags. Task 24 workshops, research, and testing began in 1997, and a request for the establishment of a PQ standard for semiconductor tools was made following the September 1997 workshop in Tempe, Arizona [17]. In February 2000, SEMI F47 was published, defining the minimum voltage sag levels not to cause maloperations of semiconductor equipment. Initially, equipment manufacturers were hesitant to adopt the standard, but researchers showed how the standard could be met with minimum design impact. As a result of this standard being published and adopted, semiconductor customers saw fewer PQ issues, saving manufacturers millions of dollars annually [17].
EPRI’s Consortium for Electric Infrastructure for a Digital Society Report Documents the Economic Value of Power Quality
By 2000, the concept of monitoring and maintaining PQ had been well established as a need in a digital society. Industrial processes were becoming increasingly digitized, prompting greater sensitivity to disturbances in the power supply. Continuous process manufacturing was particularly susceptible as even a small disturbance could lead to lost product, damage, and difficult cleanup. For example, if production stops in injection molding factories, plastic could harden, leading to costly delays before production could resume. In 2000, EPRI’s Consortium for Electric Infrastructure for a Digital Society (CEIDS) report The Cost of Power Disturbances to Industrial and Digital Economy Companies provided a first-of-its-kind comprehensive analysis of economic impacts of PQ issues in key sectors of the economy [18].
In 2000, CEIDS surveyed roughly two million U.S. industrial and digital economy establishments to estimate the cost of different types of power disturbances and the number and cost of disturbances experienced. The report found that across all business sectors, the U.S. economy was losing between $104 billion and $164 billion a year to outages, and another $15 billion to $24 billion to PQ phenomena [18]. In 2020, the report was updated to reflect the current number of U.S. manufacturing facilities, inflation, changes in electrical supply, and sensitivity of processes. The report also clarified terminology used in the 2000 report. Results indicated that in 2020, the total annual costs to all U.S. business establishments from reliability and PQ phenomena were estimated to be roughly $145 billion to $230 billion [19].
Power Quality as a Service
The concept of improving PQ compatibility as a customer service was developed by some leading utilities in the 1990s. Utilities experimented with offering critical customers (such as electronics manufacturing, plastics plants, automotive plants, and so forth) the option of a higher quality power supply by installing additional technology (such as dynamic voltage restorers that helped prevent voltage sags from affecting downline customers). Of course, these offerings came at a cost that was to be considered in the economic evaluation. The overall concept of a service-based offering to improve compatibility and performance continues to be explored to this day. For instance, microgrids provide the capability for local supply to ride through system outages and other PQ issues.
Power Quality Standards Define Compatibility
Standards have been essential in defining the issues and supporting the evaluation of compatibility. Standards activities in IEEE and IEC continue to advance the understanding of PQ issues and provide a forum for discussion of new issues and new approaches for dealing with these issues. Figure 6 illustrates how different standards are needed for definitions, system performance, equipment compatibility, measurements, and assessment methods. With the changing nature of equipment and the characteristics of the power system, this will be an ongoing effort.

The 1990s: A Key Decade for Power Quality Standards
As attention to and knowledge of PQ issues grew, the need for a common understanding of different phenomena and solutions among engineers, equipment manufacturers, and research groups became evident. Through engagement with all of these parties, standards were developed to improve equipment performance and reduce PQ issues on the grid. The 1990s saw the publication of some seminal standards by groups including IEEE, IEC, and SEMI.
Initially released in 1992 and subsequently updated in 2014, IEEE 519—IEEE Recommended Practices and Requirements for Harmonic Control in Electrical Power Systems gives a recommended practice establishing goals for the design of electrical systems that include both linear and nonlinear loads [20]. The 1992 version served as both an educational tutorial and a standard, defining the requirements and responsibilities of the utilities that supply power and those of the end users. The standard set limits on voltage and current distortion at point of common coupling and gave specific limits on total harmonic distortion and total demand distortion. It held that the customer is responsible for limiting the amount of harmonic current injected into the grid and the utility is responsible for avoiding resonance conditions. While many people contributed to the development of IEEE 519 and the application guide for this standard, Mark Halpin deserves a lot of the credit for continuing to advance this important effort.
Standards in the IEC 61000 family introduced the concept of electromagnetic compatibility, dictating how electrical equipment and systems can function acceptably in their electromagnetic environment. The first standard in this family was released in 1992 and defined basic terms [21]. Following standards set limits for harmonic emissions, bounds for voltage fluctuations, and guidelines for testing and measurement techniques [22, 23]. In 2003, IEC 61000-4-30 was first published, defining methods for measurement and interpretation of PQ data [23]. Prior to this standard being released, engineers could collect identical data and arrive at multiple different interpretations. Updated in 2008 and 2015, IEC 61000-4-30 resolved this issue by standardizing data analysis. Early leaders like Alain Robert led these development efforts with tremendous contributions from Robert Koch, Emmanuel DeJaeger, and many others.
Today, standards continue to evolve and be updated as loads and generation sources change. As more nonlinear loads are connected to the system and more inverter-based resources are introduced, standards can play a key role in reducing PQ issues on the grid.
Power Quality Characterization, Monitoring, and Benchmarking
Understanding system performance and specific PQ variations is important to finding PQ solutions. Variations may be characterized by abnormalities in voltage, current, frequency, and duration of event. PQ monitoring, or the process of gathering, analyzing, and interpreting measurement data, is essential for identifying and characterizing variations. Advancements in PQ monitoring devices made interpretation easier, streamlined data collection processes, and enabled the development of software to manage large quantities of PQ data.
The CBEMA and Information Technology Industry Council Power Acceptability Curves
The key to the compatibility problem for voltage sags and interruptions is characterizing the performance from the supply system in a way that can be compared with the ride through characteristics of equipment. The famous “CBEMA curve” was one of the first attempts to document and enable compatibility between common high-tech end-use devices and the electric grid. In 1977, the CEBMA ESC-3 working group was asked to provide input on an energy performance profile for computer equipment that was being proposed for publication in IEEE Standard 446. This standard focused on industrial and commercial users’ needs for the selection and application of emergency and standby power systems. After making minor modifications, the working group approved this power acceptability curve. What became known as the “CBEMA curve” (see Figure 6) was derived from experimental and industry-provided data from mainframe computers. The CBEMA curve attempted to describe the tolerance of single-phase computer business equipment to the magnitude and duration of voltage variations on the power system [24]. This was the first attempt to develop a simple compatibility guideline for sensitivity and robustness of end-use equipment to common voltage sags and became one of the most frequently used power acceptability curves.
CBEMA Curve Based on Mainframe Computers (1977)
Despite the focus on mainframe computers and 120-V, single-phase systems, the CBEMA curve (Figure 7) was considered widely useful. Data on voltage variations gathered from PQ testing equipment located near sources of suspected disturbances or placed to measure the operation of a distribution system could be analyzed in combination with the CBEMA curve. Balanced voltage-sag events in three-phase systems could be treated as a single-phase equivalent and the curve applied directly; however, unbalanced voltage sags made the application of the CBEMA curve to three-phase systems more complicated. Nevertheless, the CBEMA curve would eventually be used in the design of system reliability for electronic equipment and the design of sensitive equipment on the power system, and it would also be used as a common format for reporting on PQ variation data.

Information Technology Industry Council Curve Based on Tests of Computer Power Supplies (1996)
In 1994, CBEMA was renamed the Information Technology Industry Council (ITIC), and a new curve evolved in 1996 that became known as the “ITIC curve.” A working group and several sponsors revised the original curve based on results from tests that were conducted on a representative sample of eight personal-computer power supplies supplied by eight different manufacturers [25].
Unlike the original CBEMA curve, which was very “smooth,” the new ITIC curve has discrete steps (see Figure 8), making it easier to program in PQ meters and spreadsheet platforms. Uses for this curve have expanded to include defining specification criteria for electronic equipment and using it as a basis for PQ performance contracts between utilities and large industrial customers [26].

Power Quality Monitoring Equipment
One of the first PQ monitoring devices was the General Electric lightning strike recorder [27]. Developed in the 1920s, this device recorded lightning strike date and time with marks on strip-chart paper [28]. Devices producing more quantitative results did not emerge until the 1960s, and it was not until the mid-1970s that the first well-recognized PQ monitor was developed. This monitoring device, the Dranetz Series 606 created by Abe Dranetz, was the first microprocessor-based device of its kind. It measured voltage only and printed its text-based output describing disturbances by event type and voltage magnitude on paper tape [28]. In the 1980s, Alex McEachern saw an opportunity to improve the world of PQ monitoring and created a new generation of monitoring devices with graphical displays, digital memory, and improved triggering approaches. In the 1990s, in part due to the scope of the EPRI DPQ Project and the research that went into both the hardware and the software to support permanent PQ monitoring, a third generation of monitors was coupled with software systems to collect and manage data as part of a complete PQ monitoring system [28]. Today, PQ equipment is coupled with software that analyzes data and generates usable information. In many cases, the monitors themselves perform mathematical calculations, including the fast Fourier transform to calculate harmonics. The focus is turning towards automated PQ monitors that may enable proactive grid controls [29].
Widespread Monitoring and Benchmarking Establishes Power Quality Baselines
Complaints of PQ issues increased significantly with the increased use of electronic controls and automated, continuous manufacturing, along with the use of more sensitive equipment in industrial facilities. Individual solutions, such as outfitting customer facilities with UPS devices, were not cost-effective compared to a systemwide approach to solving PQ issues. The concept of “premium power quality” emerged as a service that utilities could provide to stay competitive and retain customers. Before offering premium PQ, utilities needed to understand their baseline levels of PQ, prompting widescale PQ monitoring and benchmarking projects around the globe.
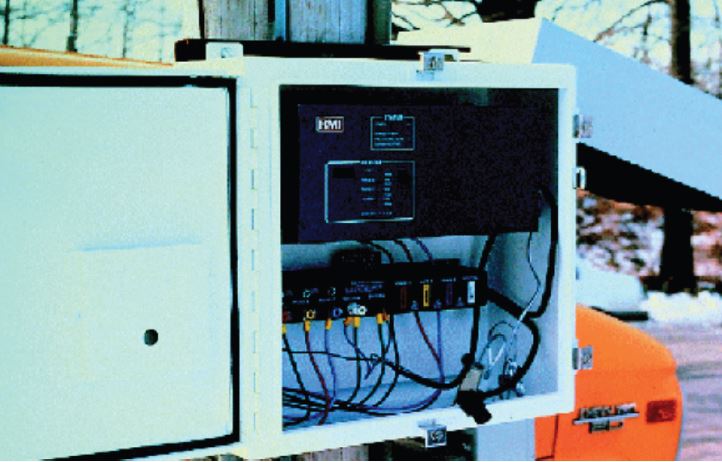
In fall 1989, EPRI launched the first iteration of the Distribution Power Quality (DPQ-I) project [8]. The chief goal of the project was to provide baseline statistics regarding quantities that fall under the general category of distribution PQ, including the frequency and duration of PQ events. Methods included collecting, analyzing, and reporting of distribution PQ data at the national level with a degree of statistical importance. Monitors were placed at 300 locations on 100 distribution feeders, resulting in 27 months of monitoring and more than 30 gigabytes of data stored in the DPQ Database, making DPQ-I the most extensive distribution system PQ study ever conducted. Figure 9 shows an 8010 PQNode device, which was used for PQ monitoring during DPQ-I. Following DPQ-I was DPQ-II in 2001 and 2002, which characterized short term variations based on data from 480 monitors, including data collected during DPQ-I [30]. In 2014, results from the Transmission Power Quality-Distribution Power Quality (TPQ-DPQ-III) project were reported, expanding efforts from the previous DPQ projects by monitoring PQ characteristics in both distribution and transmission systems [31]. In 1997, EPRI’s Reliability Benchmarking Methodology provided methods and defined indices so that service quality could be quantified from the data collected in surveys such as DPQ [32].
PQ monitoring began to be ubiquitous around the world to ensure acceptable levels of quality for consumers. Along with the EPRI DPQ projects, different utilities and research groups conducted large-scale surveys and monitoring of PQ levels in multiple countries. Examples include:
- In 1991, the Canadian Electricity Association began a three-year survey, resulting in 550 customer sites monitored for one month each [33].
- In the mid-1990s, Electricité de France’s Qualimat project involved monitoring PQ at every medium-voltage substation, with the goal of ensuring a specified level of PQ nationwide.
- Similarly, by the same time, East Midlands Electricity in Nottingham, England, was monitoring PQ within its territory [34].
- In 2001, the Council of European Energy Regulators released its first Benchmarking Report on Quality of Electricity Supply, with following editions released in 2003, 2005, 2008, 2011, and 2016, all of which addressed continuity of supply, voltage quality, and commercial quality [35].
Power Quality Analysis and the Role of PQView
While there was significant advancement in monitoring devices and software in the 1980s, there remained a question of how to extract meaning from the data collected. This problem was compounded when large-scale monitoring efforts began, prompting the need for improved methods of collection, analysis, and reporting of massive amounts of data. Continuous monitoring of system performance was also growing as a proactive measure against PQ issues, increasing the need for analysis that could actively characterize phenomena. Additionally, different types of PQ variations required different types of analysis to characterize system performance. To address these needs, software was developed to analyze and characterize data.
One example of a PQ statistical analysis program is PQView, the software system designed to manage and analyze the data collected and stored during DPQ-I [8]. Electrotek Concepts and EPRI began developing the software in 1989, and version 1.0 was released in 1994 [36]. Key functionalities of this software included the ability to characterize data automatically from a database and use analysis tools to generate summary statistical reports.
Since its initial development, PQView has gone through multiple updates to advance its abilities and functionality. Version 1.0 could connect to one meter and output a static report. Following versions could connect to multiple monitors of different types and evolved to be an investigative tool. Besides data analytics for benchmarking, tools like PQView could be used for diagnostics, operations, asset management, and planning. A great example was the first implementation of fault location based on PQ waveforms at Con Edison [37]. This tool reduced time needed to locate and repair faults, and it demonstrated that PQ monitoring could be more than just reacting to customer impacts but rather could be a proactive tool used throughout grid operational services.
PQView has now grown into enterprise-class analysis software. There has also been emergence of open source analysis platforms, such as PQDashboard, an online tool for systemwide PQ data [38].
Power Quality Monitoring Into the Future
The new millennium brought an increase in the number of advanced PQ monitors on the market and the recognition of the need for better handling of PQ and other data streams. Most importantly, PQ is becoming part of standard power system monitoring. With equipment like advanced meters, sensors throughout the grid, phasor measurement units, and monitoring within individual equipment, a vast amount of data can be collected. A key challenge today has moved to data management and analytics that will turn these data into actionable information to improve grid and equipment performance.
The Impacts of Distributed Resources
Managing the power grid hit an inflection point as distributed energy resources (DER) emerged rapidly, creating a complex environment with thousands of decentralized generation sources, many of which are inverter based. Between 2005 and 2018, annual global solar photovoltaic (PV) generation grew from 3.7 terawatt hours (TWh) to 554.4 TWh [39]. While these resources play a major role in efforts toward decarbonization, they introduce PQ concerns as they are noninertial and inverter based, and they can inject significant harmonics into the grid. Research is ongoing to determine how the grid and end-use equipment are affected by DER-induced PQ issues.
IEEE Standard 1547 provides for the interconnection and interoperability of DER with electric power systems. First released in 2003 and updated in 2018, Standard 1547 provides requirements for the performance, operation, testing, safety, and maintenance of the interconnection between DER and the power system [40]. If DER may be causing PQ issues (including harmonics), this standard advises what actions to take and formalizes PQ considerations for the grid.
New Power Quality Issues
There are always new issues to study in the world of PQ compatibility. Some of the most important areas of investigation today include:
- Voltage regulation with increased penetration of distributed resources
- Hosting capacity—the ability of the power system to function properly with more and more devices that may affect quality or reliability
- Electrification impacts (electric vehicle charging, heat pumps)
- Energy storage
- Higher frequency harmonics (supraharmonics)
- Monitoring everywhere, artificial intelligence
- Improved power supplies and power electronics
- Importance of communications infrastructure
Conclusion
PQ research has been driven by digitization in equipment and processes, customer needs and economic impacts, standards development, and a changing power grid environment.
Continued increased use of computers, inverters, and microprocessors potentially will introduce new challenges and influence research pathways. Integrating DER and increased system complexity will remain a core PQ challenge unique to each local system as the grid continues to evolve. Ongoing integration of solar PV, electric vehicle chargers, and other inverter-connected devices may introduce entirely new PQ issues as electrification efforts increasingly permeate all economic sectors. With possibly millions of these devices operating throughout the grid, it is important to consider systemwide PQ for the reliable operation of these devices and to minimize PQ impacts on the grid.
Updated and new standards, such as IEEE 1547 and IEEE P2800, provide guidelines on how DER and inverter-based resources may minimize impact to PQ on the grid, including those resources interconnecting with transmission systems. Instead of reacting to PQ issues, a systemwide, data-driven approach may aid in proactively identifying PQ issues that could lead to major incidents. Artificial intelligence and machine learning using large amounts of data could bolster analysis programs to generate localized solutions. UPS and battery storage also may have value in the future energy system, not only as storage devices to balance dips in generation but also for voltage regulation and PQ in general, a potential incentive for larger industrial users to install their own on-site batteries
Utilities, manufacturers, vendors, researchers, and customers are collaborating to find mutual understanding and solutions beneficial to all stakeholders. EPRI’s Program 1: Power Quality is helping to continue these efforts, with research ongoing to anticipate and address PQ issues in the changing grid environment.
References
- F. Martzloff, “Proceedings: Open Forum on Surge Protection Application,” National Institutes of Standards and Technology, 1991.
- G. King, “Charles Proteus Steinmetz, the Wizard of Schenectady,” Smithsonian Magazine, August 2011, https://www.smithsonianmag. com/history/charles-proteus-steinmetz-the-wizard-ofschenectady- 51912022/ [accessed October 29, 2021].
- American Physical Society, “March 21, 1768: Birth of Jean- Baptiste Joseph Fourier,” March 2010, https://www.aps.org/publications/apsnews/201003/physicshistory.cfm [accessed October 29, 2021].
- M. Bollen. Understanding Power Quality Problems: Voltage Sags and Interruptions. John Wiley & Sons, 2000.
- Dranetz, “Abe Dranetz, 1922–2015,” https://www.dranetz.com/abe-dranetz/ [accessed February 11, 2022].
- R. Dugan, M. McGranaghan, and S. Santoso. Electrical Power Systems Quality, Third Edition. McGraw-Hill Education, 2012.
- M. Woods, “Franklin Didn’t Actually Discover Electricity,” Post-Gazette National Bureau, May 27, 2002, https://old.post-gazette.com/healthscience/20020527franklin0527p2.asp [accessed April 8, 2021].
- DPQ Executive Summary. EPRI, Palo Alto, CA, 2003. 1017340.
- Premium Power Park (PPP): Phase 1—Application Methodology. EPRI, Palo Alto, CA, 2000. 1000200.
- Technical and Economic Considerations for Power Quality Improvements. EPRI, Palo Alto, CA, 2001. 1005910.
- IEEE Recommended Practice for Evaluating Electric Power System Compatibility With Electronic Process Equipment, IEEE 1346-1998.
- Demonstration Project for a Dynamic Sag Corrector—Operations Experience. EPRI, Palo Alto, CA: 2002. 1006959.
- “Generating and Distributing Electricity in Rural Areas of the United States,” Electric Choice [blog post], https://www.electricchoice.com/blog/generating-distributing-electricity-inrural-areas [accessed March 15, 2022].
- J. J. Hanley, “Apparatus for Maintaining an Unfailing and Uninterrupted Supply of Electrical Energy.” United States Patent Office, Patent 1953602, 1934.
- “Battery Energy Storage System for Golden Valley Electric Association,” Energize, November 2004, pp. 27–30.
- SEMI, “About SEMI Standards,” https://www.semi.org/en/products-services/standards/using-semi-standards [accessed April 30, 2021].
- Impact of SEMI F47 on Utilities and Their Customers. EPRI, Palo Alto, CA, 2004. 1002284.
- The Cost of Power Disturbances to Industrial and Digital Economy Companies June 2001 ID: 1006274. EPRI, Palo Alto, CA, 3002000476.
- Understanding the Cost to U.S. Business from Unmitigated Reliability and Power Quality Events. EPRI, Palo Alto, CA, 2020. 3002019395.
- Recommended Practices and Requirements for Harmonic Control in Electrical Power Systems, IEEE Standard 519-1992.
- 1992 Electromagnetic Compatibility (EMC)—Part 1: General—Section 1: Application and Interpretation of Fundamental Definitions and Terms, IEC TR 61000-1-1.
- 1995 Electromagnetic Compatibility (EMC)—Part 3: Limits— Section 2: Limits for Harmonic Current Emissions (Equipment Input Current <= 16 per Phase), IEC 61000-3-2.
- 2003 Electromagnetic Compatibility (EMC)—Part 4-30: Testing and Measurement Techniques—Power Quality Measurement Methods, IEC 61000-4-30.
- “CBEMA Curve—The Power Acceptability Curve for Computer Business Equipment,” Power Quality in Electrical Systems [blog post], April 3, 2011, http://www.powerqualityworld.com/2011/04/cbema-curve-power-quality-standard.html [accessed April 8, 2021].
- “ITIC Curve,” Voltage Disturbance, http://voltage-disturbance.com/voltage-quality/itic-curve/ [accessed April 8, 2021].
- Standards for Characterizing Voltage Sag Performance. EPRI, Palo Alto, CA, 2015. 3002005885.
- A. McEachern, “World-wide Power Quality—20-Year Cycles of
Development, 1965 to 2025,” presented at China International
Conference on Electricity Distribution, 2006. - R. Dugan, M. McGranaghan, S. Santoso, and H. W. Beaty. Electrical Power Systems Quality. McGraw-Hill Education, 2002.
- PQ TechWatch: Power Quality Monitoring for Micro-Grid and Comparable DER Installations. EPRI, Palo Alto, CA, 2019. 3002016377.
- Voltage Sags, Swells, and Interruptions Characterized in DPQ Phase II Project. EPRI, Palo Alto, CA, 2005. 1010927.
- Transmission—Distribution Power Quality Report (TPQ-DPQ III). EPRI, Palo Alto, CA, 2014. 3002003995.
- Reliability Benchmarking Methodology. EPRI, Palo Alto, CA, TR-107938.
- M. B. Hughes and J. Chan, “Canadian National Power Quality Survey Results.” Proceedings of 1996 Transmission and Distribution Conference and Exposition, 1996.
- D. D. Sabin and A. Sundaram, “Quality Enhances Reliability [Power Supplies],” IEEE Spectrum, Vol. 33, No. 2, pp. 34–41, February 1996.
- Council of European Energy Regulators (CEER). 6th CEER Benchmarking Report on the Quality of Electricity and Gas Supply. CEER, Brussels, Belgium, 2016.
- Electrotek, “Electrotek History Timeline,” Electrotek Concepts, 2021, https://www.electrotek.com/electrotek-history-timeline/ [accessed May 3, 2021].
- EPRI Program 1 PQ Tools and Analysis Research (PQView) Provides Foundation for New Fault Location Function at Consolidated Edison. EPRI, Palo Alto, CA, 2005. 1013001.
- PQDashboard [software program], https://github.com/Grid-ProtectionAlliance/PQDashboard.
- IEA Electricity Information [database], 2020, https://www.iea.org/data-and-statistics/data-product/electricity-information.
- IEEE Standard for Interconnection and Interoperability of Distributed Energy Resources with Associated Electric Power Systems Interfaces, IEEE 1547-2018.
About EPRI
Founded in 1972, EPRI is the world’s preeminent independent, non-profit energy research and development organization, with offices around the world. EPRI’s trusted experts collaborate with more than 450 companies in 45 countries, driving innovation to ensure the public has clean, safe, reliable, affordable, and equitable access to electricity across the globe. Together, we are shaping the future of energy.
Source URL: https://www.epri.com/research/products/000000003002022396
