Published by Dranetz Technologies, Inc.
INTRODUCTION
Data centers, hospitals, mission critical and other facilities rely on standby power. This is often generators that are ready to carry the load if there is an interruption in the primary power source. Such facilities often have UPS systems for a seamless transition to standby power, and to carry the load on battery (or other source) should the standby power fail to come online.
Commissioning, testing, and troubleshooting such facilities often involves step load cycling, power source transitions and other testing. Technicians follow strict procedures specified by the designers and device manufacturers to ensure that the entire power system works seamlessly as designed throughout its range of operation.
Dranetz portable PQ meters have been the ‘go to’ products for years for generator and mission critical testing. The Dranetz HDPQ Guide and Xplorer Plus/SP products continue this legacy and are uniquely qualified for the task.
This application note describes the benefits, unique capabilities, and configurations of the Dranetz HDPQ family for these critical applications.
DRANETZ HDPQ & DRAN-VIEW 7 ADVANTAGES
The Dranetz HDPQ Guide & Xplorer PQ analyzers are ideally suited for critical systems testing. Both offer high resolution measurements, advanced waveshape change triggering, and a large recording buffer that are unmatched in the industry. These capabilities are essential in capturing the data required for these applications. Note that the HDPQ Visa has a much smaller recording buffer and is less optimal for these applications.
Another key component is Dran-View 7 Enterprise (DV7E) software. DV7E turns your recorded data into actionable information. DV7E not only provides convenient tools for data analysis and reporting, but also includes advanced capabilities that add value to recorded data. Case in point – DV7E easily computes cycle-by cycle frequency which is critical in evaluating the response of the power system during the tests (see below).
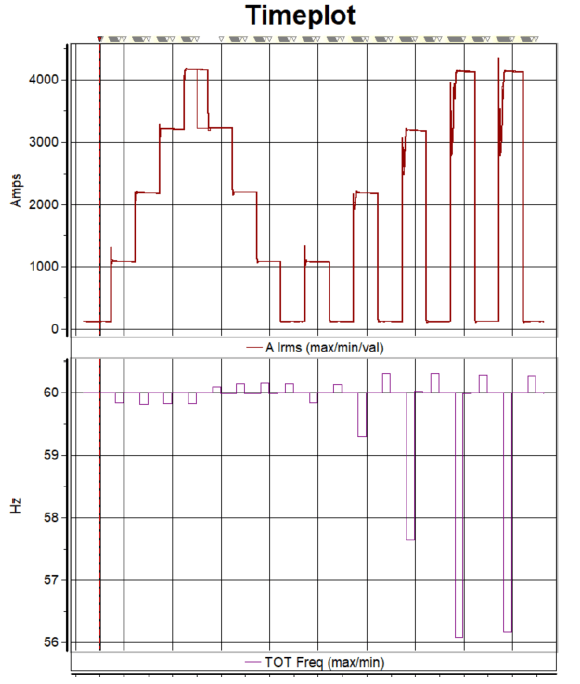
Figure 1. Generator frequency step load response
KEY DRANETZ HDPQ CAPABILITIES
Triggering
Step load testing is common in these applications. As indicated in the diagram above, a load bank is used to simulate the load to evaluate the response of the power system. The loads will often be stepped incrementally up and then back down from 0% to 100% in 25% increments. There is usually a pause between steps to see the response of the power system.
‘Impulse’ tests are also conducted stepping from 0% to 25% to 0%, 0% to 50% to 0%, etc. throughout the capacity range. Again, pausing between steps.
Load stepping presents some unique triggering challenges for the PQ analyzer to record the required data. To capture each step the meter must detect incremental changes in current on a cycle-by cycle basis. Most meters are limited to only HI or LO RMS trigger limits and many are not capable of inspecting each cycle as required. At best , most meters may only capture one load step and not the incremental stepping required by this application.
The Dranetz HDPQ family overcomes this by using innovative waveshape deviation triggers that are available for both voltage and current. Waveshape triggers work in parallel with other instrument triggers to continually inspect every digitized sample point of each cycle looking for positive or negative changes in amplitude from the same data point of the previous cycle.

Figure 2. Dranetz HDPQ family V&I waveshape deviation triggering
This capability is key to detecting cycle-by-cycle changes in voltage or current for applications such as negative transients, harmonics, system noise, and the impulse/step changes of this application.

Figure 3. HDPQ current waveshape deviation trigger
As shown above, a positive step load switch changed the AC waveshape, creating a waveshape trigger that started data recording to memory. A negative waveform change would work the same. The HDPQ analyzer is always ready to record the next step change – all in parallel with the traditional HI/LO RMS, transient and other triggering available.
Note that the voltage trigger settings for this application can use the same waveshape triggers if needed, or the traditional RMS sag/dip, swell triggers.
Recording Buffer
Step load testing requires a large recording buffer. The reason is to capture the state of the power system before, during and after the step transition. The Dranetz HDPQ Guide & Xplorer analyzers can record up to 10K cycles for each triggered cycle-by-cycle PQ event. This capability is available for sags/dips, swells, transients, and the waveshape triggers used in this application.
The recording duration for each load step is application dependent but is typically around 5 seconds. We recommend doubling the minimum recording requirement, if possible, to account for unexpected situations such as skews in test timing, to capture unexpected system issues, etc.
As an example, if the application requires 5 seconds of recording per step, we recommend doubling to 10 seconds. This is a post-trigger setting of 600 cycles @60Hz, 500 cycles @50Hz. We also recommend a 30 cycle pre-trigger setting which is 0.5 seconds @60Hz, 0.6 seconds @50Hz. The pre-trigger will additionally capture the state of the system before the step load change. See the example below.

Figure 4. Dranetz HDPQ step load trigger example
BENEFITS OF DRAN-VIEW 7
By using the above-mentioned triggers & settings you will capture the data necessary to evaluate the performance of the power system during the step load and other testing. However, there’s an important missing parameter that’s not available directly from most PQ analyzers, including the Dranetz HDPQ – cycle-by-cycle frequency for each step load change.
Why?
Most reputable PQ analyzers like the Dranetz HDPQ family measure in accordance with international PQ standards, the most common being IEC 61000-4-30. The Dranetz HDPQ family is IEC 61000-4-30 Class A Ed 3 complaint and is laboratory tested to ensure compliance. IEC 61000-4-30 has strict measurement requirements that includes frequency which is to be averaged over a period of time. This is ideal for most applications, but not for this application that requires frequency to be measured on each cycle continually for the duration of the recording.
Dran-View 7 Enterprise (only) can post process recorded waveform data to compute many additional parameters not available directly from the PQ analyzer. For this application, in just a few clicks, the DV7E Harmonics & Timeplot Calculator can quickly compute the frequency of every cycle recorded by the HDPQ analyzer.

Figure 5. Dran-View 7 Enterprise Harmonics & Timeplot Calculator
Cycle-by-cycle frequency is then available for trending, analysis and reporting alongside the data from the HDPQ analyzer. It can even be stored in the DV7E database.
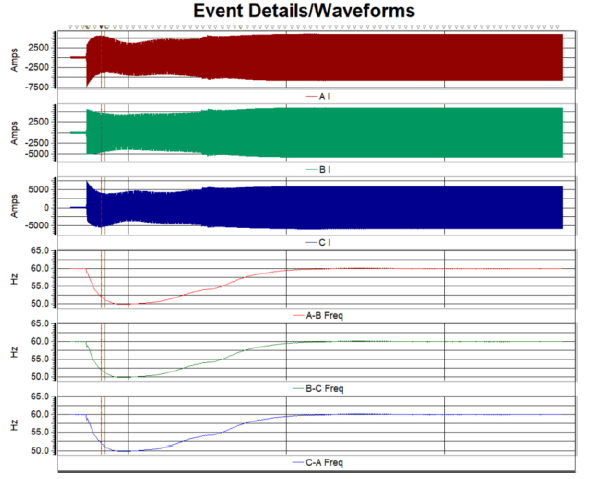
Figure 6. Dran-View 7 Enterprise cycle-by-cycle frequency computation
As shown above, the frequency response of the step load changes to the system can be easily seen alongside the current recorded directly by the HDPQ.
CONFIGURING THE INSTRUMENT FOR YOUR SURVEY
Actual instrument configurations can vary by application and are beyond the scope of this application note. Also, we covered the most important parameters to enable, but your application may require others.
If you are unfamiliar with the Dranetz HDPQ configurations, Dranetz has a series of recorded presentations available on our web site that focus on product applications and operational training, including this application. Please follow the link below and search for the application training titled ‘Dranetz HDPQ UPS, Generator & Mission Critical Testing’. This video expands on the information here, provides step by step HDPQ & DV7E configuration instructions, as well as demonstrations.
https://www.dranetz.com/technical-support-request/dranetz-webcasts/
Website: Dranetz.com , Call 1-800-372-6832 (US and Canada) or +1-732-287-3680 (International)
