Published by
- D. D. Sabin, Email: dsabin@electrotek.com
- D. L. Brooks, Email: dbrooks@electrotek.com
Electrotek Concepts, Inc., 409 North Cedar Bluff Road, Suite 500, Knoxville, Tennessee 37923-3605, United States
- A. Sundaram, Email: asundara@epri.com
- S. Bhatt, Email: sbhatt@epri.com
Electric Power Research Institute, 3412 Hillview Avenue, Palo Alto, California 94304-1395, United States
Abstract
The Distribution System Power Quality Project conducted by the Electric Power Research Institute (EPRI) consisted of monitoring power quality at nearly 300 sites on the primary distribution feeders of twenty-four utility systems throughout the United States. The data collection stage of the survey began on Jun-01-1993, and continued until Sep-01-1995. As the sites selected for monitoring represented a diverse sampling of feeder types, geographic locations, protection schemes, and voltage ratings, the project’s results are important at a national level. This paper will examine some of the project’s important final results while focusing on two important areas: rms voltage variations and harmonic distortion. The paper will also examine two other EPRI projects: the Power Quality Diagnostic System (PQDS) and the EPRI Reliability Benchmarking Methodology Project. The PQDS Measurement Module – PQView – is the software package used to produce the final results of the EPRI DPQ Project. The EPRI Reliability Benchmarking Methodology is a comprehensive effort designed to develop methodologies and software tools for benchmarking utility reliability. All three projects together form EPRI’s solutions to power quality monitoring needs.
Introduction
Sags, swells, and momentary interruptions are not new phenomena; they have been characteristics of electric power systems for over a hundred years. Voltage sags, or dips, were not considered a significant problem decades ago because the loads connected to electric distribution systems were generally immune to their effects. For this reason, electric utilities did not need to maintain statistics which described power quality levels which could be used to determine what would be considered normal or abnormal. However, with the world-wide proliferation of advanced but sensitive power electronic equipment and the increasing integration of microcomputers in process control and automation, these same power system characteristics considered relatively unimportant before can now be very expensive in terms of process shut-downs and equipment malfunctions.
Some utilities are beginning to address this concern by taking a systems approach to solving power quality problems. They realize that in some cases significant savings are possible by providing higher levels of power quality, rather than having customers purchase distributed power conditioning systems (for example, UPS systems) with low efficiency and power quality problems of their own. In order to remain competitive in an ever-changing utility environment, these utilities are therefore beginning to explore premium power services as a means of keeping their most important customers. However, before they can implement these services, they must first determine existing power quality levels. They must first ask, “What is the baseline?” Premium power cannot be offered to customers without first answering this critical question. This is the role of wide-scale power quality monitoring projects. By collecting the statistics for power quality phenomena which have been largely ignored for decades, we provide the means to begin our redefinition of electric power reliability.
EPRI DPQ Project
In order to better understand the statistics of power quality the Electric Power Research Institute (EPRI) of the United States conducted a power quality monitoring survey of 277 monitoring locations located on the primary distribution feeder of 24 electric utilities across the U.S. (Figure 1a). Commonly known as the EPRI Distribution System Power Quality Monitoring Project, or the EPRI DPQ Project, EPRI and its contractor Electrotek Concepts performed the study from June 1993 to September 1995. It resulted in the collection of over 6.7 million measurements which are stored in a 30-gigabyte database.
During the initial stage of the project, we designed a new monitoring device: the BMI 8010 PQNode, depicted in Figure 1b. This instrument permits simultaneous monitoring of steady-state quantities (e.g., rms voltage and current, harmonic distortion levels, power factor) and triggered disturbances (voltage sags, interruptions, transients, and impulses).
While the results of the project only provide statistically valid information about power quality on the distribution systems of the host utility population, it was essential for us to ensure that sufficient variation existed in the study population of utilities to yield useful results for distribution systems nationally. The accomplishment of these objectives required that all locations on the distribution systems of the host utilities, which were determined to offer the needed diversity, had a chance of being selected for study. The objectives also required that we could calculate selection probabilities at each stage to be used when weighting data for composite analysis. The reference given in (4) treats an in-depth description of the multistage process used to select the sites for monitoring. Reference (2) offers examples demonstrating the methods for using selection probabilities to weight measurements.
The chief goal of the project was to provide baseline statistics regarding quantities that fall under the general category of power quality:
• Voltage Disturbances: rms voltage variations, transient overvoltages
• Steady-State Characteristics: harmonic distortion, steady-state regulation
The project included the participation of 24 host utilities across the continental U.S., which provided geographical and operating-practice diversity. The result of the site selection process was a set of 100 distribution feeders in the voltage range of 4 to 33 kV. It was decided to arbitrarily place one monitor on the line side of every substation to create a subset of monitoring locations which could be identified as being distribution substations only. To still provide a level of randomness, two more monitors were placed downline of the substation on the feeder itself. This identified a total of 300 monitoring sites. We ultimately installed monitors at 277 sites on 95 feeders within the service territories of the utilities geographically illustrated in Figure 1a. The sites which were not installed generally were victims of individual utility budget cutbacks. However, the project’s statistician did not consider the missing sites to be of great concern.
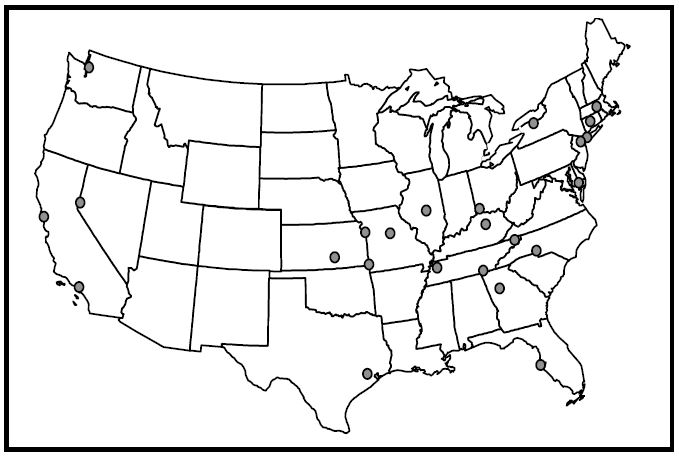
Figure 1a: Location of the 24 EPRI DPQ Project Host Utilities
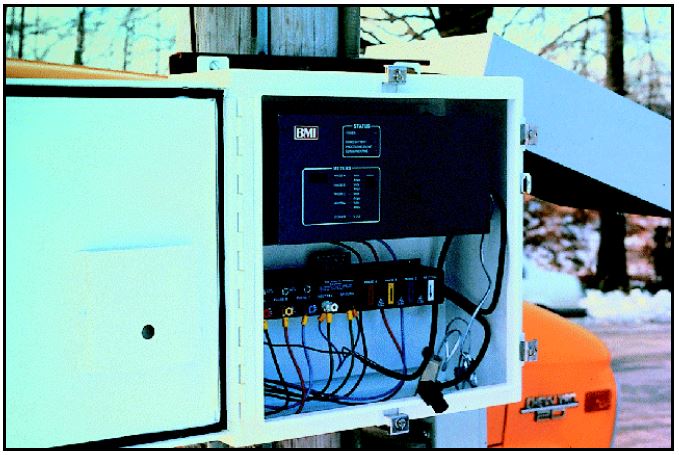
Figure 1b: Photograph of a BMI 8010 PQNode mounted on a distribution feeder pole within a NEMA 4 enclosure
RMS Voltage Variations
With any discussion of rms voltage variation analysis, a frequently asked question is “What do you define to be an event?” The question is important because the total count of “events” would be very different if three-phase measurements were counted as three single-phase measurements. The approach we developed for our monitoring project was to collect small elemental components of measurements (i.e., measurement components) and aggregate them at analysis time. The verb “aggregate” literally refers to the collection of units or parts into a mass or whole. Power quality data aggregation refers to the data reduction technique of collecting many distinct measurement components into a single aggregate “event” for the purpose of computing system performance indices. How we combine the measurements depends on the specific needs of a particular analysis session. We have found that at different times it may be necessary to either break apart measurements into measurement components, or to combine them through aggregation. Figure 2 furnishes the hierarchy of rms variation measurement levels. A wider application of the hierarchy to more than just rms variations seems justifiable.
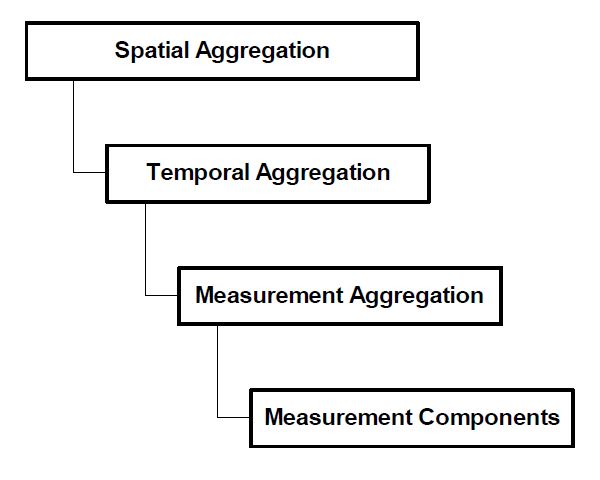
Figure 2: Hierarchy of Power Quality Aggregation Levels
Figure 3b illustrates the project’s sag and interruption magnitude rate, using one-minute temporal aggregation, for the events recorded during a two year period (Jun-1-1993 to Jun-1-1995). The results include the application of sampling weights and represent all project monitoring sites. From Figure 3b we can say that the average site in our project experienced 1.18 incidents in which the minimum voltage during a 60-second window was between 85% and 90% of the site’s base voltage, as well as 0.38 interruption incidents (less than 10% voltage). The only events which were excluded from this plot were those in which the duration below 0.90 per unit was longer than 60 seconds.
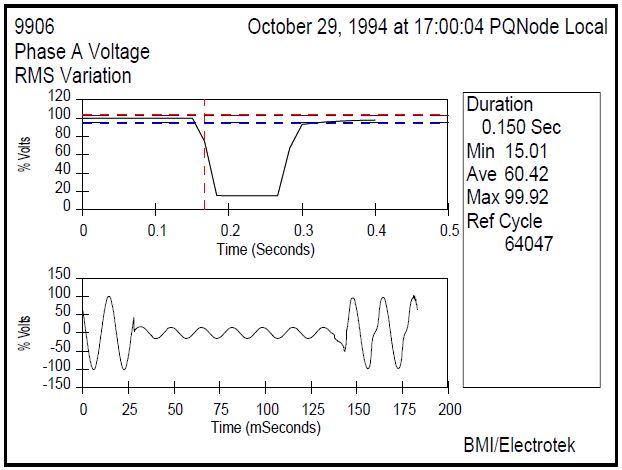
Figure 3a: Example of an rms voltage variation with a minimum voltage magnitude of 0.15 per unit and a duration of 9 cycles.
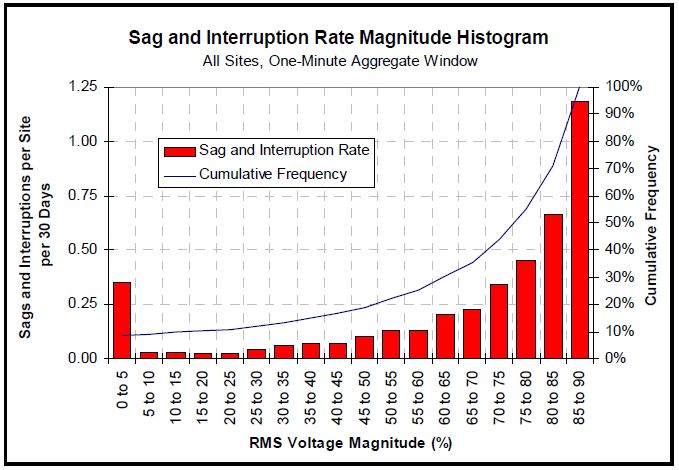
Figure 3b: RMS Variation Rate Magnitude Histogram, 60-Sec Aggregation, Jun-1-1993 to Jun-1-1995, Treated by Sampling Weights, All Sites.
Transient Overvoltages
Voltage disturbances which are shorter in duration than sags and swells are classified as transients and include two basic classes: (1) impulsive transients, often attributable to lightning and load switching, and (2) oscillatory transients, usually caused by capacitor bank switching (see Figure 4a). Utility capacitor banks are often switched into service early in the morning in anticipation of a higher power demand period. Transients with a high magnitude and fast rise times can lead to insulation breakdown in motors, transformers, capacitors, and switchgear.
The application of distribution system capacitor banks has long been accepted as a necessary step in the design of distribution feeders. Design considerations often include traditional factors such as voltage support, power factor, and released capacity. However, as customer systems evolve through the use of power electronics, the distribution system design of the future will include power quality as a consideration. The frequent switching of distribution capacitor banks coupled with the increasing application of sensitive customer equipment has led to a heightened awareness of some important events:
• Magnification of capacitor switching transients.
• Nuisance tripping of adjustable-speed drives.
These concerns have become particularly important as utilities institute higher power factor penalties, thereby encouraging customers to install power factor correction capacitors.
In Figure 4a we see the method of determining absolute peak magnitude from a phase measurement typical of those recorded during the EPRI DPQ Project. For each waveform, we can determine a peak magnitude, which can either be the absolute value of the positive or the negative peak depending upon which is larger. In the example provided, we identify a peak of 1.34 pu.
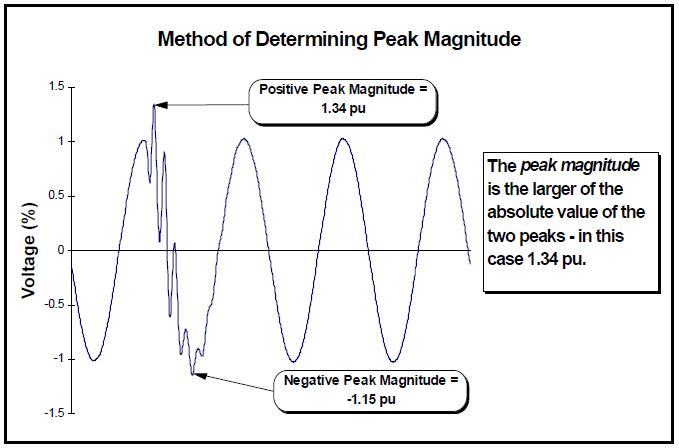
Figure 4a: Method of Determining Absolute Peak Magnitude
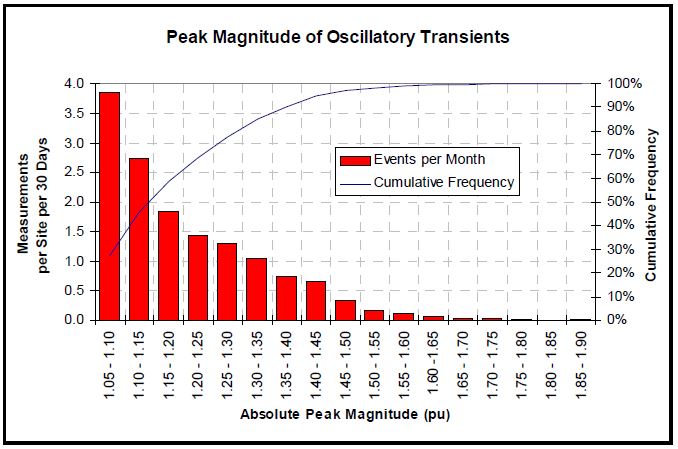
Figure 4b: Histogram for Magnitude of Oscillatory Transients, Measurement Events, Jun-1-1993 to Sep-1-1995, Treated by Sampling Weights, All Sites
The statistical tool to analyze many of these measurements is a histogram; Figure 4b displays this histogram for the period from Jun-1-1993 to Sep-1-1995. The data represents all sites that were active in the project during that time. The height of each column represents the number of times that a particular peak magnitude was recorded, while the value along the vertical axis provides the peak value itself. The height has been normalized by the 1389.13 monitor, months registered during this monitoring period. From Figure 4b we can say that a peak magnitude due to capacitor switching between 1.30 and 1.35 pu (>1.30 and ≤ 1.35 pu) was recorded on average 1.047 times per 30 days per site. Additionally, the cumulative frequency can be used to tell us that a capacitor transient larger than 1.35 pu occurred on average 2.158 times per 30 days per site (100% – 84.96%), (14.342 events/month).
Harmonic Distortion
Harmonic distortion on the utility system is the result of connecting nonlinear customer loads such as adjustable speed drives, arc furnaces, compact fluorescent lights, and rectifiers. Rectifier power supplies are found in nearly every modern computer, ubiquitous in offices today. The problem arises because these loads do not draw current for the entire power cycle, and can be modeled as actually “injecting” current of frequencies that are integer multiples (harmonics) of the fundamental power frequency (50 Hz or 60 Hz). When the current injected is large relative to the amount that the power system can absorb, the level of voltage distortion local to the area of the nonlinear load is increased. Large levels of harmonic distortion result in overheating of motors, generators, and transformers, premature operation of protective devices including fuses, and metering inaccuracies. IEEE Std. 519-1992 provides guidelines and limits for current and voltage distortion levels on transmission and distribution circuits. Harmonic distortion originates with nonlinear devices on the power system. Nonlinear devices produce non-sinusoidal current waveforms when energized with a sinusoidal voltage. Examples of these devices are adjustable speed drives, switching power supplies (including computers and other office equipment), fluorescent lighting, battery chargers, saturated transformers, and arc furnaces. Nearly all of these are nonlinear and are shunt elements, the bulk of which are loads.
For each three-month quarter of the project, basic statistics for each site were computed for voltage THD and the 2nd through 13th harmonics. Some of the statistics included 5th percentile and 95th percentile. Also known as the CP05 and CP95 values of the site’s distribution, they are excellent measures of lower and upper limits. As a basic interpretation, 5% of the samples were less than the 5th percentile, and 5% of the samples were larger than the 95th percentile. Figure 5a presents a graphical method of understanding these percentile values. Also computed for each site during the quarter was the arithmetic mean, which was performed by summing all of the values of the distribution and dividing by the number of samples. The voltage THD and harmonic components were normalized using the fundamental (60 Hz) voltage component of each sampled waveform (V1).
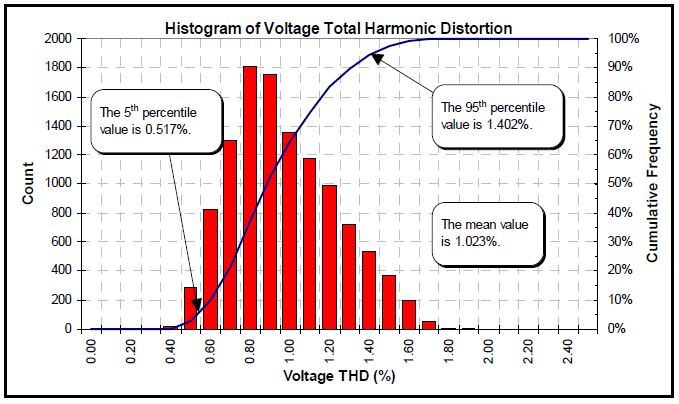
Figure 5a: Voltage THD histogram illustrating percentiles at one monitoring site for one quarter
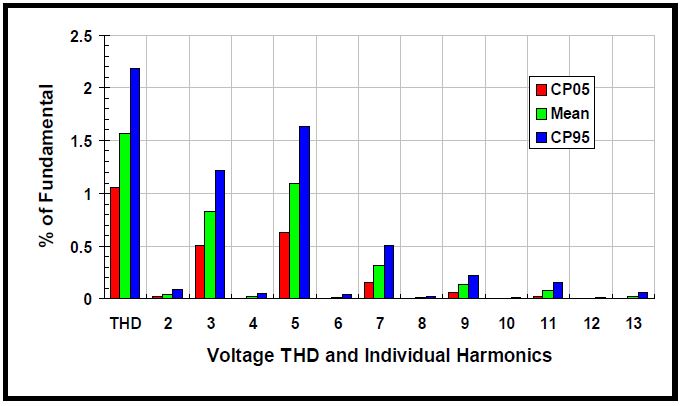
Figure 5b: Voltage THD and Individual Harmonics, Jun-1-1993 to Mar-1-1995, Treated by Sampling Weights, All Sites
We computed a set of CP05, mean, and CP95 values for each site and each quarter. In constructing Figure 5b, which is a summary chart for voltage harmonic distortion, each of the values was weighted and averaged using the ratio estimator method described (2). This method provides us with estimate of the true CP05, mean, and CP95 for the population of every feeder of the twenty-four EPRI DPQ utilities.
We see that even harmonics are rare, as are harmonics above the 13th. This is not to say that these harmonics did not appear in the project’s five million samples; they just were not common to all sites in general. The harmonic orders with the largest magnitudes were the 3rd, 5th and 7th. Single-phase power supplies are a source of the 3rd harmonic, while the 5th and 7th harmonics are characteristics of six-stepped inverters. From Figure 5b, we can say that the average value of voltage THD at a site is 1.57%. Additionally, 95% of the samples had a mean 3rd harmonic component of less than 1.21%.
PQView
The data collected during the EPRI DPQ Project was enormous, considering the technology available to us at the project’s onset. Its analysis would have been an all but insurmountable task without a software system for automatically characterizing measured events and storing the results in a well-defined database. PQView® is the tool we developed to pull together all of the facets involved in that monitoring project. PQView has now become part of the EPRI Power Quality Diagnostic System (PQDS).
PQDS is a general purpose tool being developed by Electrotek Concepts and funded by EPRI that helps a utility organize the data collection, processing, and analysis tasks associated with power quality issues. It should orchestrate a much more efficient power quality investigation, allowing a power provider better customer support with less work force. A PQDS user will be able to use various modules to help conduct a case study with the results being stored in an Investigation Database. Two modules completed for 1997 included a Measurement Module and an Event Identification Module.7
PQView is the PQDS Measurement Module. It provides data collection, characterizing, analysis, and reporting roles. This module maintains the database of all monitoring results utilized by the PQDS, including both raw measurement data and data characterized for statistical analysis and reporting. We have designed the Measurement Module for interfacing with the monitoring equipment software provided by the vendors of the third-party monitoring equipment. The measurement module will acquire data from the databases or files recorded by the actual monitoring equipment software, characterize the data, and provide analysis tools.
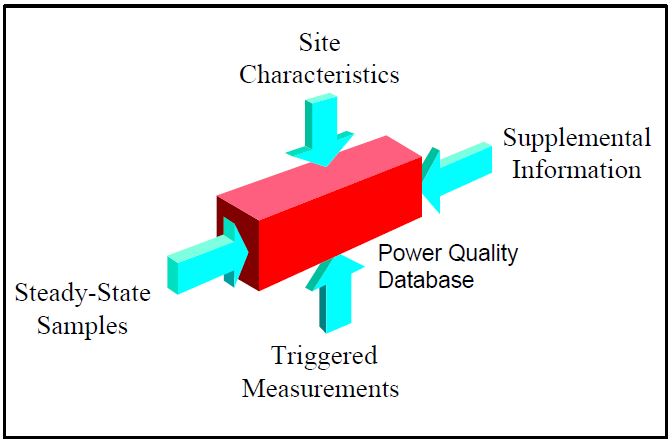
Figure 6: PQView builds power quality databases
Table 1: Monitoring platforms and standard formats currently supported by PQView
| Basic Measuring Instruments | Dranetz Technologies | Reliable Power Meters | Standard Formats |
|---|---|---|---|
| • EPRI PQPager 3100 • PQNode Models 7100, 8010, 8020 | • DRAN-SCAN® 2000 | • Omega Power Analyzer | • Power Quality Data Interchange Format (PQDIF) |
PQView allows a user to create any number of power quality databases and to decide which data are loaded into the database, conceptually illustrated in Figure 6. This provides flexibility in deciding how to organize the information. The power quality database created and managed by PQView can also include data from other sources, such as site surveys with other measuring equipment. Input filters, listed in Table 1, have been developed in PQView to incorporate measurement results from a variety of commonly used instruments.
With PQView, a power quality investigator can choose from a number of pre-defined charts and reports. For steady-state analysis, PQView provides a Steady-State Wizard which can generate both trends and histograms for these steady-state characteristics:
• peak, rms, and harmonic rms values
• even, odd, and total harmonic distortion
• crest, form, and telephone interference factors
• negative- and zero-sequence unbalance
• magnitudes and phase angles of individual harmonics
Figures 7a and 7b display examples of steady-state analysis. For analyzing sags, swells, and interruptions, we provide an RMS Variation Analysis Panel which gives the user flexibility in analyzing and displaying statistical graphs. Some of the reporting options are displayed in Figure 7c and 7d. Event summaries are informational reports providing the information for where, when, and what happened at different monitoring sites in a system. PQView bases voltage sag analysis upon both statistical and graphical representations of measurements.
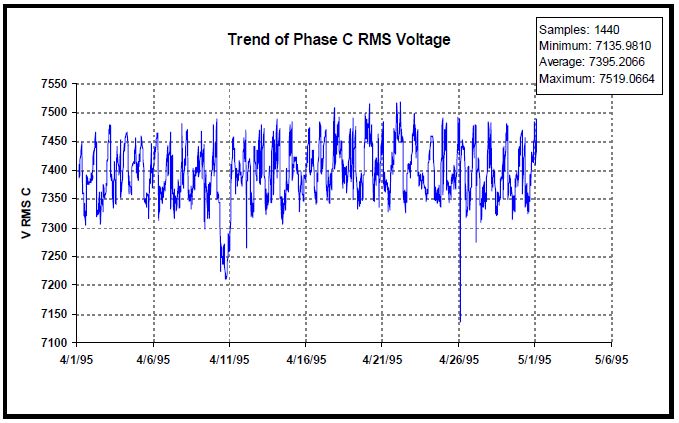
Figure 7a: Trend of Steady-State Sampled Data
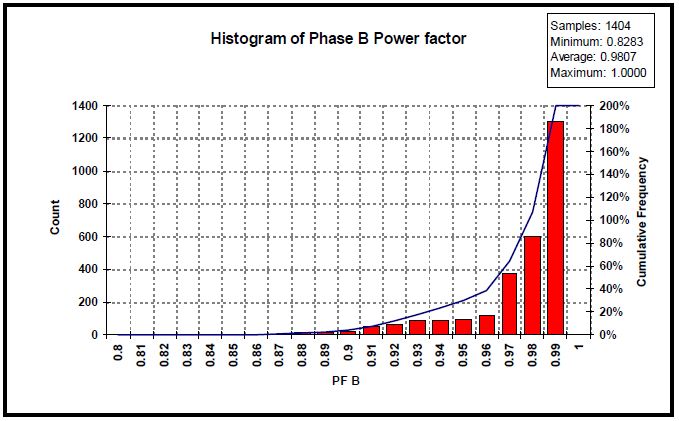
Figure 7b: Histogram of Steady-State Sampled Data
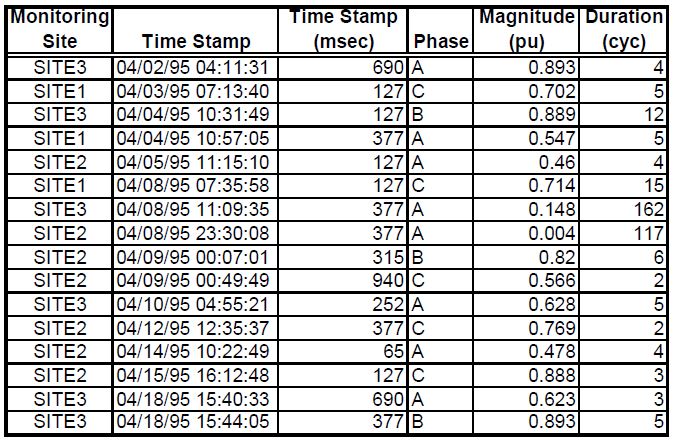
Figure 7c: Event Summaries
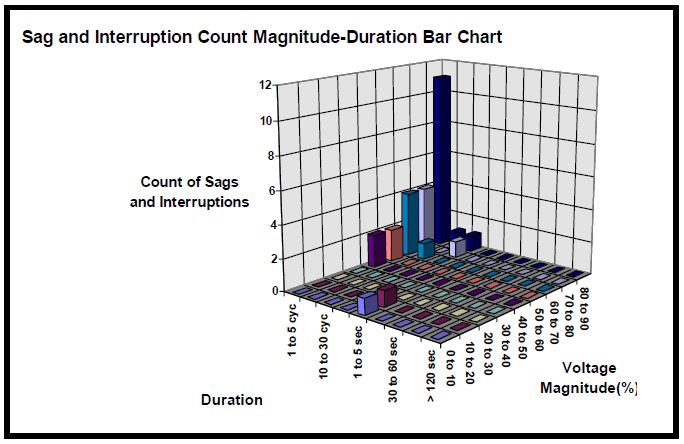
Figure 7d: Voltage Sag Statistical Analysis
Power quality problems are customer problems. If voltage variations do not cause any problems with customer equipment, they are not power quality problems. Since customers are an integral part of the power quality equation, it is important to include them in the power quality monitoring effort. The PQView power quality monitoring system is designed to include the customer and utility field personnel through direct communication. Although the data management tasks are still performed by PQView’s data manager module, the data analysis tasks can be performed by a server computer that accepts remote instructions from a world wide web browser such as Netscape™ or Microsoft’s Internet Explorer™. By using a web browser, PQView becomes a multi-platform application, being able to cross boundaries based on incompatible operating systems.
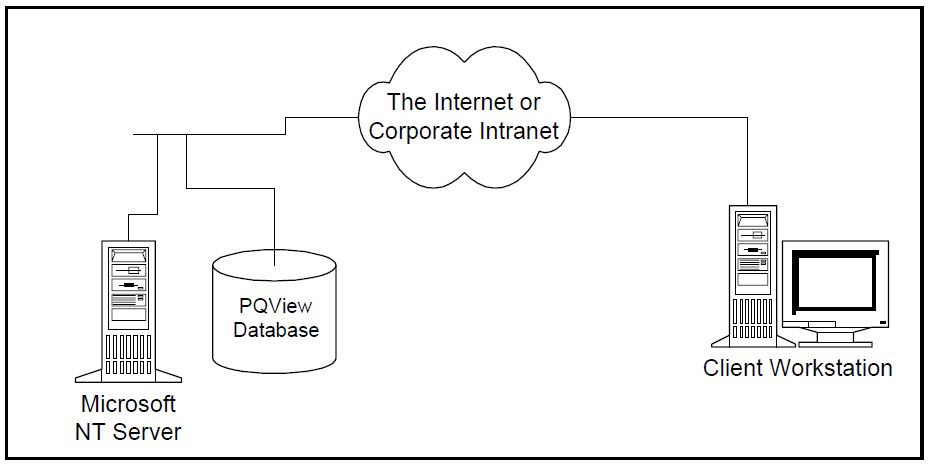
Figure 8: PQView can operate either in either Microsoft Access 95 workstation mode or in a client/server mode. In client/server mode, a server computer maintains the power quality measurement database and runs queries to satisfy the analysis needs of remote clients. The client workstation needs only a World Wide Web browser to access the server’s data.
RMS Variation Performance Indices
The EPRI Distribution Power Quality Project provides a statistical assessment of existing power quality levels on a large-scale basis. Many utilities, however, lack the expertise to devise and implement an assessment of their individual distribution systems. The EPRI Reliability Benchmarking Methodology (RBM) will provide utilities with the methodology required to make these individual utility assessments. One of the primary objectives of the RBM Project is to define an extensive set of service performance indices which assess all areas of power quality based on monitored data. In the past, sustained interruption indices such as SAIFI (System Average Interruption Frequency Index) and SAIDI (System Average Interruption Duration Index) were often sufficient for assessing service quality because reliability could be equated to continuity of service. The proliferation of high-efficiency, highly sensitive power electronic devices in all customer sectors has increased customer expectations concerning the electricity delivered from the power supplier. For these sensitive customers, indices assessing only sustained interruptions do not adequately assess utility service quality.
The purpose of the EPRI DPQ Project was to compile the power quality data required to develop a national baseline and to provide a database against which utilities can benchmark themselves. The results of the EPRI RBM Project provide the methodology and the tools needed for individual utilities to monitor and quantify distribution system reliability in terms of the quality of service provided. The RBM Project consists of four main tasks:
- Develop a set of guidelines which describe how to implement a monitoring system which yields a statistically valid database of power quality measurements
- Develop a set of reliability indices which assess all areas of service quality including both momentary and sustained interruptions, sags, swells, harmonic distortion, transient overvoltages, steady-state regulation, and phase voltage unbalance
- Benchmark the defined reliability indices using the EPRI DPQ database
- Develop a distribution system state estimation software tool which provides a power quality profile for an entire circuit based on measured data recorded at a limited, discrete number of monitoring points.
The methodologies developed are integrated into software tools allow users to automatically calculate specified indices. One of these software modules implements the distribution disturbance state estimation that provides power quality profiles at points across the system where monitoring may not be implemented. We have developed another software tool which is an index calculation module integrated with the EPRI PQView software package. Figure 9 shows a block diagram representing how these two software tools are used together to allow a utility to assess the reliability of an entire distribution system or of any subsystem in terms of the developed indices. Utilities will also be able to compare calculated indices to the baseline values obtained by benchmarking the EPRI DPQ Project database.
The EPRI RBM Project indices provide utilities with the means to more fully assess the quality of service which they are providing their customers. We have categorized the new indices into four service quality disturbance groups: short duration rms voltage variation, harmonic distortion, transient overvoltages, and steady-state voltage variations. This paper will focus on only one index, considered one of the most important for general use among EPRI utilities.
SARFIx
System Average RMS (Variation) Frequency IndexThreshold (SARFIx ). SARFIx represents the average number of specified rms variation measurement events that occurred over the assessment period per customer served, where the specified disturbances are those with a magnitude less than x for sags or a magnitude greater than x for swells.

where
• x ≡ rms voltage threshold; possible values − 140, 120, 110, 90, 80, 70, 50, and 10
• Ni ≡ number of customers experiencing short-duration voltage deviations with magnitudes above X% for X >100 or below X% for X <100 due to measurement event i
• NT ≡ number of customers served from the section of the system to be assessed
Note that SARFI is defined with respect to the voltage threshold x. This allows for an assessment of rms variations of a specified voltage level. For example, if a utility has customers which are only susceptible to sags below 70% of nominal voltage, this disturbance group can be assessed using SARFI70. All of the rms variation indices are defined using this voltage threshold. Note also, that the eight defined values for the index voltage threshold are not arbitrary values. They are chosen to coincide with the following:
• 140, 120, and 110: Overvoltage segments of new guidelines proposed for information technology equipment
• 90, 80, and 70: Undervoltage segments of new guidelines proposed for information technology equipment
• 50: Typical break point for assessing motor contactors
• 10: IEEE Std. 1159-1995 definition of an interruption1
This index is similar to the System Average Interruption Frequency Index (SAIFI) value that many U.S. utilities have calculated for years. SARFIx, however, assesses more than just interruptions. The frequency of occurrence of rms variations of varying magnitudes can be assessed using SARFIx. Note that SARFIx is defined for short-duration variations as defined by IEEE 1159-1995 (i.e., events less than sixty seconds). Other indices not discussed in this paper are defined for long-duration variations, undervoltages and overvoltages.6
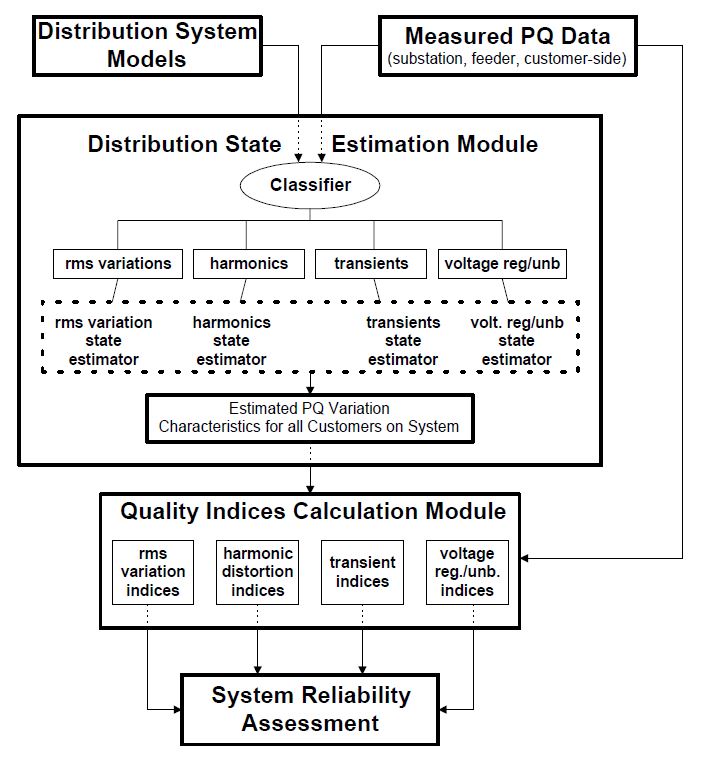
Figure 9: Flow diagram illustrating the process of assessing system reliability based on the system model and the measured power quality data
Conclusions
The primary goal of the EPRI DPQ Project’s final report was to present the statistics of power quality measurements collected during the project’s two-year monitoring period. However, all aspects of power quality were addressed in order to establish a reference for the data results presented.
The site selection process is fully described and serves as a useful model for monitoring projects which are designed to be compared with the DPQ Project. The monitoring instrument designed to collect the project’s data – the PQNode – was the first instrument designed to describe the full range of power quality variations including steady-state variations (harmonic distortion, unbalance, regulation) and disturbances (rms voltage variations and transients). Its specifications and capabilities are addressed here. The project’s data collection process is explained, another useful reference for conducting large and small monitoring projects. Triggering methods, characterization algorithms, and statistical analysis are presented for four categories: rms voltage variations, transient overvoltages, harmonic distortion, and voltage regulation. The report also presents definitions and references to power quality standards.
Monopolistic, vertically integrated utilities are becoming an institution of the past as electric power deregulation changes the utility industry worldwide. Increasing pressures for cheaper and higher quality power has forced each utility to seek to reduce waste within their own organizations, as well to market their product − electric power − as more desirable than its neighboring systems. Power monitoring will be the method for utilities to prove their quality to their customers, while at the same time it will serve as the means for power consumers to keep a check on their utility. Both sides will utilize enhanced reliability indices to close the compatibility gaps between what power quality sensitive electronics can tolerate and the electrical environment in which they are used.
References
- IEEE Std. 1159-1995, Recommended Practice for Monitoring Electric Power Quality (1995).
- Electric Power Research Institute, An Assessment of Distribution System Power Quality, Volume 2: Statistical Summary Report. Palo Alto, California, EPRI TR-106294-V2 (May 1996).
- Gunther, H. Mehta, “A Survey of Distribution System Power Quality – Preliminary Results.” IEEE Trans. Power Delivery, Vol. 10, No. 1, pp. 322-329 (January 1995).
- Markel, C. J. Melhorn, S. R. Williams, H. Mehta, “Design of a Measurement Program to Characterize Distribution System Power Quality.” Proceedings: 12th International Conference on Electricity Distribution (CIRED’93), Birmingham, England (May 1993).
- D. D. Sabin, A. Sundaram, “Quality Enhances Reliability.” IEEE Spectrum. Vol. 33, No. 2, pp. 34-41 (February 1996).
- D. L. Brooks, M. Waclawiak, A. Sundaram. “Using Enhanced Reliability Indices to Characterize Distribution System Power Quality.” Conference on Power Quality End-Use Applications and Perspectives (PQA’97 North America), Columbus, Ohio (March 1997).
- J. Lamoree, R. Scott, R. Dwyer, P. Snow, C. Saylor, J. Rhea, S. Bhatt. “Automatic Identification of Power Quality Variations in the Power Quality Diagnostic System.” Conference on Power Quality End-Use Applications and Perspectives (PQA’97 North America), Columbus, Ohio (March 1997).
- M. B. Hughes , J. S. Chan, “Canadian National Power Quality Survey Results,” Conference on Power Quality End-Use Applications and Perspectives (PQA’95), New York, New York (May 1995).
- D. S. Door, “Point of Utilization Power Quality Study Results.” IEEE Transactions on Industry Applications, Vol. IA-31, No. 4 (July 1995).
- W. Dabbs, D. D. Sabin, T. E. Grebe, “Probing Power Quality Data” IEEE Computer Applications in Power, Vol. 7, No. 2 (April 1994).
- Bollen, M. H. J., “Characterisation of Voltage Sags Experienced by Three-Phase Adjustable-Speed Drives.” Conference Record of the 1996 IEEE Industry Applications Society Annual Meeting, San Diego, California (October 1996).
- C. Greiveldinger, et al., “New Power Quality Contracts in France,” Proceedings of the Third International Conference on Power Quality: End-Use Applications and Perspectives (PQA ’94), Amsterdam, the Netherlands, paper number E-101 (October 1994).
