Published by
- Ir. M. van Lumig, Electrical Power Systems, Analysis and Concepts Laborelec NL Beek-Maastricht Airport, the Netherlands, e-mail: michiel.vanlumig@laborelec.com
- Ir. S. Bhattacharyya, Electrical Energy Systems Group Technical University Eindhoven Eindhoven, the Netherlands, e-mail: s.bhattacharyya@tue.nl
- Dr. ir. J.F.G. Cobben, Electrical Energy Systems Group Technical University Eindhoven Eindhoven, the Netherlands
- Prof.ir. W.L. Kling, Electrical Energy Systems Group Technical University Eindhoven Eindhoven, the Netherlands
Source paper: International Conference on Renewable Energies and Power Quality (ICREPQ’11) Las Palmas de Gran Canaria (Spain), 13th to 15th April, 2010. Website: https://www.icrepq.com/icrepq’11/262-bhattacharyya.pdf
Abstract
This paper describes the results of a four years (2006-2010) Power Quality (PQ) monitoring campaign conducted in the Dutch networks. Purpose is to get insight in the PQ at the point of connection (POC) of some connected customers with typical characteristics as for example distributed energy resources (DER) and to compare these results with the limits given in the EN50160. The results show however no specific problems near a large amount of photo voltaic (PV) panels. There was no correlation found between the harmonic distortion of the grid voltage and the production of solar energy. Pst levels are slightly higher on semi-cloudy days, but due to the low grid impedance never exceed the standard limits. Also near wind turbines no problems with the PQ are visible. The PQ near disturbing loads, like variable speed drives (VSDs), shows higher 5th and 7th order harmonics on MV level. Overall, because of the usually strong Dutch grids, no PQ problems were measured at the specific locations.
Keywords: Power Quality (PQ); distributed energy resources generation (DER); point of connection (POC); EN50160; PQ monitoring.
1. Introduction
The paper describes the results of the PQ monitoring campaign within the EOS-LT ‘Voltage Quality of the Future Infrastructure’ (KTI) project [1]. A four-year measurement campaign is being carried out, acquiring Power Quality (PQ) data at 20 different locations in the Dutch LV, MV and HV grids. Purpose is to get insight in the PQ at the Point Of Connection (POC) of some connected customers with typical characteristics as for example distributed energy resources (DER) and to compare these results with the limits given in the EN50160 [2] and Dutch ‘Grid Code’ [3]. The requirements in the Dutch Grid Code, at some points, are different from the requirements in the EN50160. The most important differences are the requirements on flicker (Plt <5 for 100% of the time), THD(U) and 5th order harmonic voltages. All differences between the EN50160 standard and the Dutch ‘Grid Code’ are given in Table 1.
Table 1 Main differences between the EN50160 standard [2] and the Dutch ‘Grid Code’ [3]
| Parameter | Dutch Grid Code | EN50160 |
|---|---|---|
| Flicker severity | Plt ≤ 5 for 100% of the time | Plt ≤ 1 for 95% of the time |
| Voltage unbalance | Negative sequence voltage <3% of the positive sequence during 100% of the time | Negative sequence voltage <2% of the positive sequence during 95% of the time |
| Total harmonic voltage distortion | THD(U) ≤ 12% during 99.9% of the time | THD(U) ≤ 8% during 95% of the time |
| 5th harmonic voltage | 9% for the 99.9% of the measurement period | 6% for 95% of the measurement period |
| Fast voltage variations | ≤10% Un; it is ≤3% Un in situations without loss of production | As per IEC 61000-3-3 limits relative steady state voltage change ≤3.3% Un |
2. Details Measurement Equipment
The equipment used in the monitoring program measures according to the EN 61000-4-30. A UPS (12V/1,2 Ah) is integrated to have an average autonomy of 30 minutes. All devices are equipped with a GSM/GPRS modem for communication with the central database. Downloading of the measurement data is performed every day, while the internal memory is 512 MB (enough for 2 month measuring when recording 10 minutes RMS data). The data is analyzed following the standard EN 50160 and the influence of the connected load on the voltage is analyzed.
3. Measurement locations
The measurements locations were chosen in the neighborhood of DER, household loads or disturbing loads such as a stone factory (flicker) and a plastics factory (harmonics). In this way, the measurements give insight in possible future PQ levels in the neighborhoods with DER or new (disturbing loads). Measurements are carried out at the POC of different customers and/or DER. The locations changed during the measurement period according to the needs within the project. The most important PQ monitoring locations are shown in Table 1. The PQ performance of all of the measurement locations will not be discussed in detail. The main focus in this paper is on photo voltaic (PV) installations, wind turbines, other ‘possible problem’ locations and household areas.
Table 2 PQ monitoring for ‘KTI’ project
| Measurement Location | Main PQ parameters |
|---|---|
| 1 Wind turbine (LV) | Voltage variation, flicker |
| 1 Wind turbine feeder (MV) | Voltage variation, flicker |
| 1 Wind turbine feeder (MV) | Harmonics, voltage variation |
| 7 locations with households/small commercial customers (LV) | Harmonics, flicker |
| 1 Stone factory (LV) | Flicker |
| 1 Plastic factory (LV) | Harmonics |
| 3 Green houses with CHP/lighting (LV+MV) | Harmonics, voltage variation |
| 1 Connection to railway (HV | Unbalance, asymmetry |
| 1 Bio-energy plant (MV) | Harmonics |
| 1 Micro CHP (LV) | Harmonics, flicker |
4. Measurement Results
In this chapter the main results of the PQ measurement campaign will be discussed. Focus is on finding the relation between the PQ phenomena and the disturbing sources, like PV inverters and power electronics.
A. PQ near PV panels
Three of the measurement locations are near large amounts of PV inverters. The inverters are single phase. Depending on their design and grid impedance, the inverters cause distortion on the grid voltage. To correctly analyze the caused distortion, two situations are compared: 1) summer situation with high PV production (Fig. 1) and 2) winter situation with no PV production due to snow on the panels (Fig. 2). In this way harmonics caused by other household equipment are comparable.

Fig. 1 THDu (%) (red), 3rd, 5th and 7th harmonic (blue, orange, rose) and feeder loading (green) in summer
Fig.1 and Fig. 2 clearly show that the harmonic distortion on the voltage is low in the neighborhood of many PV panels. In summer, during sunny days, the THDu (%), the Total Harmonic Distortion of the RMS voltage, is about 2.5%, in winter time about 1,7%. This extra distortion seems to be caused by the PV inverters, but the influence is very small. A third order harmonic voltage, caused by many rectifiers used in household equipment, is clearly visible and increases during peak demand. The main harmonic voltage is the fifth, but still well below the limits of the Dutch ‘Grid Code’.
Another interesting parameter is the voltage level at the end of a feeder near many PV panels. The phase-to-neutral voltage never reached a level above 240V at the measurement location, but the correlation between grid voltage and PV production is clearly visible. In grids with higher impedance or even more installed PV panels, grid voltage could reach critical levels. This has not been measured at the measurement locations.
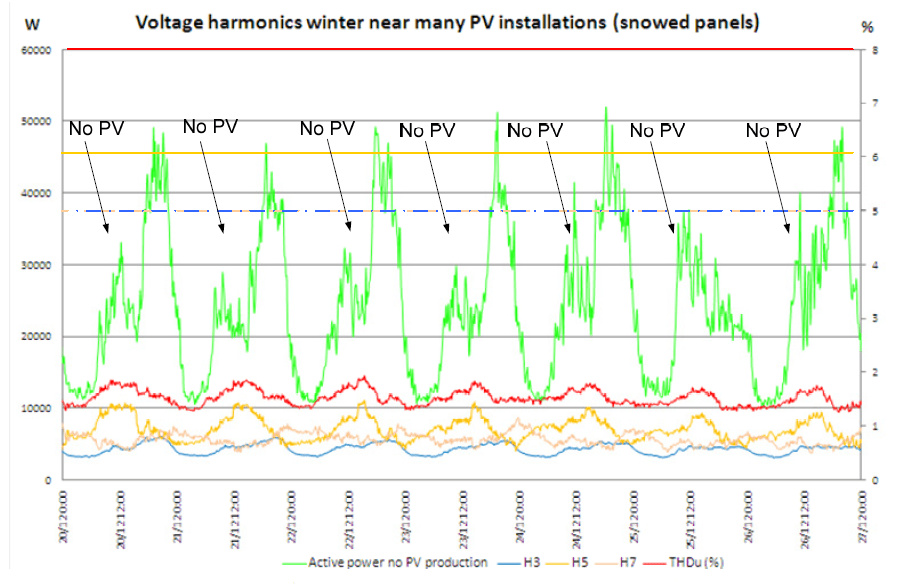
Fig. 2 THDu (%), 3th harmonic and feeder loading in winter
On semi-cloudy days PV panels are subject to variations in sun irradiation and therefore the PV production will vary accordingly. The measurements show indeed a higher Pst and Plt level, but well below the limits of the Dutch ‘Grid Code’ (Fig. 3).
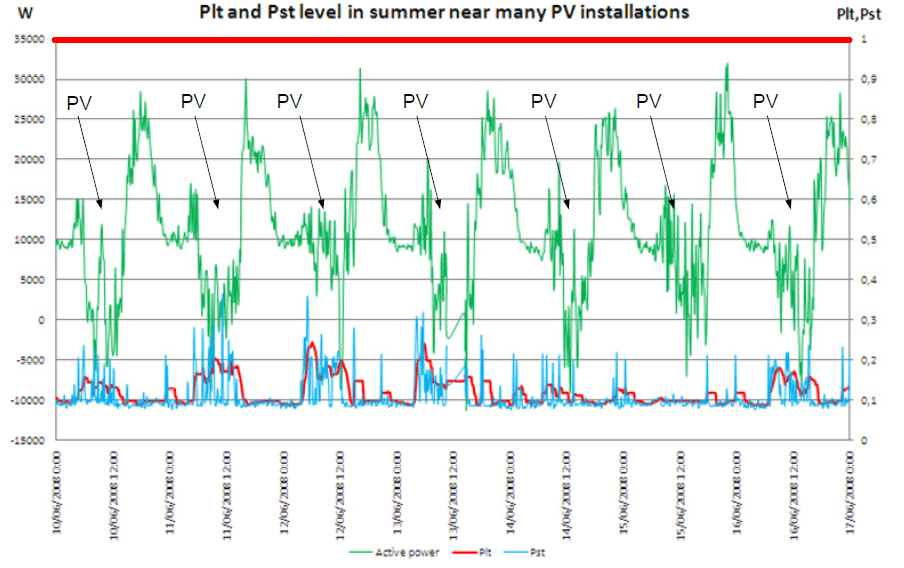
Fig. 3 Pst , Plt and loading of the feeder in summer
B. PQ near wind turbines
Wind turbines are connected to the grid via power electronics which, when not properly designed, can cause harmonic distortion on the grid voltage. To analyze this effect two measurements are carried out, one at the terminals of a 600 kW wind turbine and one at the end of a MV feeder with many wind turbines connected.

Fig. 4 Harmonic currents produced by a 600 kW wind turbine at nominal power
In Fig. 4 the 5th, 7th, 13th and 15th harmonic currents are clearly visible. This spectrum of harmonic currents is typical for a 6-pulsed bridge. The distortion of the grid voltage is low, the measured THDu (%) is between 1% and 3%. Because there are many wind turbines connected to this feeder, the influence of one wind turbine could not be distinguished. Also at the beginning of the feeder the measured voltages and currents were analyzed (Fig. 5).
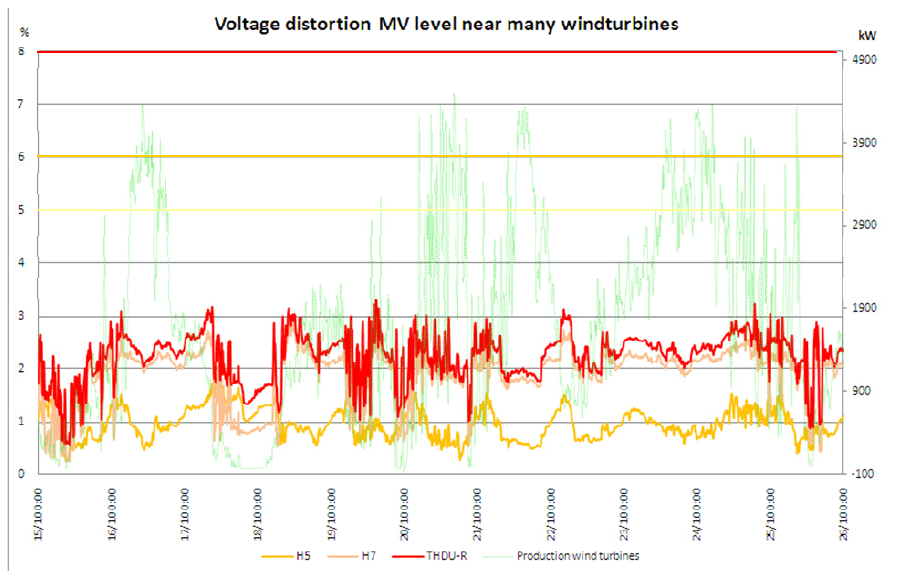
Fig. 5 THDu (%) measured at MV level near many wind turbines
From this figure it’s hard to find any correlation between wind production and the THDu (%) level. Therefore is looked at different situations with increased production of wind power. The average value of THDu (%) is calculated in these intervals for 2010.

Fig. 6 THDu (%) on MV level in function of wind power production
Fig. 6 shows an increase in THDu (%) with increasing wind power, but after an increase to about 2% it stays somewhat constant with increasing power production.
Another PQ parameter which might be increased by wind turbines is the flicker level Plt. High current peaks due to wind surges can cause Plt levels to increase. This is analyzed in Fig. 7. There is some correlation found between the max or ΔI current drawn and the flicker levels. But on average there was very little Pst caused by the wind turbines. At some specific events the Pst increased suddenly, these were analyzed to find out whether the Pst level came from other feeders or HV. At these specific moments the Pst was high, caused by sudden voltage distortion. This voltage distortion was caused by 3rd order harmonic voltages. At the same time there was no 3rd order harmonic current increase from the wind turbines. The cause of the sudden voltage distortion on MV level is still unknown.

Fig. 7 Pst and Plt level at MV near many wind turbines
C. PQ level near a stone factory
The PQ level is not only influenced by DER, loads play an important part in disturbing the grid voltage. Nonlinear loads, which draw a non-sinusoidal current, can cause voltage distortion in the form of harmonic voltages. Loads also can cause sudden voltage dips, due to high currents compared to the short-circuit power available. One of the measurements is carried out at the LV-side of a transformer connecting a stone factory. Because of the processes in this factory, high currents are regularly drawn from the grid, causing a high Plt level (Fig. 8).

Fig. 8 Pst and Plt level at the POC of a stone factory
In Fig. 8 it can be clearly seen that there is a one to one correlation between the power drawn and the Pst and Plt levels. Also it’s clear that the company is not producing in weekends, and the power and flicker level is at much lower levels. Although the Plt level was not above limits, the grid operator changed the grid topology at this location to solve the problem.
D. PQ near a plastics factory
High currents can cause dips, rapid voltage fluctuations can cause flicker. But another increasing problem is the non-linear currents drawn by power electronics used in many loads. In fact any equipment using DC voltages and connected to the public grid has non-linear elements. Examples are power sources used in PCs, flat screen panels and energy saving lamps. These sources are mainly one phase and draw currents with large peaks to maintain the DC-bus voltage. In industry also more and more nonlinear loads are connected, like variable frequency drives. These drives, in most cases 6-pulsed, can cause high harmonic currents when not a correct filter is used. A typical layout of a 6-pulsed bridge is shown in Fig. 9.

Fig. 9 Typical layout of a 6-pulse bridge
To measure the influence of many variable speed drives (VSDs) on the grid voltage, a measurement is carried out at MV level near a plastics factory with many VSDs. This measurement is shown in Fig. 10.
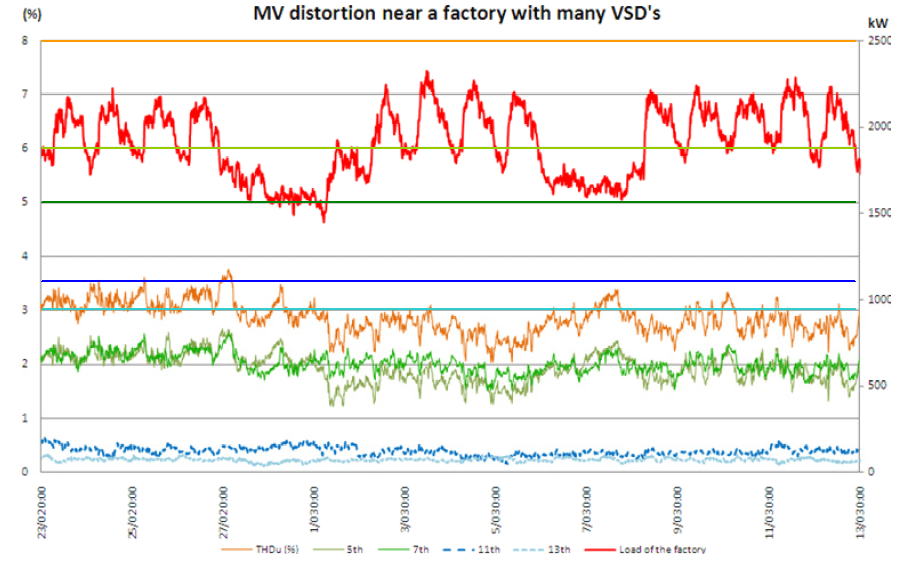
Fig. 10 Harmonics at MV level near many VSDs
The THDu (%) at MV level varies between 2% and 4% and is mainly caused by 5th, 7th, 11th and 13th order harmonic voltages. This can be seen in Fig. 11. The harmonic voltages are caused by the harmonic currents drawn by all VSDs together. The harmonic current spectrum of a 6- and 12-pulsed drive is shown in the picture in Fig. 11.
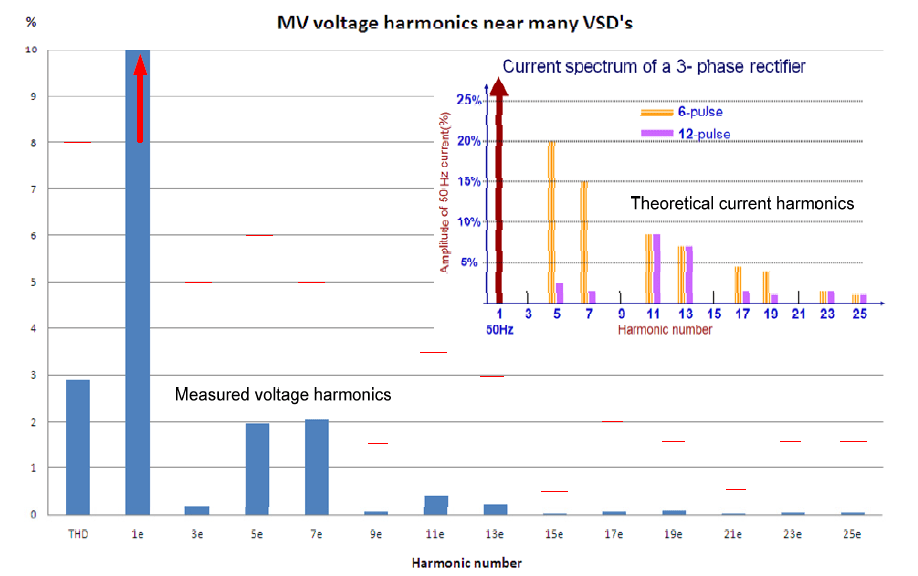
Fig. 11 Harmonic voltage spectrum at MV level near a plastics factory
Although the THDu (%) is below 8%, it’s important to notice the effect of the VSDs on MV level. Reducing the harmonic currents with effective filtering would help to reduce the harmonic voltage distortion. This is important because a distorted grid voltage can cause damage and extra losses in equipment.
E. PQ in a household area
Almost all household equipment nowadays uses power electronics and this will increase in the future. Not only there will be more electronic devices, also resistive devices like the well known incandescent lamp is more and more replaced by energy saving lamps, which uses a driver with non-linear elements. The main source of harmonic currents in a household is coming from electronic power supplies. These power supplies, depending on type and brand, inject harmonic currents in the grid. In most cases, these currents have influence on the grid voltage. Most of the household appliances are of single-phase rectifier configuration and have a typical current characteristic as shown in Fig. 12.
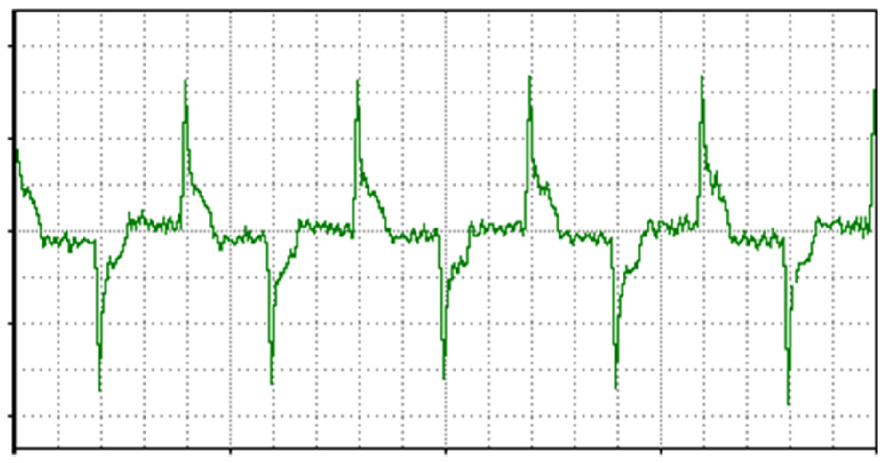
Fig. 12 Current drawn by a typical power source
As the power demand of an electronic power source is low, a single device does not cause problem in the grid voltage. It will also individually meet the limits of standards. However, many of such devices in a neighborhood can have significant influence on the grid voltage. Therefore a measurement at the LV level of a 400 kVA transformer is performed in a neighborhood with households and some small shops. The results are shown in Fig. 13.

Fig. 13 Harmonic voltage spectrum at the LV side of a 400 kVA distribution transformer
The THDu (%), the most left column, is on average 2.1% and never exceeds 3%. The main harmonic voltages are 3rd, 5th and 7th. All are well below the limits. In Fig. 14 the 95% and 99.9% probability values are given for a household located at the end of a LV cable.
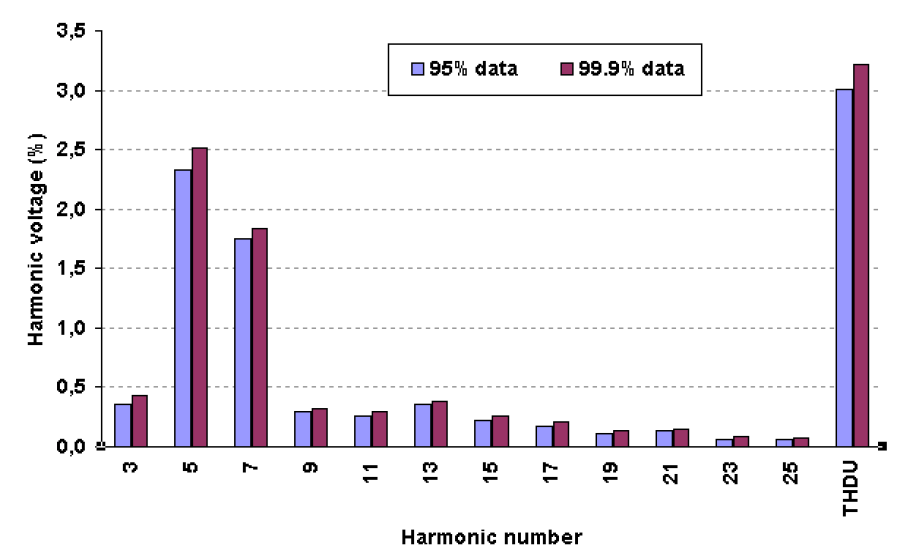
Fig. 14 95% and 99.9% probability values at a household POC located at the end of a LV cable
Other measurements in household areas confirm these levels. There are of course examples of higher values, but the measurements at the specific locations show no alarming results.
Therefore, at present, all voltage harmonic values meet the EN50160 and Dutch ‘Grid Code’ limits. However, one remark can be made about the voltage limits given for higher order harmonics. As per the standards, the 15th and 21st harmonics voltage limits are quite low (only 0.5%) in comparison to the limits given for (13th, 17th, 19th, and 23rd harmonics). The limiting value of 13th harmonic is 3%, whereas that for 17th is 2%. The limits for 19th, 23rd and 25th are 1.5%. From the measurements, these values are all comparable as shown in Fig. 14. Similar observation is made at many measuring locations in the LV network in the Netherlands and also in other networks of the world [4], [5]. Therefore, in future, the limits for 15th and 21st harmonics would probably be needed to modify.
The flicker levels Plt and Pst are also well below the limits of the Dutch ‘Grid Code’, see Fig. 15 and 16.

Fig. 15 Pst and Plt level at the LV side of a 400 kVA distribution transformer

Fig. 16 Frequency of flicker severity levels at a household POC located at the end of a LV cable (one week’s data)
From Fig 16, it can be seen that the probability distribution of Pst and Plt values remain within the range of 0.2-0.3 during the measurement period (of one week). It is similar to the observation that is recorded at the LV side of the distribution transformer (refer Fig. 15).
In the national monitoring program of the Netherlands, voltage dips are mainly recorded in the HV networks. A continuous PQ measurement is needed for a duration of minimum 2-4 years to register voltage dip characteristics at a site. Under the ‘KTI’ monitoring campaign, MV sites are also measured. The equipment used for measuring PQ levels is programmed to detect events, like dips, surges, and crossing programmed limits for other PQ parameters. During the measurement campaign many events were recorded, mainly without knowing the reason for the event.
But one measurement in a specific rural area, known for PQ problems, showed indeed a lot of disturbances. A voltage dip-duration table of one year measurement is shown in Fig. 17.

Fig. 17 Voltage dip duration (DisDip) table from an area with a ‘weak’ grid (1 year period)
In total 135 events were registered in one year, of which 104 were of the category dips.
The measurement conducted at an industrial site (stone factory) also recorded voltage dip events during a two years period. Fig 18 shows various single-phase, two-phase and three phase voltage dips events that were measured at the above site. It can be noticed that most of the dips have a residual voltage of 80% or more. Therefore, the specified customer did not suffer any significant financial loss at his installation. It can be remarked here that for a sensitive customer (such as a semiconductor plant), even such type of voltage dips can also cause process failure. Therefore, suitable mitigation methods should be applied there to prevent the installation’s equipment mal-operation and process interruption.
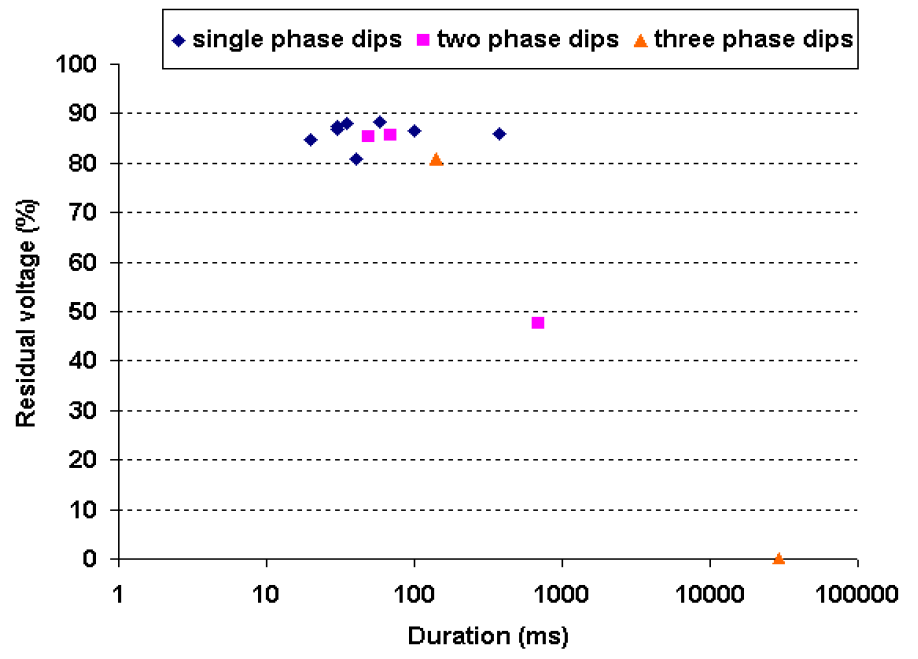
Fig. 18 Voltage dips recorded at the stone factory (2 years period)
5. Conclusion
The main results of the PQ measurement campaign within the EOS-LT KTI project are discussed in this paper. First of all, all measurements did comply with the EN50160 standard and the Dutch ‘Grid Code’ requirements, and the PQ level at the chosen locations was satisfactory. It is satisfactory although the locations were chosen to measure suspected PQ problems at ‘problem’ areas. The main reason for not finding any problems is the grid situation at the specific measurement locations. At the locations with many DER units, the grid was designed accordingly and in general Dutch grids can be regarded as strong.
But, there are clearly correlations found between connected sources/loads and the PQ level. In the case of a large amount of PV panels, the THDu (%) was higher during PV production. Also Plt levels clearly increased during semi-cloudy days. The maximum voltage level was never reached, but there are cases known in which problems occurred.
Also at the measurement location with wind turbines, some PQ parameters were influenced, such as a slightly higher Plt level and rise in harmonic distortion. But, it must be said again, the PQ of the grid at the measurement locations was good.
To be ‘sure’ to find PQ problems, two measurements were carried out at known ‘problem’ areas. The measurement indeed showed high levels of Plt and THDu (%) respectively, which could lead to problems at customer’s sites.
The measurements in household areas, connecting increasingly non-linear loads, showed that households cause little distortion on the grid voltage and the Plt levels are also well below the limits. But with the increase of connected power electronics, harmonic voltages will rise when not correctly filtered. Therefore it’s important to monitor such parameters and investigate in mitigation devices and/or to reduce the production of harmonic currents. In the measurement campaign also events were registered. They play an important role for certain sensitive customers. At a location with a weak grid many events were recorded. At such location a sensitive customer, like a semiconductor plant, can’t be connected without changing grid topology or suitable mitigation devices.
From the four-year measurement campaign can be concluded that the PQ level at the measurement locations is meeting the limits of the Dutch ‘Grid Code’. Because the Dutch grid is usually ‘strong’, no PQ problems were recorded at the chosen locations with many PV panels or wind turbines. But, at other locations problems could occur when no attention is paid to the quality of the connected customers and the grid impedance at that point.
Acknowledgement
The work presented in this paper is part of the research project ‘Voltage quality in future infrastructures’- (‘Kwaliteit van de spanning in Toekomstige Infrastructuren (KTI)’ in Dutch), sponsored by the Ministry of Economic Affairs of the Netherlands.
References
[1] EOS Research program at the TU/Eindhoven: “Voltage Quality of the Future Infrastructure” (KTI). website:\ (www.futurepowersystems.nl)
[2] European standard EN-50160, 1994, “Voltage characteristics of electricity supplied by public distribution systems”, CENELEC, Belgium.
[3] DTE Grid Code legislation, DTE (Dutch office for Energy Regulation), 2005, http://www.nma-dte.nl:DTE (available in Dutch language only)
[4] Council of European Energy Regulators (CEER), “4th Benchmarking report on quality of electricity supply 2008”, ref: C08-EQS-24-04, Brussels, December 2008.
[5] P. Issouribehere, A. Galinski, D. Bibé, and G. Barbera, “Ten years of harmonic and flicker control by IEC normalized measurements in Buenos Aires distribution system”. Proceedings of 19th International Conference and Exhibition on Electricity Distribution (CIRED 2007), Vienna, May 2007.
