Published by 1. Stojan MALCHESKI1, 2. Sime KUZAREVSKI1, 3. Jovica VULETIC2, 4. Jordanco ANGELOV2, 5. Mirko TODOROVSKI2, Macedonian Transmission System Operator (MEPSO) (1), University of Ss. Cyril and Methodius, Faculty of Electrical Engineering and Information Technologies, Power Systems Department (2) ORCID: 1. /; 2. /; 3. 0000-0002-1009-7315; 4. 0000-0002-8749-6306;
Abstract. With the European aim to reduce the carbon footprint of the European energy sector by 2030 North Macedonia strategic framework set an ambitious goal to decommission its coal-fired power plants and replace them with renewable energy sources. The future flexibility and inertia states of the power system are assessed using a Monte Carlo market model calculation and multiple scenarios. On a mid-term planning horizon, this paper employs various metrics to derive a comprehensive estimation of the system’s inertia and flexibility requirements for the Macedonian power system.
Streszczenie. Realizując europejski cel zmniejszenia śladu węglowego europejskiego sektora energetycznego do 2030 r., w ramach strategicznych Macedonii Północnej wyznaczono ambitny cel likwidacji elektrowni węglowych I zastąpienia ich odnawialnymi źródłami energii. Przyszłe stany elastyczności i bezwładności 138 ystemu elektroenergetycznego są oceniane za pomocą obliczeń modelu rynkowego Monte Carlo i wielu scenariuszy. W horyzoncie planowania średniookresowego niniejszy138ystem138tt wykorzystuje różne wskaźniki w celu uzyskania kompleksowego oszacowania wymagań dotyczących bezwładności i elastyczności 138 ystemu dla macedońskiego 138 ystemu elektroenergetycznego. (Ocena elastyczności systemu elektroenergetycznego pod kątem przyszłych potrzeb w zakresie elastyczności: wysokopoziomowa metoda przesiewowa macedońskiego systemu elektroenergetycznego)
Keywords: power system flexibility, power system inertia, Monte Carlo method, long-term planning.
Słowa kluczowe: elastyczność 138 ystemu elektroenergetycznego, bezwładność 138 ystemu elektroenergetycznego, metoda Monte Carlo, planowanie długoterminowe.
Introduction
In the coming years, the Macedonian power sector will be reshaped by the introduction of variable renewable energy sources (VRES), and the decommissioning of the lignite and oil power plants envisioned in the national strategy framework [1-3]. The current investment interest in VRES will result in an increased need for flexibility and the planed decommissioning’s will further reduce the system inertia. In the future, the flexibility and inertia needs will become dependent on the intermittency and weather dependency of VRES. This paper employs an analysis method based on a Monte Carlo market simulation that considers the randomness of system outages and the weather dependencies of VRES, hydro power plants and system loads.
There are multiple approaches to assess the flexibility and inertia of a power system varying in their complexity and computation resource requirements. So far, in academia and the power sector, there is no consensus on the best approach to tackle this problem since power system flexibility and inertia are system-specific [4]. This paper assesses the inertia and flexibility of the Macedonian power system based on the net load, which represents the difference between system load and non-dispatchable power generation [5-6]. Specifically, the research focuses on the following flexibility metrics: the renewable penetration index (RPI) and renewable energy penetration index (REPI) [7], the system probability for VRES curtailment (LORE) [8], and the system inertia metric SNSP [9].
The analysis and parameter calculations were performed using a regional perfect spot market model of Southeast Europe (SEE), where each country is modelled with one or multiple areas on the copper plate principle. This principle aggregates the total production and load on a power system level to the area(s) representing a given country and interconnects them with other neighbouring countries on NTC-based interfaces [10].
The paper is organized as follows: Section 2 gives overview of the market model and analysis scenarios, Section 3 explains the methodology, Section 4 presents the analysis results, and Section 5 summarizes the findings.
Market Analysis and Scenarios
The market model is for a mid-term time horizon (2030), based on the Energy Market Initiative Data Base (EMIDB) developed by USEA, [11], as well as the Pan-European Market Model Data Base (PEMMDB) and Pan-European Climate Database (PECD) developed by ENTSOE, [10]. The EMIDB contains data on a unit-by-unit basis for the thermal and hydropower plants, data for the installed capacity of VRES, data for demand, and data for the net transmission capacities on an interface level between the countries of SEE. The PECD dataset contains weather data for Europe from 1982 to 2016. Each country in the market model is represented by a single area where all generation technologies as well as the load time series are modelled on a system basis. Figure 1 shows the modelling scope of the market model.
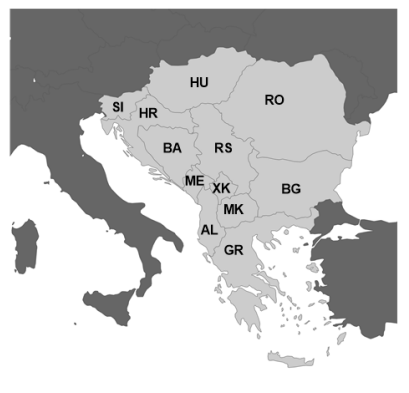
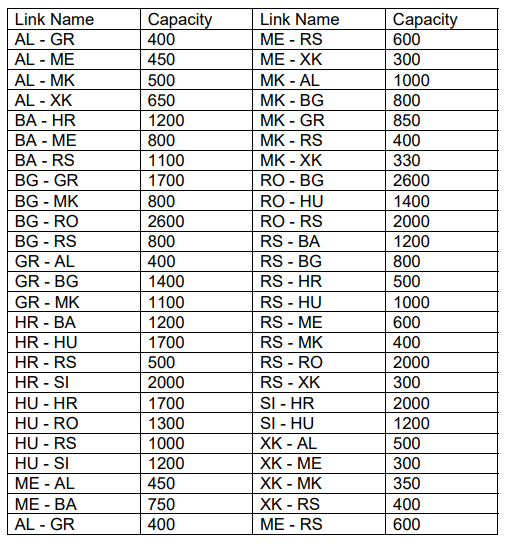
Table 1 shows the installed capacity for each country in SEE while Table 2 shows the capacities for both directions on the NTC-interfaces between the countries.
Table 1. Installed capacities in MW for the six national scenarios

Table 2. NTC-interfaces capacity in MW
The Macedonian power system was modelled with multiple scenarios which differ in the installed capacity of thermal power plants (TPP), hydro power plants (HPP) and VRES. In total, six scenarios were analysed as a combination of conventional power plants (business-asusual (BC), investment in gas (wTPP), and pump-storage HPP (PSP) scenarios (wPSP)) and two VRES development profiles with high and low installed VRES capacity (H-RES and L-RES). Table 3 presents the installed capacity for all six development scenarios for North Macedonia (MK).
Table 3. Installed capacities in MW for the six national scenarios
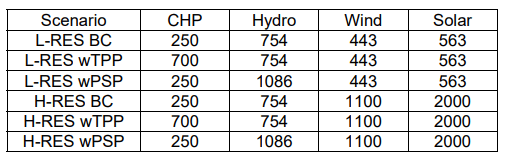
Table 4. Flexibility parameters of the hydro and thermal power plants in MK
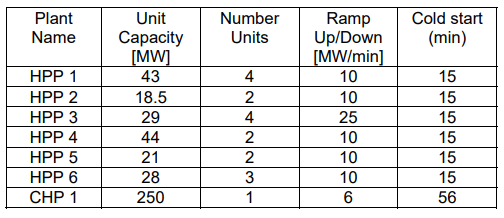
In this paper, for the flexibility analysis of the Macedonian power system, it is considered that only the HPP and gas-fired combined heat and power thermal power plants (CHP) can provide system flexibility. Table 4 presents the flexibility parameters for the Macedonian power system.
For each TPP in the model the marginal price (MP) was calculated using (1) as:

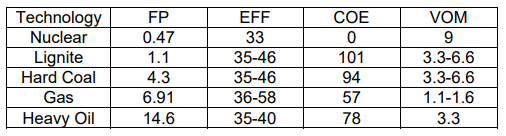
where VOM are the variable operation and maintenance cost in €/MWh, COE are the TPP CO2 emission rate in kg/Net GJ, FP is the fuel price in €/GJ, EFF is the TPP efficiency in percent, and the coefficient 3.6 is the conversion factor between GJ and MWh. COP is the CO2 price and in this model its value is 66 €/t. The economic parameters used in the market model for the TPPs are given in Table 5, [11].
Table 5. Economic parameters
For all other power plants, the production price is equal to the MP calculated by the simulation tool ANTARES. The Monte Carlo based optimization algorithm is explained in detail in [12]. The Monte Carlo optimization was carried out by simulating 700 Monte Carlo Years as a combination of 35 climatic years (CY) from PECD and 20 random outage patterns of the generators from EMIDB. CY represents a unique combination of the production of wind, solar, hydro and system load on hourly basis based on a historical weather pattern presented in PECD.
The forced outage rate in percent and the forced and planned outage duration in days for different TPPs are given in Table 6.
Table 6. Forced and planned outage rates per TPP fuel type

Flexibility and inertia metrics The assessment of power system flexibility and inertia is quantified by calculating the value of four metrics: RPI, REPI, LORE, and SNSP.
RPI is calculated in two steps as:
Step 1: Calculate RPI using (2) on hourly basis ∀CY as:

where W is the wind production, P is the photovoltaic production, and L is the system load.
Step 2: RPI is equal to the maximum hourly value from all calculated values in Step 1.
REPI is calculated in two steps as:
Step 1: Calculate REPI using (3) on annual basis ∀CY as

Step 2: Calculate REPI using (4) as:

The LORE metric is calculated based on six-step procedure:
Step 1. Calculate the Net Load (NL) ∀CY as:
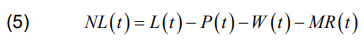
where MR represents all the must-run generation1 in the market simulation.
Step 2. Calculate Net Load Ramp (NLR) ∀CY as:

and split the values calculated with (6) in two subsets, positive or upward net load ramps, NLR+(t), and negative or downward net load ramps, NLR–(t).
Step 3. Calculate the probability for VRES curtailment due to NL value being below zero as:

Step 4. Calculate the probability for VRES curtailment due to NLR+(t) being greater than the ramp-up capability of the Macedonian power system as:

where RU(t) is the remaining ramp-up capability of the power plants in Table 4 based on the dispatch results of the Monte Carlo simulation.
Step 5. Calculate the probability for VRES curtailment due to the absolute value of NLR–(t) being greater than the absolute value of the ramp-down capability of the Macedonian power system as:
where RD(t) is the remaining ramp-down capability of the power plants in Table 4 based on the dispatch results of the Monte Carlo simulation.
Step 6. Calculate LORE based on (8) as:

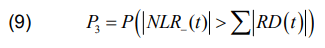
Finally, SNSP is calculated using (9) as:

where E is the exported power from the analysed system on hourly basis. SNSP is calculated for each hour, ∀CS.
Simulation Results and Discussion
From the analysis four metrics were calculated for the Macedonian power system: RPI, REPI, LORE, and SNSP, as described in Section 3.
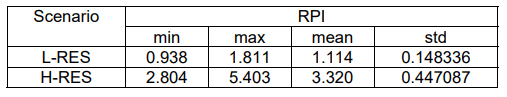
Table 2 and Table 3 show the minimum, maximum, average value, and standard deviation for RPI and REPI, for the L-RES and H-RES scenarios respectively.
Table 7. RPI for the Macedonian power system
1 Must-run generation is all generation that must be dispatched each hour based on the hourly time-series with which the generation technology is modeled.
From Table 2 and Table 3 we can conclude that for both RES development scenarios the distributions are similar and cantered around the mean. The values of Table 3 for the H-RES scenario are in line with the European strategic framework where the mean value of the total production is around 49 % of the total load. Since high RPI values were noted for both L-RES and H-RES, in the future, to avoid VRES production curtailment, the Macedonian strategic framework should be reworked to consider different energy storage technologies or a shift from a fossil fuel-powered industry to an electricity-powered industry to increase the overall load profile [13].
Table 8. REPI for the Macedonian power system

Table 4 shows the loss of renewable energy estimation (LORE) for the six analysed scenarios as well as the results for the three different periods of interest. From the three period only Periods 1 and 2 have a the most significant impact. From the results we can conclude that the commissioning of new TPPs and a PSP is crucial to reduce the curtailment probability. Period 1 contributes the most significantly to LORE in the H-RES scenarios due to the relatively low demand profile. In the future, to lower the probability of RES curtailment storage technologies should be included in the energy and power mix.
Table 9. LORE for the Macedonian power system

It is important to note that the results from the market model did not show curtailment of VRES because of the well-developed interconnections in the region of interest, but at the same time, the installed VRES capacities in the neighbouring countries are quite modest, with exception to the installed capacities in Romania, Greece, and the rapid development VRES scenarios for MK.
Figure 5 shows the SNSP density for the analysed scenarios of the Macedonian power system. In comparison to the L-RES scenario has insignificant effect on system inertia compared to H-RES. In the H-RES scenarios we can note that system inertia get quite low for MK. Since all countries will follow a similar development trend it is expected that all countries in SEE will experience similar or worse trends. Consequently, each country in SEE as well as MK should focus on alternative ways for system inertia provision such as synthetic inertia provision from VRES power plants or subsidization of conventional power plants so they will provide system inertia during hours of high VRES production.
Conclusions
The flexibility analysis for the Macedonian power system was done using a probabilistic market-based calculation on an SEE market model. For MK, six national scenarios were analysed as a combination of three development scenarios for the conventional power plants and two VRES development scenarios. The flexibility was assessed by computing the RPI, REPI, LORE, and SNSP metrics.

The introduction of VRES to the system leads to a high ratio between RPI and REPI as presented in Table 7 and Table 8, which is mainly driven by the low load levels during the periods where the VRES production is highest. Moreover, as shown in Table 9, the LORE parameter increases as more VRES are introduced to the system, which means that the risk for VRES curtailment in the future will be high. Since the flexibility needs are dependent on the regional evolution of the generation profiles in the neighbouring countries, it is expected that as more VRES are introduced, the curtailment risk in MK and the region will be even higher. To alleviate the possibility for VRES curtailment in MK and in SEE each country should focus on further electrification of the energy sector so to increase the base load. Furthermore, each TSO should focus on national and regional flexibility studies so to assess the need for flexibility means such as storage technologies.
The combination of decommissioning of conventional power plants with a rapid introduction of VRES in the generation mix will have detrimental effects on the system inertia as presented on Figure 2. Since the countries in SEE will follow similar trend to the one presented for MK it is expected that system inertia will drop on regional level. To increase system inertia the focus should be on development of national and regional markets so to facilitate synthetic inertia provision from the VRES power plants. Moreover, the feasibility of renumeration mechanisms for inertia provision from conventional power plants should be further explored for periods of high VRES production.
The metrics in this paper are relatively easy to compute, and their computation isn’t computationally intensive compared to other more detailed methods. On the other hand, the market simulations take 24 hour each due to the complexity of the model. The obtained results represent a first-of-a-kind screening of the future flexibility needs in the Macedonian power sector, and they pave the way for future developments in this field on a national level.
Acknowledgement – We express our sincere gratitude to United States Energy Association (USEA) for their unwavering support in the development of this work.
REFERENCES
[1] PwC, MANU, The Strategy for Energy Development of the Republic of North Macedonia until 2040, October 2019.
[2] GIZ, National Energy and Climate Plan of the Republic of North Macedonia, July 2020.
[3] TAF-WB, Programme for the realisation of the Energy Development Strategy 2021 – 2025, March 2021.
[4] Cochran, J & Miller, Mackay & Zinaman, Owen & Milligan, Michael & Arent, Doug & Palmintier, Bryan & O’Malley, Mark & Mueller, S & Lannoye, Eamonn & Tuohy, Aidan & Kujala, B & Sommer, M & Holttinen, Hannele & Kiviluoma, Juha & Soonee, Sushil. (2014). Flexibility in 21st Century Power Systems.
[5] IRENA (2018), Power System Flexibility for the Energy Transition, Part 2: IRENA FlexTool methodology, International Renewable Energy Agency, Abu Dhabi.
[6] IEA (2011), Harnessing Variable Renewables: A Guide to the Balancing Challenge, OECD Publishing, Paris, https://doi.org/10.1787/9789264111394-en.
[7] Dierk Bauknecht, Christoph Heinemann, Moritz Vogel, Study on the impact assessment for a new Directive mainstreaming deployment of renewable energy and ensuring that the EU meets its 2030 renewable energy target, Task 3.1: Historical assessment of progress made since 2005 in integration of renewable electricity in Europe and first-tier indicators for flexibility, July 2019, https://energy.ec.europa.eu/designflexibility-portfolios-member-state-level-facilitate-cost-efficientintegration-high-shares_en
[8] J. Ma, V. Silva, R. Belhomme, D. S. Kirschen and L. F. Ochoa, “Exploring the use of flexibility indices in low carbon power systems,” 2012 3rd IEEE PES Innovative Smart Grid Technologies Europe (ISGT Europe), 2012, pp. 1-5, doi:10.1109/ISGTEurope.2012.6465757.
[9] Poncela Blanco, M., Purvins, A. and Chondrogiannis, S., PanEuropean analysis on power system flexibility, ENERGIES, ISSN 1996-1073, 11 (7), 2018, JRC110658.
[10] ENTSOE, European Resource Adequacy Assessment 2021 Edition – Executive Report, Brussels, 2021, link: https://www.entsoe.eu/outlooks/eraa/eraa-downloads/
[11] USEA, Assessment of the Impact of High Levels of Decarbonization and Clean Energy by 2030 on the Electricity Market and Network Operations in Southeast Europe, 2022
[12] RTEi, Antares Simulator 7.1.0 – OPTIMIZATION PROBLEMS FORMULATION, https://antares-simulator.org
[13] B. Ćosić, G. Krajačić, and N. Duić, “A 100% renewable energy system in the year 2050: The case of Macedonia,” Energy, vol.48, no. 1, pp. 80–87, Dec. 2012, doi:10.1016/j.energy.2012.06.078
Authors: Stojan M. and Sime K. are with the Macedonian Transmission System Operator, department of power system planning, ul. Maksim Gorki no.4, e-mails: stojan.malcheski- @mepso.com.mk and sime.kuzarevski@mepso.com.mk; Jovica V., Jordanco A. and Mirko T. are with the University of st. Cyril and Methodius, Faculty of Electrical Engineering and Information Technology, Rugjer Boshkovikj, e-mails: jovicav@pees-feit.edu.mk, jordanco@pees-feit.edu.mk, and mirko@pees-feit.edu.mk.
Source & Publisher Item Identifier: PRZEGLĄD ELEKTROTECHNICZNY, ISSN 0033-2097, R. 99 NR 6/2023. doi:10.15199/48.2023.06.28
