Published by Tomasz SIEŃKO1, Jerzy SZCZEPANIK2, Cracow University of Technology, Krakow Poland (1), Cracow University of Technology, Krakow Poland (2) ORCID: 1. 0000-0002-3645-5694; 2. 0000-0001-5633-8359
Abstract. Increased Penetration of the Polish Power Supply System by renewable sources (RES) leads to a number of serious and new problems. The problems are associated with evacuating energy from producers (particularly visible for PV installations), change in the direction of power flow in the lines of the transmission and distribution system, problems with balancing energy production in the system related to uncertainty production of RES and a limitations in the possibility of control range of classic power plants. The current EU legislation leading to the increase of RES penetration will cause a significant rise appearance of in these problems. In principle these problems are unsolvable without the use of effective and achievable on a large scale methods and technologies of energy storage. The article estimates the generation level, generation variability and possible shortages in wind energy production in Poland in the case of the expansion of wind farms into offshore farms on the Baltic Sea. Data used in paper are based on some years of work inland RES in Poland available from PSE site. The idea is to adjust an operation of the power system to the basic formula of energy production and consumption balance with the required stability margins. A simple algorithm for estimating the size of the energy reserve necessary to stabilize the operation of the power system has been proposed. An important problem is also the assessment of the “geographical premium” (location). Theoretically, with the growth of the analyzed RES production area, the stability of DER production should increase since it become independent from purely local weather conditions.
Streszczenie. Wzrost Penetracji Polskiego Systemu Elektroenergetycznego przez źródła odnawialne (OZE) prowadzi do szeregu problemów: kłopotów wyprowadzeniem energii od producentów (szczególnie widoczne dla instalacji PV), zmiana kierunku przepływu mocy w liniach systemu przesyłowego i rozdzielczego, kłopoty z bilansowaniem systemu związane z niepewnością produkcji OZE oraz ograniczeniem w możliwości regulacji klasycznych elektrowni. Obecne prawodawstwo UE spowoduje znaczny wzrost tych problemów, w zasadzie nierozwiązywalnych bez efektywnego i olbrzymiego składowania energii w SEE. W artykule oszacowano poziom generacji, zmienność generacji oraz możliwe niedobory w produkcji energii wiatrowej (produkcja DER) w Polsce w przypadku rozbudowy farm wiatrowych na farmy morskie nad Bałtykiem. Ideą jest dostosowanie pracy systemu elektroenergetycznego do podstawowego bilansu produkcji i zużycia energii z wymaganymi marginesami stabilności. Zaproponowano prosty algorytm szacowania wielkości rezerwy energii niezbędnej do ustabilizowania pracy systemu elektroenergetycznego. Istotnym problemem jest również ocena „premii geograficznej” (lokalizacji). Teoretycznie wraz ze wzrostem analizowanego obszaru powinna wzrastać stabilność produkcji DER (niezależność od czysto lokalnych zjawisk pogodowych). (Rosnąca penetracja OZE do Systemu Elektroenergetycznego w Polsce)
Keywords: distributed energy resources, power system, wind power generation, power system stability, power system reserves.
Słowa kluczowe: rozproszone źródła energii, system elektroenergetyczny, generacja energii z wiatru, stabilność systemu elektroenergetycznego, zapasy energii w systemie elektroeneretycznym.
Introduction
Until today, in power system, the energy needs by system loads has to be met by energy production to obtain constant frequency and voltages at system nodes. Of course some changes of those quantities are possible, but they are limited by system energy quality and stability constraints standards. Figure 1 shows the structure of production, usage and planned storage of energy in power system in Poland.
In general, two power systems operations modes are possible: one when system energy production and usage is balanced and energy is delivered to all customers constantly and uninterrupted according to the energy quality standard and second operation mode where breaks and disturbances in power delivery will be acceptable for less demanding applications and customers. This means, that in second case, customers has to be divided into ones where delivery breaks are possible and to ones where brakeless energy delivery is required. First group include mainly housing estate and second one is mainly industry and loads where continuous supply is required and customers such as hospitals, road traffic, rail power supplies etc. Such segregation of customers will be done on relatively low voltage and it has to work similar to SCO (self-acting frequency-dependent system unload who can disconnect the certain groups of customers from a supply). Legal regulations together with technical instructions still exist in Poland and they are related to the situation energy shortages at the turn of the 1970s and 1980s. Usually local operators can disconnect certain medium voltage feeders outgoing from high to medium voltage stations (in Poland is called GPZ – main supply 110/15 kV stations) to balance energy flow.
This modes of work of supply network should be discussed by the inhabitants of a given area.
The second mode of power system work is quite possible even now, when the supply from DER’s sources is on relatively high level and due the weather conditions it will rapidly decrease, and level supplied from basic power stations and existing reserve will be too small or to slow to balance system. Unfortunately, in the most of the analyses of wind energy costs as for example in the works [1], [2] the cost assessment ignores the cost of reserves and does not consider the real variability of energy production in the area [3]. The cost ocean, which in the case of grid connection analysis is an acceptable simplification but in in the case of the EEE stability analysis, no. It should be mentioned that in this case when support from neighbouring countries is possible (look at the failure of the energy supply to system from the Bełchatów power plant – 3500MW (compare to about 18000MW produced by whole coal using power plants). The breakdown lasted fiew hours and do not influenced system work due to support from power systems of neighbouring countries. Especially small support was given by German power system where large amount of energy is produced by DER.
As we can see two concepts of system work are possible and at the end, for both cases, the balance of the supply system is achieved in different ways- by increasing the energy production, or by decrease its load for a certain time. The increase of energy delivery is usually done by employing system reserves or by increasing energy import from adjacent countries (if it is possible).

The second mode of power system work include not only increase of the production but also the decrease of energy usage for a certain time needed to balance system. The observation of power flow on the PSE (Polish System Operator) internet site clearly shows large influence of intersystem flows from neighbouring countries in Polish system balance even during relatively calm times (small changes in energy usage and production from conventional power stations). Questions is if they will be enough to create reserve for new installations of DER sources since new massive investments at Baltic Sea.
Offshore windmills have different characteristics than onshore ones – utilization rate up to 40% and more stable production. Thus in principle, they require a separate analysis and later a possible analysis of cooperation for onshore and off shore cooperation. Analysing available data, one has to think about windmills located onshore right next to the sea – maybe some of their share resulted in the formed used factor of 0.26 instead of 0.22-0.24 for windmills located deep onshore what appears in several publications.
DER resources production data variability and Analysis of wind and solar energy production for existing data
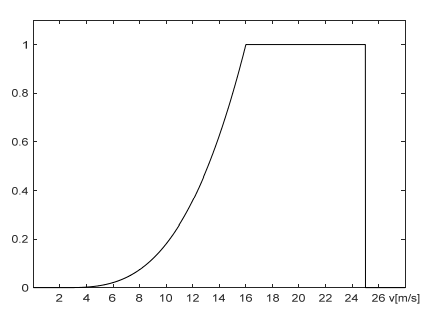
DER sources energy production depends not only on weather conditions, but also on resources characteristics. They are non- linear functions of wind speed for windmills (figure.2) and also for solar modules the dependence of energy production on solar radiation is highly non-linear. Moreover solar panels do not work during the night and windmills do not produce energy when wind speed is lower than their starting point.
DER sources in Poland are mainly windmills and photovoltaic panels. The available data to estimate production of those sources and their dynamics are based on:
Data from meteorological stations regarding wind and solar operation. The data from those sources are generally from inhabited areas inside landmass and are affected by local conditions (wind and solar station location). This happens especially in Poland where majority of DER stations right now are located inland (urban conditions)and they are separated from the location of meteorological stations [4] To estimate DER production additionally one has to include sources distribution and characteristics (regardless of the meteorological data). The advantage of these sources are long series of measurement data, but unfortunately moderately useful in the light of the impact of climate change [5].
New wave measurements based on satellite systems data – available for every part of the globe as the continuous measurements –for a certain areas which are available due to satellite placement. The measurements data are more area dependent and usually available for a certain area and also these data can contain historical information for a certain areas which are available. The problems which are associated to DER usage are: Energy production estimation is similar to shown in previous section – this information is used in DER expansion planning, production forecasting and modelling. The measurements are available in [6].
Information from energy markets regarding present DER energy production and maximisation of this production according to European energy low. The information delivered by the energy markets contained hidden data about DER distribution at a certain area – in existing onshore locations, beneficial locations were already identified and for average characteristics of DER optimal energy production was calculated. This limits the expected changes for those windmills locations. The EU legal situation is as follows: each production of DER sources must be purchased by the electricity system operator in accordance with the provisions of EU law [7] [8]. This means that the market data about DER generation in local power subsystems should be very close to maximum temporary energy production which depend on actual weather conditions. When analysing the impact of the law on DER sources energy production it is worth to compare the data available from European operators [9], [10], and Californian operators [11].
Analysis of electrical energy production by wind energy at the area of Poland (PSE DATA)
The analysis of the energy production by windmills was done on basic on available old PSE data from period of time between 01.01.2013 to 12.31.2021. The choice of data was dictated by relatively large power of windmills installed during this time it ranged from 3 to 7 GW (During this time the windmills were installed only inland) The available data about windmills production are shown in Figure 3. The available interval of data is one hour for the time period under consideration.
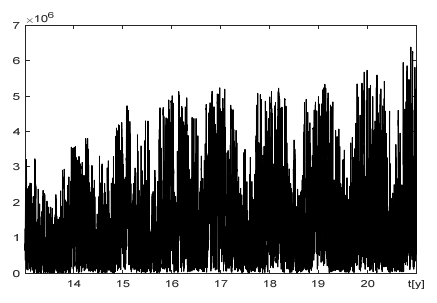

The figure shows the increase of windmill power associated to the increase of yearly installed production facilities. Thus, further analysis required data normalization with respect to the power of installed windmills [12],[13]. Powers of installed windmills are available at monthly intervals in figure 4. To normalize data windmill power production during the month was divided by the number of windmills installed and able to give power during this month. The information about the normalized production (coefficient of windmill power utilization), its variability and degree of its usage are compared to maximum the power of installed windmills what is shown in Figure 5.A.
It should be noted that the maximum possible production of wind energy could be higher than in this diagram since energy absorption by power system is limited by the stability requirements or local power transmission possibilities (overload of system elements). The legal situation forces the consumption of all possible renewable energy, so probably the minimum values and the slope of the falling slopes are more error-prone than the values of the maximum values and the slope of the rising slopes (the value sought and estimated is rather the maximum possible use of wind energy at a given moment).
Based on the energy production availability data, the following data were also estimated: median (median value from normalized values of function of windmills usage) – 0.2057; mean value -0.2652; effective value (RMS) -0.3388; maximum value –0.9609; and minimum-0.0014; and the production was averaged in annual intervals – the results are presented in the Figure 6

Mathematic elements of the analysis
The averaging of energy production by windmills was performed in yearly periods according to the following algorithm:

The analogic times intervals were used when the median values were calculated – they and shown in figure 6.
Visible not too large fluctuations in the average usage in each calculation period can be justified by opening a new wind farm with a slightly higher or lower (than the average for the system) average utilization of windmills related to better location or better use of turbines which adaptation to local conditions are improved or the influence of cyclical or cyclical quasi climatic oscillations with a period of phenomenon different from one year (like for example ELNINO).

It should be recalled that due to the non-linear characteristics of the windmill shown in Fig.2 small changes in wind speed can translate into significant changes in energy generation. This fact influences median that way that it is smaller than average value (widely dispersed values of energy production) [fig. 6].
Analyzing Figures 5 and 6, it should be noted that wind generation in Poland is characterized by a low coefficient of windmill power utilization thus the median value (i.e. the value for which 50% of samples are of lower value) falls to the levels of 0.16 to 0.24 and are interrupted by (relatively short) episodes of large energy production. The generation value during these episodes raises the average value from 0.22 to 0.3.
The second important parameter allowing to determine the level of ‘stress’ (need for use reserves or local blackout for power system balance) of electrical power system related to the operation of DER is the speed of energy production changes.
The analysis was performed according to the formula:

The results are presented in the figure 7 and were calculated in order to capture possible correlations between the volume of production and the size and speed of changes. No regularity was found. In order to confirm the analysis, a comparison of the relative variability of production to production value was compared (fig 8). Again, no other regularities were found.
Analysis of production charts and production variation charts indicates that wind energy production can possess very high dynamics and be highly dependent on weather conditions. As the penetration of these types of sources in the system structure increases, the amount of “stress” generated by them in power system will increase. It is especially related to the need to fast replacement. For example, if 10% -20% of the power generated by DER has to be replaced by other sources, not only it requires fast increase of the energy production in fully controllable power stations or reserve but also can introduce limitations of demand (by use local blackout or spinning blackout). The probability of the DER power change can be estimated on the basis of the figure 7b.

The scope of the analyzes of the impact of variability of wind energy generation on the operation of EPS covers the current situation (as in the paper [14]). However it is assumed that the lack of energy from these sources does not lead to serious disturbances in the operation of EPS what does not have to be true during high content of renewable resources in EPS energy production balance. It is worth to note that a high level of ‘stress’ will be associated with a situation, where a large energy production change occurs with high DER generation. In this situation the level of power system reserves may turn out to be insufficient. Due to the increase in DER generation, conventional generation consequently decreases and its possible reserves become limited. Thus, as installed power of DER grow, the probability of using SCO increases. An increase of DER power may also entail an increase in nonused energy – an increase in production or the speed of growth will not allow it to be used or stored for future use. At this point, the shape of the distribution function (symmetric with respect to 0) proves that the power system has no problems with absorbing this energy (assuming that the magnitude of the coal based generation change). Assuming that probability of wind change is similar in both directions (figure 7b)- we do not observe a cut in the upper part distribution associated with possible limitations of the power absorption by system, but so far as seen in the figure 7b the expected biggest change in generation has not exceeded 1.4 GW (20% installed windmill power) in absolute numbers.
The probability of using SCO (frequency load limiter) is also a function of the amount of windmills power installed, electricity production technologies used, existing power system reserves and the time horizon in which we are able to predict a certain event and time length of this event what depends on the weather prediction.

There are many studies analyzing the production from DER in various timescales and geographical wind statistics [15 – 20]. They are usually assessing the production variability [21] and the possibility of its prediction [22-28], however there are no studies on the impact of DER generation instability on work EPS as a whole with a significant share of these sources (in the EU up to 40% of energy is generated from DER). Therefore, an attempt was made to assess the possible “stress” generated by windmills in the Polish SEE without cross-border cooperation.
Table 1. Energy shortage caused by changes in windmills production

In order to capture the parameters of the “stress” and possibility of power system response to it (voltage unbalance, frequency changes, power shortage, change in power distribution, required reserves energy and total power in system) and related to cooperation with windmills, several analyzes were performed for arbitrarily selected levels of windmills utilization – 5%, 10%, 15%, 20% and 50%. Even for level of utilization lower than 5% the cases of shortage of production longer than 24 hours are quite common. Thus, the disregard of daily variability and choosing average daily demand do not introduce large errors during analysis.
The table (1) below indicates the values of changes of energy as production of windmills deceases for a certain level of windmills productions, certain time lengths of events, median time of the event, relative mean energy of the scarcity, median of the relative energy scarcity and maximum relative energy shortage.
Discussion of analysis of the results
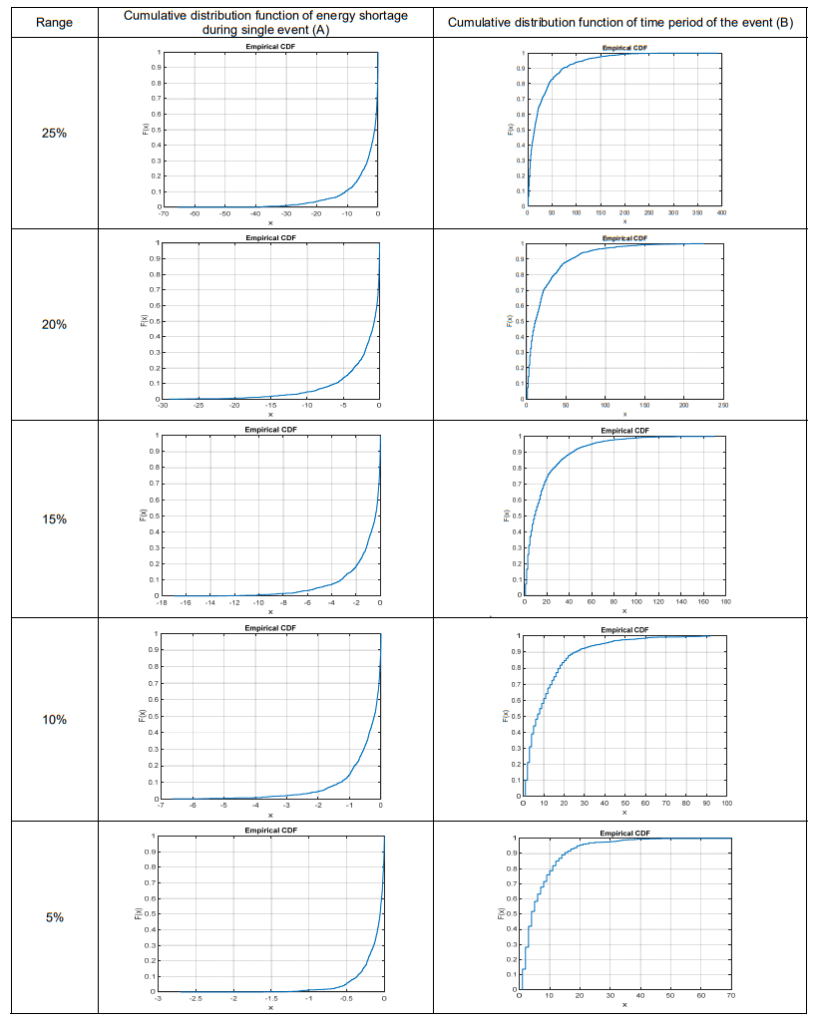
The above-mentioned distribution factors (Table 2) together with the knowledge of the dependence of the power system on wind energy allow to easily estimate what event we are prepared to (and probability with which this event can occur) . Analyses shown in Table 2 show also what is the level of energy reserves that should be concerned in order to prepare for a certain event with probability X. Such analyzes will undoubtedly be needed in the future for connection with the EU-promoted policy of increasing DER share (at this point the addiction is 0, ie in SEE SCO automation is not used, even when the generation from wind is 0).
We propose, in principle, 2 coefficients which describe the dependence of power system on wind generation. Both are connected to the coefficients of windmills utilization. First one tells – what percentage of windmill power has to be produced so SCO is not used in power system (without the use of stored energy) and the second one describe situation where power system works only to supply the most important loads (hospitals, traffic lights, telecommunication and industry which requires continuous supply)
It is also worth recalling the catastrophic events in Texas at the beginning of 2021 [29-32] related to the underestimation of the duration of extreme weather events and the emergence of a new factor that could lead to a blackout.
It should also be noted that regardless of our ability to predict the weather (energy production from windmills), reserves for the time when the energy generation by windmills has to be limited, must always be available , in one form or another. As DER penetration in the system increases, the scope of system balancing by thermal power plants will decrease. Thus, the investments in high dynamic power plants or energy storage are needed.
The shape formed in figure 8 is extremely important for future analyzes, especially in the area of the lower right corner – the highest energy production by windmills (i.e. the smallest cushion in thermal power plants and the greatest variability in others) in the case of unexpected weather event either it needs to be covered by high dynamic energy sources or SCO should be utilized.
Conclusion
The analysis done using figures 5 and 6 shows that onshore wind energy production in Poland is characterized by low level of basic production (median much lower than medium values) what indicates that we have frequent episodes of very low and high production. The shape in figure 6 shows this instability of the windmills energy generation. Even considering yearly periods we can observe high levels of variability of windmills energy production. This requires further analysis, especially when further windmills will be located also onshore and offshore in the Baltic sea.
Table 2. Cumulative distribution functions of energy shortage and time period of the event. Range – arbitral level of windmill usage below with power system experiences energy shortage, axes at (A) column – X axle: energy shortage [h x installed windmill power], Y axle: probability of events for which the lack of energy was greater than the value determined on the X axis; axes at (B) column – X axle: time period of event in hours, Y axle: probability that the time length of a certain event is shorter than x value.
Thus, the new data sets dependent on DER penetration in the power system will be different what force new approach to their analyses:
• The necessary level of basic energy production or reserve to keep system stability during the windmill production variability (with a certain probability)
• For a given basic production (fully controllable power stations) what production of windmills is necessary to keep a certain state of work of power supply system
• What is the probability of the event for which the operator want to prepare to be able to neutralize its influence on power system stability
• What amount of energy is necessary during the generation shortage by windmills (which happens with a certain probability) and what data are required to calculate reserves of stored energy or fuel necessary to cover energy needs if shortage event happens. All these calculations should be performed for the situation when will be no possibility of the restoration of energy reserves and fuel (second event just after first one)
Nowadays, not only the influence of DER sources production on energy price is visible but as the DER sources penetration in power system will grow, the limitation of energy availability from these types of sources become visible This can cause SCO (disconnection of a certain users) usage during severe energy shortages.
Takin under consideration analysis performed for Poland area we suggest to do similar analysis foe larger and varied terrain covering different areas in EU (UCPTE area). It is very unusual that there is no any attempts to cover all EU terrain (including off-shore locations) by analysis similar to performed in this paper especially in the case when penetration of DER sources is forced by EU officials.
In the available literature, one can also observe a strange indifference of the electrician community towards the problems of power system stability and unpredictability of RES generation. This problem was referred to in the works[33-39] and the amount of reserves needed for efficient balancing of the power system [40-42] in the articles published at that time in Przegląd Elektrotechniczny. The problems raised in the article may have an impact on the functioning of the economy and society – so far we have functioned in conditions of widespread availability of electricity and the only possible problem was its price. As the penetration of DER in the power system increases and with the expected development of energy storage technologies, a reduction in the reliability of supplies should be taken into account.
The motivation for the creation of this work was to check how large energy storage facilities should exist in Poland when switching to renewable energy.
REFERENCES
[1] Joos M., Staffell I., Short-term integration costs of variable renewable energy: Wind curtailment and balancing in Britain and Germany, Renew Sustain Energy Rev, 86 (2018), pp. 45- 65, 10.1016/j.rser.2018.01.009
[2] Warren Katzenstein, Jay Apt,” The cost of wind power variability,Energy” Policy,Volume 51,2012,Pages 233-243, ISSN0301-4215,https://doi.org/10.1016/j.enpol.2012.07.032. (https://www.sciencedirect.com/science/article/pii/S0301421512006246)
[3] Eser, Patrick & Chokani, Ndaona & Abhari, Reza. (2017). “Optimal RES portfolio to achieve 45% renewable electricity in central Europe by 2030”. 1-5. 10.1109/PESGM.2017.8273819.
[4] IMGW https://www.imgw.pl/ (on-line 18.10.2022
[5] S.C. Pryor, R.J. Barthelmie,”Climate change impacts on wind energy: A review,”Renewable and Sustainable Energy Reviews, Volume 14, Issue 1,2010, Pages 430-437, ISSN 1364-0321, https://doi.org/10.1016/j.rser.2009.07.028. (https://www.sciencedirect.com/science/article/pii/S1364032109001713)
[6] https://www.renewables.ninja/ (on-line18.10.2022)
[7]IEA European Union 2020: Energy Policy Review: Tech. Rep. IEA (2020) URL https://www.iea.org/reports/european-union2020
[8] Dyrektywa Parlamentu Europejskiego I Rady (UE) 2018/2001 zdnia 11 grudnia 2018 r. w sprawie promowania stosowania energii ze źródeł odnawialnych
[9] PSE-operator https://www.pse.pl/home (on-line 19.10.2022]
[10] Entso https://www.entsoe.eu/ (on-line 19.10.2022]
[11] California ISO https://www.caiso.com/Pages/default.aspx (online 19.10.2022]
[12] instrat.energy https://energy.instrat.pl/ (18.10.2018)
[13] Agencja Rynku Energii (ARE) Comiesięczne publikacje “Informacja Statystyczna o Energii Elektrycznej” na podstawie badania statystycznego zleconego przez Ministra Aktywów Państwowych (wcześniej Ministra Energii) – 1.44.02. Elektroenergetyka i ciepłownictwo – opracowanego wspólnie z Prezesem Urzędu Regulacji Energetyki.
[14] Murcia Leon J., Koivisto M., Sørensen P., Magnant P. Power fluctuations in high installation density offshore wind fleets Wind Energy Science Discussions, 2020 (2020), pp. 1-23, 10.5194/wes-2020-95
[15] Cannon D.J., Brayshaw D.J., Methven J., Coker P.J., Lenaghan D.; Using reanalysis data to quantify extreme wind power generation statistics: A 33 year case study in great Britain, Renew Energy, 75 (2015), pp. 767-778, 10.1016/j.renene.2014.10.024
[16] Frank C.W., Pospichal B., Wahl S., Keller J.D., Hense A., Crewell S. The added value of high resolution regional reanalyses for wind power applications Renew Energy, 148 (2020), pp. 1094-1109, 10.1016/j.renene.2019.09.138
[17] Monforti F., Gonzalez-Aparicio I., Comparing the impact of uncertainties on technical and meteorological parameters in wind power time series modelling in the European union, Appl Energy, 206 (2017), pp. 439-450, 10.1016/j.apenergy.2017.08.217
[18 ] Nuño E., Maule P., Hahmann A., Cutululis N., Sørensen P., Karagali I., Simulation of transcontinental wind and solar PV generation time series, Renew Energy, 118 (2018), pp. 425-436, 10.1016/j.renene.2017.11.039
[19]Hilal Arslan, Hakki Baltaci, Bulent Oktay Akkoyunlu, Salih Karanfil, Mete Tayanc,’Wind speed variability and wind power potential over Turkey: Case studies for Çanakkale and İstanbul”,Renewable Energy,Volume 145,2020, Pages 1020-1032, ISSN 0960-1481, https://doi.org/10.1016/j.renene.2019.06.128.https://www.sciencedirect.com/science/article/pii/S0960148119309620)
[20] Frank, Christopher & Fiedler, Stephanie & Crewell, Susanne, 2021. “Balancing potential of natural variability and extremes in photovoltaic and wind energy production for European countries,” Renewable Energy, Elsevier, vol. 163(C), pages 674-684.
[21] Koivisto M, Plakas K, Ellmann ERH, Davis N, Sørensen P. “Application of microscale wind and detailed wind power plant data in large-scale wind generation simulations. Electr Power Syst Res190; 106638. http://dx.doi.org/10.1016/j.epsr.2020.106638.
[22] Staffell I., Pfenninger S.”Using bias-corrected reanalysis to simulate current and future wind power output” Energy, 114 (2016), pp. 1224-1239, 10.1016/j.energy.2016.08.068
[23] Gonzalez-Aparicio I., Monforti F., Volker P., Zucker A., Careri F., Huld T., Badger J’.Simulating European wind power generation applying statistical downscaling to reanalysis data’ Appl Energy, 199 (2017), pp. 155-168, 10.1016/j.apenergy.2017.04.066
[24] Olauson J.,ERA5: The new champion of wind power modelling?, Renew Energy, 206 (2018), pp. 322-331, 10.1016/j.renene.2018.03.056
[25] Jourdier B., Evaluation of ERA5, MERRA-2, COSMO-REA6, NEWA and AROME to simulate wind power production over France, Adv Sci Res, 17 (2020), pp. 63-77, 10.5194/asr-17-63-2020
[26] Pickering B., Grams C.M., Pfenninger S. Sub-national variability of wind power generation in complex terrain and its correlation with large-scale meteorology, Environ Res Lett, 15 (4) (2020), Article 044025, 10.1088/1748-9326/ab70bd
[27] Koivisto M., Jónsdóttir G.M., Sørensen P., Plakas K., Cutululis N.,Combination of meteorological reanalysis data and stochastic simulation for modelling wind generation variability, Renew Energy, 159 (2020), pp. 991-999, 10.1016/j.renene.2020.06.033
[28] Susanne Drechsel1, Georg J. Mayr1, Jakob W. Messner1, and Reto Stauffer1,Wind Speeds at Heights Crucial for Wind Energy: Measurements and Verification of Forecasts, Journal of Applied Meteorology and Climatology Print Publication: 01 Sep 2012 DOI: https://doi.org/10.1175/JAMC-D-11-0247.1 Page(s): 1602–1617
[29]A. Menati and L. Xie, “A Preliminary Study on the Role of Energy Storage and Load Rationing in Mitigating the Impact of the 2021 Texas Power Outage,” 2021 North American Power Symposium (NAPS), 2021, pp. 1-5, doi: 10.1109/NAPS52732.2021.9654452.
[30]N. Shang and X. Zhang, “Analysis of Extreme Cold Weather Event in Texas of February 2021 and Suggestions for China,” The 10th Renewable Power Generation Conference (RPG 2021), 2021, pp. 252-257, doi: 10.1049/icp.2021.2213.
[31]G. Zhang, H. Zhong, Z. Tan, T. Cheng, Q. Xia and C. Kang, “Texas electric power crisis of 2021 warns of a new blackout mechanism,” in CSEE Journal of Power and Energy Systems, vol. 8, no. 1, pp. 1-9, Jan. 2022, doi:10.17775/CSEEJPES.2021.07720.
[32]S. Ghosh, A. Bohra and S. Dutta, “The Texas Freeze of February 2021: Event and Winterization Analysis Using Cost and Pricing Data,” 2021 IEEE Electrical Power and Energy Conference (EPEC), 2021, pp. 7-13, doi:10.1109/EPEC52095.2021.9621500
[33]Amar Bensaber, A., Benghanem, M., Guerouad, A., & Amar Bensaber, M. (2019). Power flow control and management of a Hybrid Power System. Przegląd Elektrotechniczny, 95.
[34]Raczkowski, R., & Robak, S. (2021). System magazynowania energii elektrycznej jako środek poprawy elastyczności systemu elektroenergetycznego z dużym udziałem generacji OZE. Przegląd Elektrotechniczny, 97, 1-8.
[35]Halinka, A., Rzepka, P., Szewczyk, M., & Szablicki, M. (2011). Przyłączanie farm wiatrowych-potrzeba nowego podejścia do sposobu funkcjonowania automatyki elektroenergetycznej sieci WN. Przegląd Elektrotechniczny, 87(9a), 218-221
[36]Gała, M. (2017). Praca turbin wiatrowych w systemie elektroenergetycznym oraz ich wpływ na jakość energii elektrycznej. Przegląd Elektrotechniczny, 93
[37]Jiang, Z., & Xie, K. (2012). Identification and effect analysis of the weak parts of large-scale wind energy conversion system using the reliability tracing technique. Przeglad Elektrotechniczny, 88(8), 192-196
[38]Suproniuk, M., Skibko, Z., & Stachno, A. (2019). Diagnostyka wybranych parametrów energii elektrycznej produkowanej w elektrowniach wiatrowych. Przegląd elektrotechniczny, 95(11)
[39] Piekarz, M. The analysis of the wind generation impact on the power system stability PRZEGLĄD ELEKTROTECHNICZNY, ISSN 0033-2097, R. 97 NR 11/2021 doi:10.15199/48.2021.11.27
[40]Kazanowski Robert, Dariusz Sztafrowski, ” System elektroenergetyczny oparty o odnawialne źródła energii – możliwości i bariery rozwoju,” Przegląd Elektrotechniczny, 02/2023 pp. 186
[41]DOWEJKO, J., JAWORSKI, J., Banaszak, S., Zeńczak, M., Małyszko, O. (2022). Wybór miejsca zainstalowania wodorowego bufora energetycznego w systemie elektroenergetycznym. Przegląd Elektrotechniczny. doi:10.15199/48.2022.10.51
[42]Kudria, S., Lezhniuk, P., Riepkin, O., & Rubanenko, O. Hydrogen technologies as a method of compensation for inequality of power generation by renewable energy sources. Przegląd Elektrotechniczny, ISSN, 0033-2097
Authors: dr. inż. Tomasz Sieńko, Politechnika Krakowska, Katedra Inżynierii Elektrycznej, ul. Warszawska 24, 31-155 Kraków, E-mail: tomasz.sienko@pk.edu.pl; dr hab. inż. Jerzy Szczepanik, Politechnika Krakowska, Katedra Inżynierii Elektrycznej, ul. Warszawska 24, 31-155 Kraków, E-mail: jerzy.szczepanik@pk.edu.pl.
Source & Publisher Item Identifier: PRZEGLĄD ELEKTROTECHNICZNY, ISSN 0033-2097, R. 99 NR 9/2023. doi:10.15199/48.2023.09.08
