Published by Andrzej Ł. CHOJNACKI, Kielce University of Technology, Department of Power Engineering ORCID: 0000-0002-9227-7538
Abstract. The article presents the results of analyses concerning the seasonality and causes of damage to equipment and facilities operated in 110kV, MV and LV power distribution networks. These facilities include 110kV overhead lines, 110kV/SN substations, MV overhead and cable lines, MV/LV overhead and indoor substations, and LV overhead and cable lines. Months with increased failure rates of individual devices were identified. The most common causes of failure of electric power facilities have been identified. The analysis was based on failures that occurred over a ten-year period at a major electricity distribution company in the country.
Streszczenie. W artykule przedstawiono wyniki analiz dotyczących sezonowości oraz przyczyn uszkodzeń urządzeń i obiektów eksploatowanych w elektroenergetycznych sieciach dystrybucyjnych 110kV, SN oraz nn. Do obiektów tych zalicza się linie napowietrzne 110kV, stacje 110kV/SN, linie napowietrzne i kablowe SN, stacje elektroenergetyczne SN/nn napowietrzne i wnętrzowe oraz linie nn napowietrzne i kablowe. Wskazano miesiące o zwiększonej awaryjności poszczególnych urządzeń. Zidentyfikowano najczęstsze przyczyny awarii obiektów elektroenergetycznych. Analizy zostały przeprowadzone na podstawie awarii, które wystąpiły w okresie dziesięciu lat na terenie dużej spółki dystrybucyjnej energii elektrycznej w kraju. (Analiza sezonowości oraz przyczyn awarii urządzeń i obiektów w elektroenergetycznych sieciach dystrybucyjnych)
Słowa kluczowe: elektroenergetyczne sieci dystrybucyjne, linie elektroenergetyczne, stacje elektroenergetyczne, awarie, sezonowość, przyczyny uszkodzeń
Keywords: distribution networks, power lines, substations, failures, seasonality, causes of damage
Introduction
Of all energy systems (district heating, gas, oil networks), power grids are the most widespread systems. In addition, for many consumers, electricity is the only systemic energy carrier. This is why the problem of power grid reliability is so important.
An electric power grid is defined as a collection of functionally related and electrically interconnected equipment for the transmission, conversion, and distribution of electricity in a defined area. The term power distribution networks includes distribution networks for the transmission and distribution of electricity using voltages no higher than 110kV [2, 3, 6, 7, 9].
Any disruption to the operation of electric distribution networks can cause interruptions in the supply of power to consumers or deterioration in the quality of the power they receive. This results in business (economic) losses for consumers, but also for energy distributors. In extreme cases, this can lead to a threat to human health or life [1, 4, 8].
The occurrence of power outages is inevitable, as power grids are equipped with equipment of a certain reliability. The larger and more complex the distribution network is, the greater the likelihood that some customers will not be supplied uninterruptedly and adequately in terms of quality. Improvements in power supply reliability can be achieved by increasing capital expenditures or operating costs. Therefore, reliability issues are very closely related to the issue of economic calculation and optimization methods [8]. The article presents the results of research on the seasonality and causes of failure of facilities operated in distribution networks, namely: 110kV overhead lines, 110kV/MV substations, MV overhead and cable lines, MV/LV overhead and indoor substations, as well as LV overhead and cable lines.
The reliability analyses performed are statistical in nature and based on empirical data, so they take into account the actual conditions under which the equipment is operated, any environmental exposures (external) and those resulting from the operation and phenomena occurring in the distribution network (internal). This type of analysis makes it possible to take into account all factors affecting the device, not just aging and fatigue phenomena, as is the case with reliability laboratory testing.
Causes of damage to electric power equipment and facilities
Damage to a facility is the process of its transition from a state of operable fitness to a state of unfitness, or otherwise failure. This is tantamount to not meeting the requirements set for the facility (equipment) during its operation. This transition can take place in different ways, which determines the basic division of damage into catastrophic (sudden) damage, also known as total damage, and parametric (gradual) damage, otherwise known as partial damage [1, 8].
The cause of the emergence of catastrophic damage is usually an internal disturbance in the system or an external disturbance of a spike nature. In the case of electric power facilities, catastrophic damage occurs primarily as a result of the occurrence of switching or atmospheric surges. Parametric damage is caused by the existence of fatigue or aging processes, so it is essentially cumulative in nature. Examples of aging (wear and tear) in electric power systems include deterioration of the properties of insulation systems, increased leakage current, etc. In general, it should be said that there are a very large number of possible causes of damage to power equipment and facilities. Considering all possible causes of damage and analyzing their impact on failure rates is basically impossible. Nevertheless, they can be classified into three main groups. The first includes causes resulting from the poor quality of the facility, i.e. any structural, material, and technological faults and defects. The second group includes factors related to the operation and conditions of use of the facility, i.e.: errors of operation, lack of necessary regulatory and preventive treatments, interfering intra- and external stimuli, etc. The third group is made up of factors related to the aging of the facility, so, among other things, fatigue processes and wear and tear of the facility’s components. Based on the above considerations, it can be concluded that in practical research it is necessary to take into account five basic categories of damage causes [8]:
A(0) – construction errors;
B(0) – technological and material errors;
C(t) – operating errors;
D(t) – aging processes;
E(t) – interfering stimuli.
Structural and technological & material errors are not related to the lifetime of the facility, while the others are a function of the facility, as they arise in the process of operation.
The impact of each cause on the occurrence of damage is shown schematically in Figure 1.

Figure 1a shows the ideal characteristics of a flawlessly executed facility (A(0) = B(0) = 0), operated in accordance with guidelines and regulations (C(t) = 0), which is not subject to aging processes (D(t) = 0) and interfering stimuli (E(t) = 0). Such an idealized facility is completely reliable and not subject to damage. Figure 1b presents a characterization considering only the occurrence of aging processes (A(0) = B(0) = C(t) = E(t) = 0, D(t) ≠ 0). In this case, the moments of damage appearance are close to each other. The scatter is only due to the different intensity of the aging processes that occur, which in turn depend on the conditions of use. It is possible in this situation to determine the service life, i.e. the time during which damage is unlikely to occur. Analyzing Figure 1b, it can be concluded that the service life must be smaller than time t1, the time resulting from the fastest aging processes. Figure 1c presents the actual characteristics that take into account the various causes of damage, taking into account the occurring disturbances in the form of load spikes (overloads). The fastest damage is done to an facility that is poorly designed (A(0) ≠ 0) and made with material and technological errors (B(0) ≠ 0), subject to aging processes (D(t) ≠ 0). The facility already has a limiting load capacity lower than that of a properly constructed facility when it is put into operation. The next characteristic presents a facility that is properly constructed (A(0) = B(0) = 0), but subject to aging processes (D(t) ≠ 0), and poorly operated (C(t) ≠ 0). To illustrate the impact of poor operation, the characteristics of a properly operated facility are also shown. The last characteristic applies to an ideal facility (A(0) = B(0) = C(t) = D(t) = 0), which can only fail if there is a interfering stimulus (E(t) ≠ 0) with an appropriate value. Considering the physical processes that occur in electric power facilities during operation, the following types of damage can be distinguished [5]:
• damage caused by impulsive exposure;
• damage caused by cumulative exposure;
• damage caused by the relaxing exposure.
Impulse exposures cause damage when the instantaneous value of the exposure exceeds the instantaneous strength of the facility. The moment of damage is random, as exposure values are random variables. They can appear at any moment, independent of the facility’s operating time [1, 5].
The cumulative effect of exposure causes damage through gradual wear or aging of the facility. Its proper operation requires that the values of operating parameters fall within certain acceptable ranges. Wear and aging processes cause these parameters to deteriorate. The achievement of these parameters beyond the permissible limits leads to damage to the facility [1, 5].
The relaxing exposure is the cause of damage, the probability of which increases as the facility ages. In this case, the cumulative exposure promotes the appearance of damage caused by other factors [5].
During the operation of electric power equipment and facilities, their damage can be determined simultaneously by all three types of exposure impact. If each exposure causes damage of one type, then the exposures affecting the facility are independent and it is easier to describe their impact and isolate the dominant exposure. The situation becomes much more complicated when a particular exposure is the cause of two or three types of damage. In such a case, the interconnectedness of these causes of damage should be considered. If a particular exposure is strongly correlated with one type of damage, then it can be assumed that the damage to the facility is determined by one type of exposure impact, and the others are ignored [1, 5].
Analysis of the seasonality of failure of electric power facilities
The analysis results presented below include seasonal variation in the frequency of failures and the most common causes of failures. The study of the seasonal variation of the frequency of failure of electric power facilities includes the presentation of empirical data, as well as the implementation of the theoretical model in the form of an approximation function. The approximation function can be any mathematical function. For the sake of clarity and simplicity of notation, a polynomial was adopted as the approximation function. Since in all cases the coefficients of the approximation function obtained for an order higher than fourth are close to zero, a decision was made to approximate the function of seasonal variation of equipment failure frequency with a polynomial of at most fourth order. Such a polynomial has the following form:
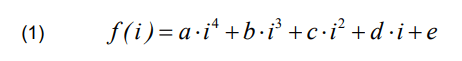
where: i – the subsequent number of the month; a, b, c, d, e – coefficients of the approximation function.
For each function, the correlation coefficient with empirical data is given. Based on the results of many years of operation, the months with the highest and lowest number of failures were identified. This is very important information for electricity distributors. This is because it makes it possible to carry out scheduled maintenance and inspections during the period of time when the number of failures is lowest. There is then much less likelihood of damage to the equipment remaining in operation, without the possibility of using the reserve currently under repair. In addition, it creates the conditions for better organization of work through the planned creation, for the period with an increased incidence of failures, of a larger number of repair brigades for their removal.
Table 1 shows the frequency of damage to equipment and facilities operated in electric distribution networks, by month of the year. These data in the form of a histogram and approximation functions are shown in Figure 2.
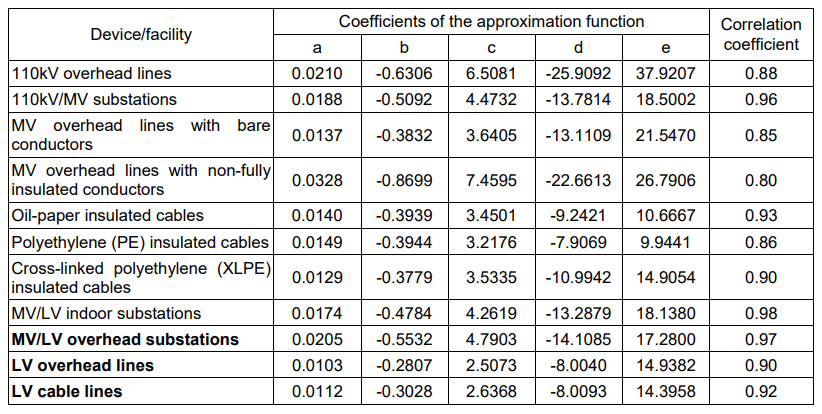
Table 2 shows the coefficients of the approximation functions of the seasonal variation of the frequency of failure of equipment and facilities operated in electric distribution networks. It also includes correlation coefficients of the determined functions against empirical data.
The highest number of 110kV line failures was observed in the winter months (January, December) and in the summer and autumn months (July to October). During the a winter period, 63 failures occurred, which makes up for 28.25% of all damages (the most in January – 17.94%). During summer and autumn months, 90 failures occurred, which makes up for 40.36% of all damages (the most in August – 14.35%). In other months, the unreliability of the lines is well below the average damage intensity.
Table 1. Frequency of damage to equipment and facilities operated in power distribution networks by month of the year [%]
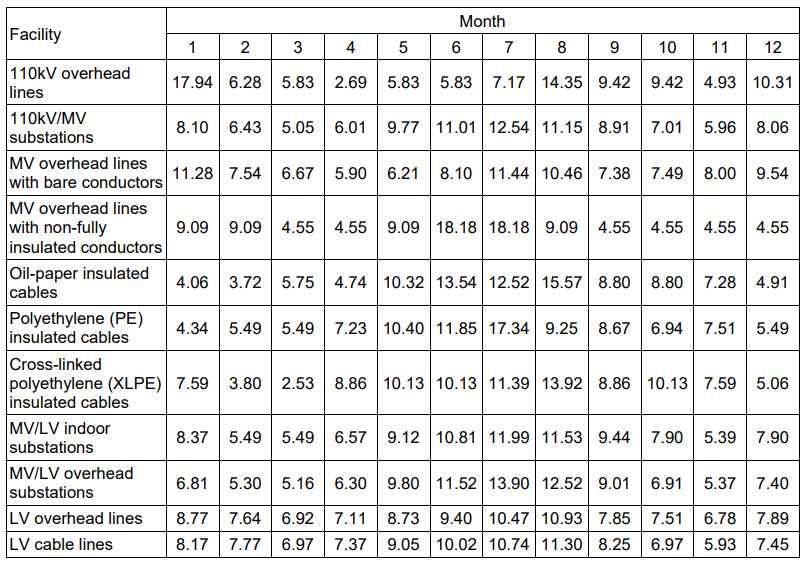
Table 2. Coefficients of approximation functions of seasonal variation of frequency of failure of equipment and facilities operated in distribution networks and correlation coefficients of functions with empirical data

The greatest number of 110kV/MV substations failures was observed in the summer months (May to September) and winter w months (January, December). During the summer period, 1120 failures occurred, which makes up for 53.38% of all damages. During winter months, 339 failures occurred, which makes up for 16.16% of all damages. In other months, the unreliability of stations is well below the average damage intensity.
The greatest number of MV overhead line failures was observed in the summer months (July, August) and winter w months (January, December). During the summer period, 427 failures occurred, which makes up for 21.90% of all damages. During winter months, 406 failures occurred, which makes up for 20.82% of all damages. In other months, the unreliability of the lines is below the average damage intensity.
Most failures of MV insulated overhead lines were observed in the summer months (June, July) and in the winter months (January, February). During the summer period, 8 failures occurred, which makes up for 36.36% of all damages. During winter months, 4 failures occurred, which makes up for 18.18% of all damages. In other months, the unreliability of the insulated lines is below the average damage intensity.
Most damage to medium-voltage cables with oil-paper insulation was observed in the summer months (May-August). During this period, 307 failures occurred, which makes up for 51.95% of all damages. In other months, the unreliability of medium-voltage cables with oil-paper insulation is much lower.
Most damage to medium-voltage cables with polyethylene insulation was observed during the summer months (May – August). During this period, 169 failures occurred, which makes up for 48.84% of all damages. In other months, the unreliability of medium-voltage cables with polyethylene insulation is much lower.
Most damage to medium-voltage cables with crosslinked polyethylene insulation was observed in the spring and summer months (April to October). During this period, 58 failures occurred, which makes up for 73.42% of all damages (on average, 10.49% per month). In other months, the unreliability of medium-voltage cables with cross-linked polyethylene insulation is much lower.
For both indoor and overhead MV/LV substations, most failures were observed in the summer months (May to October) and in the winter months (January, December). During the summer, there were 1,693 failures at indoor substations and 1,851 failures at overhead substations, accounting for 60.79% and 63.67% of all failures, respectively. During the winter months, there were 453 failures at indoor substations and 413 failures at overhead substations, accounting for 16.27% and 14.21% of all failures, respectively. In other months, the unreliability of stations is well below the average damage intensity.
The greatest number of LV overhead line failures was observed in the summer months (May – August) and winter w months (January, December). During the summer period, 4101 failures occurred, which makes up for 39.53% of all damages. During winter months, 1728 failures occurred, which makes up for 16.66% of all damages. In other months, the unreliability of the lines is below the average damage intensity.
The greatest number of LV cable line failures was observed in the summer months (May – August) and winter w months (January, December). During the summer period, 513 failures occurred, which makes up for 41.11% of all damages. During winter months, 195 failures occurred, which makes up for 15.63% of all damages. In other months, the unreliability of the LV cable lines is below the average damage intensity.
Analysis of the causes of failure of electric power facilities
The analysis on the causes of failure of electric power facilities includes the presentation of empirical data obtained from ten years of observations of the failure rate of electric power facilities in the area of operation of a major electricity distribution company in the country. The factors causing the greatest number of power facility failures were identified.
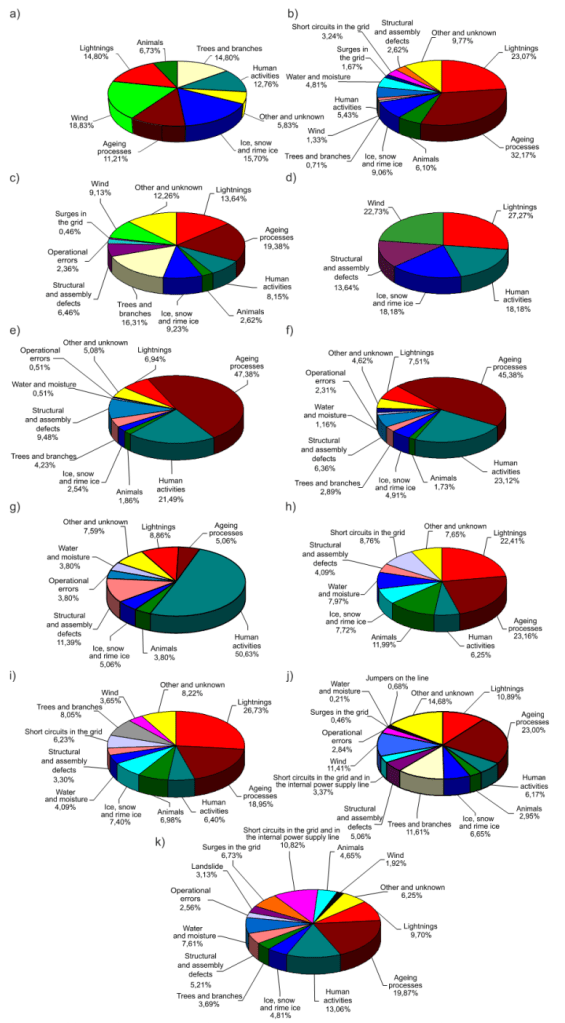
The percentage of individual causes of failure of equipment and facilities operated in electric distribution networks in their total number is shown in Figure 3.
The most serious cause of 110kV line failures is wind, which caused about 18.83% of all failures. The second cause is ice, snow, and rime ice, which resulted in about 15.70% of all line damage. The most frequent cause of 110kV/MV substations failures are ageing processes, which caused about 32.17% of all damages. The second cause is lightning, which resulted in about 23.07% of all station damage.
The most serious cause of failure of MV overhead lines with bare conductors is aging processes, which resulted in about 19.38% of all line failures. The second cause of failure is trees and branches, which caused about 16.31% of all damage. Seasonal causes, but with a significant impact on the failure rate of MV overhead lines, are lightnings, and ice and rime ice. They caused 13.64% and 9.23% of all damages, respectively.
The most serious cause of failure of MV insulated overhead lines is lightning, which caused about 27.27% of all damage. The second cause is wind, which caused about 22.73% of all damage to insulated lines.
The most serious causes of failure of cable lines with oilpaper insulated cables are aging processes, human activity (mechanical damage) and structural and assembly defects. Aging processes caused about 47.38%, human activity caused about 21.49%, while structural and assembly defects caused about 9.48% of all damage to medium-voltage oil-paper insulated cables. During the summer months (June-September), lightning is an additional cause of failures, which caused a total of 6.94% of all failures.
The most serious causes of failure of cable lines with polyethylene (PE) insulated cables are aging processes, human activity (mechanical damage) and lightning. Aging processes caused about 45.38%, human activity caused about 23.12%, while lightning caused about 7.51% of all damage to polyethylene-insulated medium-voltage cables.
The most serious causes of failure of cable lines with cross-linked polyethylene (XLPE) insulated cables are human activity (mechanical damage), structural and assembly defects and lightning. Human activity (mainly damage during earthworks) caused about 50.63%, structural and assembly defects caused about 11.39%, while lightning caused about 8.86% of all damage to medium-voltage cables with cross-linked polyethylene insulation.
The most serious cause of MV/LV substations failures are ageing processes, which caused about 23.16% of all damages. The second cause is lightning, which resulted in about 22.41% of all station damage. The most serious cause of overhead MV/LV pole substation failures is lightning, which resulted in about 26.73% of all damage. In second place are aging processes, which resulted in about 18.95% of all substation damage.
The most serious cause of LV overhead line failures are ageing processes, which caused about 23.00% of all damages. The second cause is trees and branches, which resulted in about 11.61% of all line damage. Seasonal causes, but with a significant impact on the failure rate of LV overhead lines, are lightnings, and ice and rime ice. They caused 10.89% and 6.65% of all damages, respectively.
The most serious cause of LV overhead line failures are ageing processes, which caused about 19.87% of all damages. The second cause is human activity, which resulted in about 13.06% of all line damage. Seasonal causes, but with a significant impact on the failure rate of LV cable lines, are lightnings, and ice and rime ice. They caused 9.70% and 4.81% of all damages, respectively.
Summary and final conclusions
On the basis of the research and analysis carried out, a number of specific conclusions can be formulated, relating to individual electric power facilities. Due to the limited size of the article, only general conclusions relating to all analyzed facilities will be presented:
1. Studies of the annual variability of the frequency of failures have shown that for all the analyzed electric power facilities, the period of increased unreliability is the summer period. There is also a second period of increased unreliability in winter (not the case with cable lines).
2. The annual variation in failure frequency is much smaller for equipment operated indoors.
3. Inspection, measurement, and maintenance work for all equipment operated in the distribution networks should be carried out in the spring months, in order to detect any irregularities and avoid some failures during the summer and in the autumn, in order to repair any damage caused during the summer season before winter. During these periods, there is also a small probability of damage to the facility, which for the duration of the survey or maintenance work takes over the load of the facility on which the work is performed. Thus, the likelihood of a power outage to consumers is minimized.
4. The main causes of equipment failure are ageing processes and lightning. In the case of overhead lines, ice, rime ice and wind are also important causes, and in the case of cable lines, human activity.
5. In summer, most failures are caused by lightning, while in winter, they are caused by ice, rime ice and snowstorms.
6. Since the number of failures caused by lightning is very high (14.8% for 110kV overhead lines, 23.07% for 110kV/MV substations, 13.64% and 27.27% for MV overhead lines with bare and insulated conductors, respectively, 22,41% and 26.73% for indoor and overhead MV/LV substations, respectively), it should be presumed that the lightning protection and surge protection systems in use are ineffective, which may be related to their improper implementation or operational errors.
7. A significant number of failures are caused by animals, mainly rodents (indoor substations) and birds (overhead substations and lines).
8. With reference to the previous points, it should be said that by properly protecting equipment from lightning (mainly overhead lines and substations) and from animals (mainly busbars and transformers), the number of failures can be drastically reduced.
9. In the opinion of the Author of this study, an excessive number of overhead line failures is due to wind (18.83% for 110kV lines, 9.13% for bare wire MV overhead lines, 22.73% for MV overhead lines with insulated wires, and 11.41% for LV overhead lines). The results of the study allow us to conclude that vibration protection in overhead lines is not fully effective, or vibration chokes are underused in these lines. The cumulative nature of much of the damage that occurs also points to insufficient supervision of overhead lines by power companies.
Many failures are caused by human activity, with a distinction being made between accidental actions (damage to cables during earthworks, damage to poles or breaking of lines when work is carried out near them or when trees are cut down) and intentional actions (jumpers on overhead lines, theft of transformers, etc.).
REFERENCES
[1] Chojnacki A.Ł.: Analiza niezawodności eksploatacyjnej elektroenergetycznych sieci dystrybucyjnych. Wydawnictwo Politechniki Świętokrzyskiej, Kielce, 2013, ISSN 1897-2691.
[2] Horak J., Gawlak A., Szkutnik J.: Sieć jako zbiór elementów. Wydawnictwo Politechniki Częstochowskiej, Częstochowa, 1998
[3] Horak J.: Sieci elektryczne. Część 3. Zagadnienia optymalizacyjne w projektowaniu sieci rozdzielczych. Wydawnictwo Politechniki Częstochowskiej, Częstochowa, 1990
[4] Kowalski Z.: Niezawodność zasilania odbiorców energii elektrycznej. Wydawnictwo Politechniki Łódzkiej, Łódź, 1992
[5] Lesiński S.: Niezawodność łączników energoelektrycznych. Badania i ocena. WNT, Warsaw, 1983
[6] Marzecki J., Miejskie sieci elektroenergetyczne. Oficyna Wydawnicza Politechniki Warszawskiej, Warszawa, 1996
[7] Niebrzydowski J.: Sieci elektroenergetyczne. Wydawnictwo Politechniki Białostockiej, Białystok, 1997
[8] Sozański J.: Niezawodność zasilania energią elektryczną. WNT, Warsaw, 1982
[9] Wasiluk W., red. Poradnik inżyniera elektryka, vol. 3. WNT, Warsaw, 2011
Autor: dr hab. eng. Andrzej Ł. Chojnacki, prof. of the UoT, Kielce University of Technology, Chair of Power Engineering, Power Electronics and Electrical Machines, Aleja Tysiąclecia Państwa Polskiego 7, 25-314 Kielce, e-mail: a.chojnacki@tu.kielce.pl
Source & Publisher Item Identifier: PRZEGLĄD ELEKTROTECHNICZNY, ISSN 0033-2097, R. 99 NR 1/2023. doi:10.15199/48.2023.01.30
