Published by M. Safiuddin, University at Buffalo, The State University of New York | SUNY Buffalo · Department of Electrical Engineering BE(Elec), MS, MBA, Ph.D
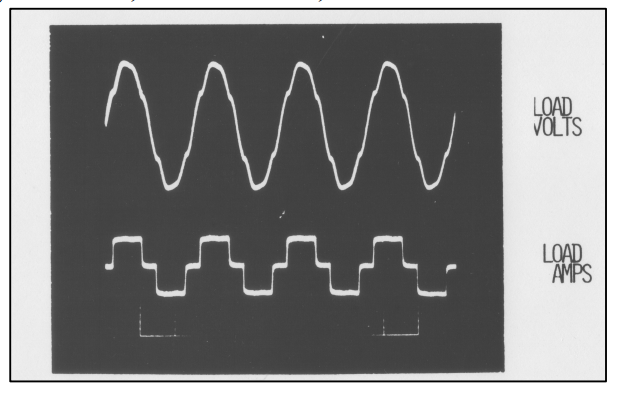
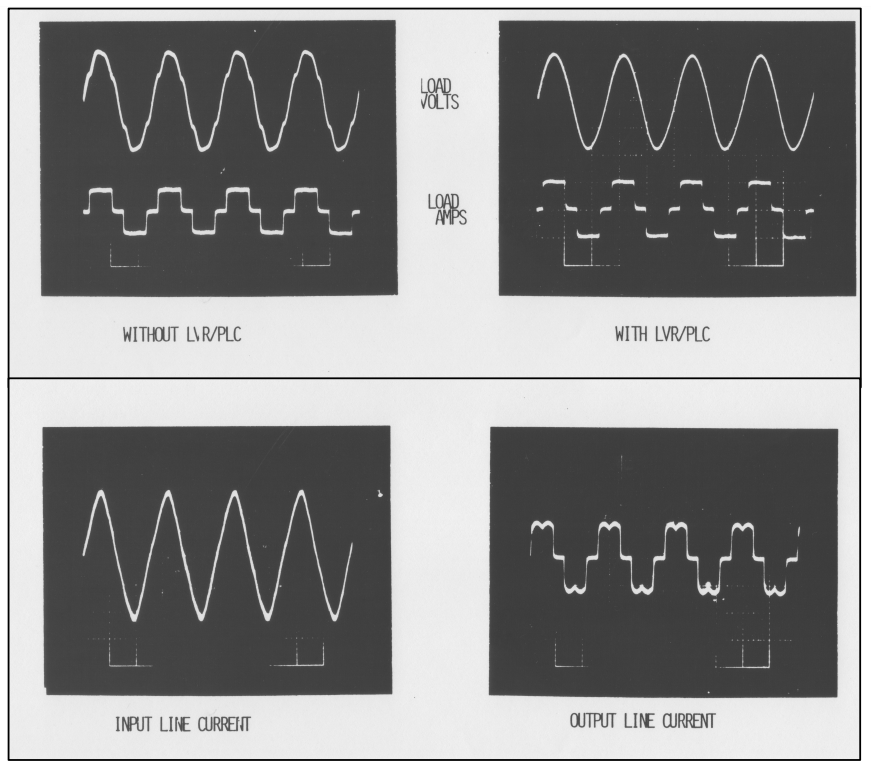
Abstract: This case study covers development of a single-phase, integrated, line voltage regulator and harmonics power conditioner for small capacity standby or mobile generators, supplying nonlinear loads, such as those found on factory test floors, aircraft carriers, submarines and MASH [Mobile Army Surgical Hospital] units. In order to minimize the overall weight and size of power system equipment, 400 Hz frequency is often used in these systems. Because of the limited rating of these generators, the source impedance is relatively high. Load current harmonics produce distorted voltage drops across the source impedance, which create voltage distortions at the supply bus, as shown in the oscillograph. These could be harmful to sensitive loads connected to the same power bus.
The basic concept was to design a “black box” to be connected between the generator and the non-linear load such that it would appear as an ideal “Infinite Capacity” voltage source to the load at the output terminals, and it would appear as a linear “Passive RLC Load” at the input terminals, as shown in the conceptual block diagram.
The system was designed, and three prototype units were built as a 25 KVA, 400 Hz, three-phase Wye, 208/120 Volt system, and tested on the test floor of a manufacturing facility. The performance evaluation tests were completed on October 1, 1985. The non-linear load consisted of a three-phase Thyristor Power System manufactured for a foreign client. Starting with performance specifications, and brief description of the technical concept, the test results are presented in this case study.

Performance Specifications:
Before any design or development project is started, performance objectives must be well documented. They should not only cover Technical Specifications but also quantitative objectives for Cost Effectiveness, Reliability, Compatibility, Producibility, etc. Only the Technical Specifications are documented here in Table I.
Table I—Technical Specifications

Design Concept:
The basic concept is very simple. Compensation for two voltages, and one current component is needed. A voltage component (Vr) is needed to compensate for voltage drop/rise across the source impedance due to load or bus voltage variations. Another voltage component (-Vh) is needed to cancel voltage drop (Vh) generated due to current harmonics. A current component (Ih) is needed to supply load current harmonics. So, a voltage source in series and a current source in parallel are required.
As shown in the simplified circuit, a series transformer (TRS) is inserted in the input power line. A DC reactor LDC is used as a current source. Two single-phase, full-wave, Pulse Width Modulated [PWM], bridges are used to produce the required voltage component VVR [Vr –Vh] across TRS and the harmonic component Ih of the load current. However, since the parallel bridge supplies the harmonic currents needed by the load, and is not supplied by the input source, very little harmonic voltage compensation is needed at TRS.
Performance Verification:
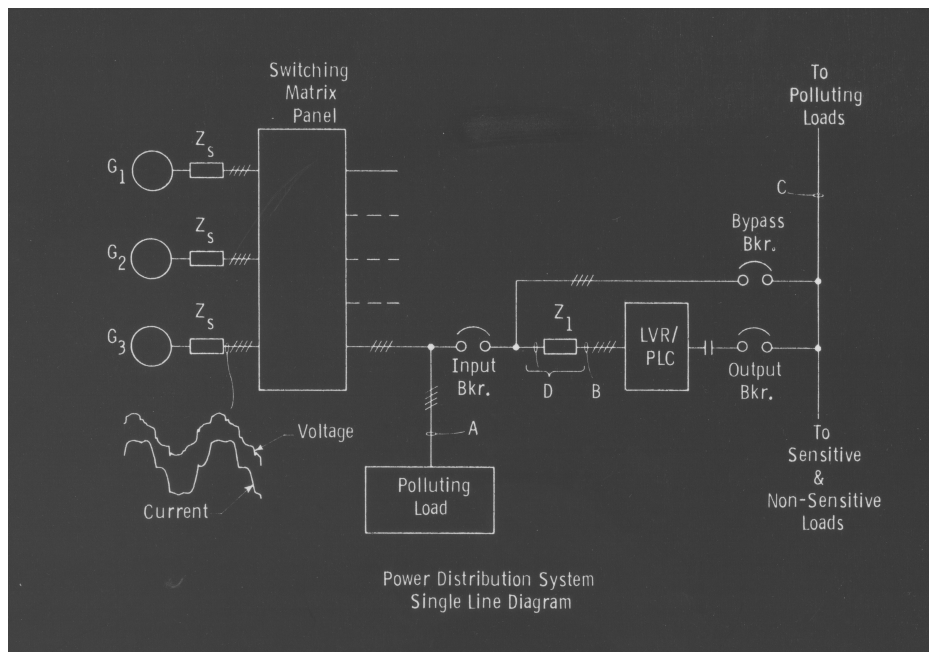
Three prototype units were built for field start-up and acceptance testing in a 25 KVA, three-phase, 208/120 Wye, and 400 Hz, power system of a test floor facility of a manufacturing plant. The performance verification tests were conducted in September 1985. Single line diagram of the 3-phase, 4-wire, test set-up is shown below.
The Non-Linear Load: A fully assembled TPS [Thyristor Power System] demanded 90-95 Amps (RMS) at 208/120 V, 400 Hz, under test. The resulting phase currents had rich harmonic characteristics of a three-phase, full-wave, rectifier. The voltage distortion imposed on the generator #2 was some what less due to its higher capacity relative to the load rating (lower source impedance). The total harmonic distortion was 8.6% at full load.
Test Set-up: The TPS was required to be operating while other sub-assembly benches were also operating on the test floor. This meant that the LVR/HPC had to be rated at a minimum of 37.5 KVA just to operate the TPS at its rating, not including other rectifier loads. Since it was not possible to fully condition the TPS with only a 25 KVA system, a buffered zone was set-up by inserting impedance (Z1) between the feeder to the TPS and the generator bus, as shown in the single-line diagram.
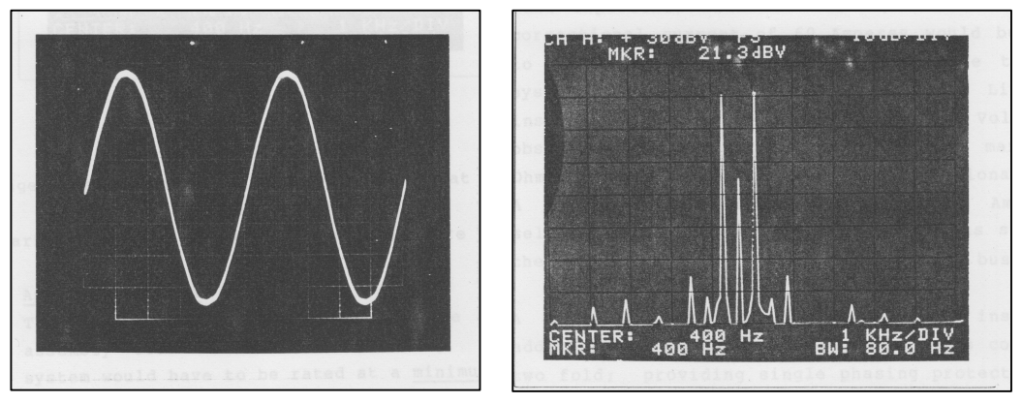
The generator #2 output was monitored under no-load operation at the instrumentation panel, since access to generator terminals was not available, as shown in the following oscillograph.
Past data for the TPS had shown that a peak correctional current of 60 Amps would be required for complete harmonic conditioning. However, the 25 KVA system could only supply 40 Amps peak. Likewise, an instantaneous voltage deviation of 12 volts could be observed. Assuming 12 volts as the maximum deviation, 0.3 ohm impedance was needed to limit the peak correctional current. A 0.27-Ohm power resistor, rated for 65 Amps, was selected with 75’ cable bus duct providing the differential 0.03-Ohm. A contactor was connected in the output circuit, as shown in the single-line diagram, for single phasing protection and load isolation during the system powerup. The control circuit made sure that the contactor would not close unless all three single-phase units were operating properly.
System Tests:
1. Input frequency change from 415 Hz max to 400 Hz from a non-synchronous source. Response to step frequency change of 0.5%:
Using a non-synchronous M-G set, input frequency was varied. It was 412.8 Hz at no-load. The generator was loaded in steps using a resistive load bank until the generator frequency dropped to 400 Hz. The rate of change of frequency {df/dt} was natural response of the M-G set. The oscilloscope was synchronized to the M-G output frequency to monitor the phase of the reference filter output. The steady-state error was negligible. During the frequency change, the parallel conditioner picked up 16 Amps of reactive current. This decayed and reverted to a leading PF from CHFS. Frequencies below 400 Hz were tested for “Go: No-Go” performance. Frequency step change response was tested with a synchronous generator. Consequently, the transient deviation was too small to be analyzed. The step recovered after two cycles. The LVR-HPC performance was not affected.
2. Motor-Generator Dump test to simulate power failure.
The breaker to the drive motor of the M-G set was opened to simulate loss of power. The LVRHPC system shut down in a controlled manner. The M-G set was re-started and transient voltage applied with a transfer from manual to regulated excitation. LVR-HPC system sequenced up properly. This test was repeated inadvertently when the remote sensor leads were connected incorrectly. The faulted bus caused the drive synchronous motor to slip poles and drop off line. The LVR-HPC system also shut down in a controlled manner, without any component failures.
3. Voltage regulation on the load side with line side variation of + 10% or higher.
With input voltage varied +10%, the LVR-HPC regulation was 0.5%. The output voltage was set for 118.4 V and not 115.0 Volts. The input voltage range was 128.4 V to 105.3 volts [117 + 10%]
4. Voltage regulation on load side with load varied from 0% to 125% [Linear and non-linear loads]
The load test had to be limited to 40 Amps due to the buffered zone impedance. There was no difference between linear and non-linear loads over the useable range. However, the test was considered inconclusive since the input line voltage varied widely when loaded, due to the buffered zone impedance.
5. Zone voltage adjustment range: 100 V (min) to 125 V (max) or best obtainable.
The LVR-HPC was adjustable from 104.8 V min. to 128.8 V max. with a nominal 126 volts at the input. Test conducted at no-load.
6. Transient response tests:
With load steps fro 0%–10%; 0%–50%; 0%–100%; and 100%- -0%. Voltage regulator transient response was measured using 40 Amps as 100% current. There was little difference between 10%, 50%, and 100% load steps on the response time. The highest overshoot appeared at the highest load step. The undershoot was 12.04% for the 100% load step with settling time of 95 msec. to reach 0.5% nominal steady-state band. On the other hand, overshoot was 20.3% with a settling time of 85 msec.
7. Power-up and no-load excitation behavior:
The start-up dynamics and excitation characteristics shall be measured and recorded.
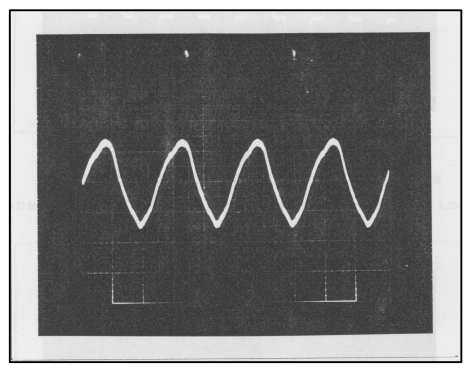
No special current inrush was noted during Powerup. A load sequence contactor was used to assure each unit would be in the normal regulation mode when 400 Hz power was applied to the test bench area. The steady state, no-load, excitation currents were (11-j20) Amps [22.7 at 610 lag], as shown in the oscillograph.
8. Harmonic voltage correction performance on the line side:
Measurement range not to exceed 250 kHz. Peak correctional current not to exceed + 40 Amps. With the LVR-HPC disabled, the line voltage drop was 8.2 Volts, THD of 9.67%, and 7th harmonic at 7%. With the LVR-HPC operating, the line voltage drop was 0.12 Volts, THD of 1.4%, and 3rd harmonic at 0.89%.
9. Harmonic voltage and current correction performance
10. Zone Performance with a TPS on the main bus and non-linear load within Zone:
This test was performed with non-linear loads on both sides of the LVR-HPC to verify that the major portion of the conditioning current serviced the zone. The results were very favorable. THD was less than 1.8% voltage and regulation of 0.11%.
With the LVR-HPC installed, any reactive compensation, if needed on the bus, can be implemented with capacitors, since the unit appears as a simple passive linear load. Load current harmonics are isolated from the PF correction capacitors.
Reference:
Moran, Steven; “A Line Voltage Regulator/Conditioner For Harmonic-Sensitive Load Isolation”; IEEE/IAS Annual Meeting 1989; Conference Proceedings; Pages 947-951
Author: M. Safiuddin, University at Buffalo, The State University of New York | SUNY Buffalo · Department of Electrical Engineering BE(Elec), MS, MBA, Ph.D.
Areas of technical interests cover optimal control systems, renewable energy, Smart Grid power systems, and application of engineering tools to socio-economic systems such as measurement of economic power, investment strategies.
Source URL: https://www.researchgate.net/publication/312135574_Case_Study-_Line_Voltage_RegulatorHarmonic_Conditioner
