Published by Fabrice GONÇALVES, António LEBRE, Pedro VELOSO, Fernando BASTIÃO, Nuno MELO, DP Distribuição – Portugal. Emails: fabrice.goncalves@edp.pt, antoniojose.lebrecardoso@edp.pt, pedro.veloso@edp.pt, fernando.bastiao@edp.pt, nuno.melo@edp.pt
24th International Conference & Exhibition on Electricity Distribution (CIRED). 12-15 June 2017.
ABSTRACT EDP Distribuição, as distribution system operator (DSO), has been developing an ambitious Power Quality (PQ) monitoring program.
This paper aims to present the multiple efforts that have been made by a DSO developing support tools and platforms in order to promote the continuous improvement of the PQ monitoring program. The main goals are to produce fast, robust and reliable analysis, transforming PQ data into suitable information, and improve the power quality management process and its transparency, adding value to the network operation and all network users.
INTRODUCTION
EDP Distribuição (EDP D) is a EDP Group Energias de Portugal company. As the main Distribution System Operator (DSO) in Portugal mainland, EDP D has about 6,1 million of network customers.
To ensure a high level of Quality of Service (QoS), EDP D has been developing systematically, since 2001, a program for Power Quality (PQ) monitoring, according to NP EN 50160 standard and the national QoS Regulation Code [1]. Globally, this program allows to characterize PQ at distribution level, to improve the operation and maintenance of the distribution network, to support the network users and to report PQ information, namely to regulatory authorities and online.
To support this challenging PQ program, EDP D has been developing a suitable PQ monitoring technical platform. With the evolution of monitoring devices and tools and subsequent learning of them by EDP D, this program has had a substantial development. In 2010, the introduction of PQ permanent monitoring in some HV/MV substations was an important step.
EDP D is facing multiple and diverse challenges in the management and development of its PQ monitoring program. Besides the technological evolution taking place, regulatory and standardization changes, demands and recommendations are an important issue to take into account. Sometimes the available technology, hardware or software level doesn’t allow for an immediate answer to that, leading to an onerous and long-term development in partnership with manufacturers.
The program implementation has allowed to obtain a wealth of PQ data and results, building up a very substantial and interesting repository of PQ information and knowledge. From this point of view, several challenges are arising. Some related with the quantity of data (big data), the guarantee of its quality and compatibility with all sources. Others related to the improvement of data analysis in order to allow a full and efficient use of data, and to provide required and reliable information to all stakeholders.
Simultaneously, the dimension and complexity growth drive to big challenges at management level and in guaranteeing of security and transparency. The systematization of PQ processes could be a useful and helpful tool. To face all these challenges, EDP D has been developing support tools and its PQ monitoring platform.
PQ MONITORING PLATFORM CURRENT STATEMENT
EDP D has been progressively developing a PQ monitoring platform in order to fulfil the PQ monitoring program to answer to the increasing demands and challenges. The PQ monitoring platform comprises the PQ monitoring recorders, communication infrastructures and PQ management centre (databases, management and analysis’ software and its related applications). The present global topology is shown in Figure 1. With this architecture it is possible to assure the requirements of the Portuguese QoS Regulation Code, including the most recent changes from the last edition and all other internal requirements. Therefore, systematic monitoring campaigns in substations are performed, as well as permanent monitoring in HV/MV substations.
Portable PQ recorders are used for temporary monitoring campaigns and voltage measurements are performed in MV busbars of HV/MV substations and LV busbars of MV/LV secondary substations.
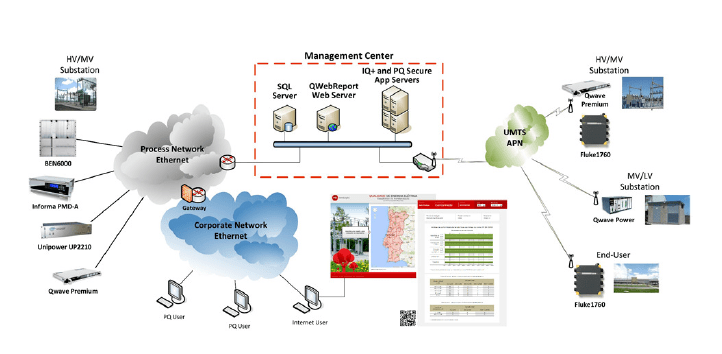
Since 2010, fixed class A PQ recorders according to the IEC 61000-4-30 standard have been installed in all new HV/MV substations and also in those submitted to a major refurbishment, in order to perform permanent PQ monitoring. Voltage measurements are performed in MV busbars, as well as current measurements.
Some customers are supported by a dedicated PQ monitoring in order to perform an accurate characterization of the PQ supplied and to identify improvement actions. Typically, a portable class A PQ recorder is installed for monitoring for at least one month.
About 75% of fixed PQ recorders installed in HV/MV substations are provided with Ethernet communications supported by a dedicated internal communications network. All other PQ recorders (the remaining 25% of the fixed and all the portables) are equipped with a 3G modem, supported by a mobile communications UMTS network.
Thus, all PQ recorders are provided with fast and reliable remote communications to a central server, regardless of their type and location of installation.
All the collected data is stored automatically in a bulk SQL database and processed in order to create PQ reports according to the requirements of the Portuguese regulation and for other types of analysis. These specific reports are produced using a dedicated web based application, which reads data directly from the SQL database.
In order to reinforce the proper storage and the security of PQ data, the PQ management centre was transferred to a Data Protection Centre, allowing backup of the data and an easily expansion because of their virtualized structure.
Since 2014, the PQ plan and results from the monitoring program activities have been published on EDP D’s website.
PQ MONITORING PLATFORM DEVELOPMENTS
In order to guaranty PQ monitoring platform evolution, according to EDP D PQ’s monitoring strategy, some new features are being implemented or under analysis.
Warning system on data quality and PQ limits violation
To have an awareness of the issues that require attention in PQ monitoring platform, EDP D felt the need to develop a warning system that allows, in an automatic way, fast identification of problems in data quality and PQ limits violation analysis, according to parametrized EDP D’s PQ requirements.
Each PQ recorder has a specific software manufacturer, which ensures, among other functionalities, the configuration of some kind of alerts. However, the available alerts are different from one device to another, depending on its manufacturer.
Regarding this limitation, and to ensure the same level of alerts independently of used PQ recorder, the warning system will be developed over the existing web based application where PQ data is processed, in order to provide PQ overview reports.
The specification for this tool includes the following functionalities:
Data Quality – Communication faults with PQ recorders, errors in data collection, percentage of data’s coverage for each PQ recorder, proper recording of voltage events, errors in weekly-based automatic process of data compilation;
PQ analysis – Use of continuous phenomena data and voltage events, compared with definable limits for daily analysis and information of Power Quality Index for analysis according to NP EN 50160 standard;
Daily Automatic Report – Possibility to set the hour for the process’s start, to report on the 24 hours of the previous day and to send by email or to use the web based application for report access and search.
Application of PQ indexes
The growth of monitoring points and consequent increase of available data offers a comprehensive history, allowing analysis with a fairly representative time base, which becomes representative of the network. It is therefore important to have a systematization approach to transform PQ data into relevant information for network management and operation. Thus, it is important to choose and/or develop adequate PQ indexes capable of translating PQ data into necessary PQ information.
Regarding continuous phenomena, the recorded data from each monitoring point is currently transformed into a continuous phenomena Power Quality Index by the web based application. This index translates in numerical terms and for each of the continuous phenomena, how far we are from nonconformity, providing a clear perception of the performance of each monitored point in relation to NP EN 50160 standard, unequivocally, identifying situations of nonconformity. However, and despite the relevant information that this index already produces, it needs to evolve in order to make an easier comparison in historical terms, i.e. the same monitoring point at different periods of time, but also in comparative terms, i.e. from one monitoring point to another.
Regarding voltage events, particularly voltage dips, EDP D has, for many years, consistently followed the evolution of the number of voltage dips per MV busbar at HV/MV substations within the scope of PQ monitoring program. The classification of the voltage dips has been made according to the criteria of NP EN 50160 standard. However, the number of voltage dips per MV busbar does not reflect the number of customers affected by these voltage events, i.e. a voltage dip has the same impact if the MV busbar feeds only one customer or ten thousand.
Table 1. Classification of dips in terms of residual voltage and duration according to the NP EN 50160 standard.

In order to overcome this limitation, EDP D is developing the use of SARFI (System Average RMS Variation Frequency Index) concept in MV network. In this case, EDP D uses the concept of SARFIMV considering MV delivery points (MV/LV secondary substations and MV customers).

where
a is the number of voltage dips per MV busbar,
b is the number MV/LV substations supplied by the MV busbar,
c is the number of MV/LV substations supplied by MV busbars,
n is the number of MV busbars under analysis
It is important to develop flexible tools to achieve automatic calculation, particularly in the selection of criteria used to calculate the SARFIMV, enabling to perform some sensitivity studies.
This tool for automatic SARFIMV calculation is intended to be developed over the existing web based application. The main functionality of this tool enables users to choose the criteria that will be used for calculation. This means that users can easily calculate a SARFIMV depending on voltage dips residual voltage u or voltage dips duration t, or even more depending on both (curve).
This functionality allows sensitivity studies to be carried out, in order to understand which information is possible to get from the index changing the selected criteria.
PQ processes systematization
The clear definition and systematization of PQ processes was identified as an important tool to help in the operation, management and development of the PQ monitoring program.
As a starting point, a core process was defined – Manage Power Quality, based in the regulatory requirements to characterize the PQ in the distribution network operated by EDP D, and the respective sub-processes as shown in Figure 2.
Therefore, the main goal and scope of this process is to manage the verification of PQ in the distribution network, in accordance with the Portuguese Regulation and respective procedures to PQ monitoring and information reporting.
This PQ core process is part of EDP D’s QoS Management Process, which also includes continuity of supply.

In addition, another management tool was introduced with the definition of compliance controls inside each process.
FUTURE TRENDS
The role of PQ in the current distribution networks is becoming increasingly important and EDP D wants to remain at the forefront of its potentialities.
As such, EDP D is focused on some future projects that aim to be a step forward from the current use and management of PQ data.
Unified Data Model (MDU)
There is a permanent need to get extra value from PQ data. In this sense, a project (MDU) is being developed in order to correlate PQ data and other network data sources, such as continuity of supply and SCADA data.
This project is being designed so that any user with the right permissions can get information in an automated way from different sources and, thus, better understand some occurrences in the network. With this functionality, manual manipulation as well as possible errors arising from any misuse are prevented.
This project will also help dealing with the constantly growth of recorded PQ data due to a continuously increase of the number of devices used in permanent PQ monitoring. In this sense, the application of big data and data analytics technologies will be of great value.
Online PQ information for operation support
As stated before, the increasing of recorded PQ data implies a similar increase of automation of its analysis. Besides that, it is important that PQ analysts and the operators that manage network online can perform faster actions in case of potential network PQ problems, anticipating, in most cases, their resolution.
Taking into account the difficulties related to slightly time lagged PQ analysis, like the ones on warning system, also under development, working on a time base, it is important to provide the operators with automatic and online information in case of customized PQ inputs for just-in-time actions.
Taking this in consideration, a future project will be developed in order to, as currently featured with the SCADA system, provide the operators with the relevant information that helps their decision-making to ensure a better QoS in global terms and a better PQ in particular.
When a PQ recorder registers a violation of a predefined limit, it triggers an automatic communication to the database, which in turn, sends it to a system available in the operation centre.
This information can be related to PQ continuous phenomena, such as voltage r.m.s., harmonics, flicker, etc. or related with voltage events, mainly voltage dips and swells.
CONCLUSIONS
For many years, EDP D has been developing a PQ monitoring program and platform in order to fulfil several requirements and challenges.
Year after year, more requirements and new challenges appear, some related with the increasing quantity of data, but, more than that, with the necessity to identify and work this data in order to improve the reliability and availability of the network that EDP D operates and manages.
As such, EDP D has some ongoing work, developing tools for PQ monitoring platform to produce fast, robust and reliable analysis, transforming PQ data into suitable information, developing its warning system on data quality and PQ limits violations as well as applying PQ indexes, but also improving power quality management process and its transparency with processes systematization and compliance control.
Despite the relevant work already developed in PQ monitoring field, EDP D is also aware of near future challenges, already having a portfolio of future projects that will allow a step forward from the current use and management of PQ data, improving it with Unified Data Model (MDU) and online PQ information for operation support.
Acknowledgments-The authors thank the availability and collaboration from Teresa Couceiro, Flávio Cação, António Margalho and Nuno Pinho.
REFERENCES
[1] Energy Services Regulatory Authority (ERSE), 2013, “Regulamento de Qualidade de Serviço do Setor Elétrico”, Diário da Republica, Regulamento nº455/2013 (2ª série).
Source & Publisher Item Identifier: ISSN 2515-0855. doi: 10.1049/oap-cired.2017.0421. http://www.ietdl.org
