Published by Giovanni Cipriani, Rosario Miceli, Member, IEEE, Ciro Spataro Member, IEEE DEIM University of Palermo Palermo, Italy rosario.miceli@unipa.it; ciro.spataro@unipa.it , Giovanni Tinè, Member, IEEE ISSIA National Council of Research (CNR) Palermo, Italy
Abstract— The measurements for the assessment of the electric power quality are often carried out in hostile electromagnetic environments. The aim of the paper is analyzing if and how both radiated and conducted electromagnetic emissions can disturb the measurement system used to quantify these disturbances. To achieve the target, an experimental approach is proposed, which, by means of a simple and fast test, allows establishing if the real electromagnetic environment, where power quality analysis is performed, can alter the measurements.
Keywords-electromagnetic immunity; power quality analysis
1. INTRODUCTION
In the electric power systems, determining and regulating the characteristics of both voltages and currents [1-5] is becoming more and more important, owing to the continuous increase of electric users susceptible to the variations of these characteristics respects to the rated ones [6-7]. In order to limit the injection of disturbances into the electric networks, there is the need to perform the evaluation of the so-called “electric power quality”; in many cases this evaluation is even prescribed by various national and international Standards and Laws.
Obviously, the power quality analysis must be often carried out in the proximity of the disturbance injection points (e.g. high power nonlinear loads, photovoltaic systems, fuel cells and wind generators) [8-14], where there is a high chance to utilize the measurement instrumentation in a hostile electromagnetic environment. The target of the paper is to establish if this environment can perturb the measurement instrumentation and alter the measurement results.
Due to complexity of the measurements, this kind of instrumentation is exclusively based on the analog-to-digital conversion of the electric signals and the successive processing of the acquired signals. In addition of the stand-alone power quality analyzers, more and more often, the measurements are performed using current and voltage probes, a general purpose data acquisition board connected to a common personal computer and processing (successively or in real time) the acquired data by using the computer processor itself [15-17].
This solution is less expensive respect to a stand-alone instrument and allows an easy updatability to the continuous variations of the rules prescribed by the Standards and the Laws concerning the electric power quality.
For the “stand-alone” electric power analyzers, usually characterized by the manufacturers themselves from the electromagnetic compatibility viewpoint, it is quite easy obtaining information about the levels of conducted or radiated disturbances that can alter their performances. On the contrary, with regard to more complex measurement systems, which are constituted of various components provided by different manufacturers, the analysis of their electromagnetic immunity degree is not simple. Even having access to the electromagnetic compatibility data of each component, the extension of these specifications to the whole measurement chain is not completely straightforward. The whole measurement system has to be considered as unique equipment under test. Only in this way, a complete characterization of the system from the electromagnetic compatibility viewpoint can be carried out.
To perform this characterization and to quantify the immunity degree of the measurement systems, it is necessary to choose one or more parameters that are representative of their performances and analyze if and how these parameters vary when the systems are subjected to electromagnetic disturbances.
In previous works [18-20], we showed that the parameters, sufficient to characterize an analog to digital conversion based measurement system are offset, gain, the total harmonic distortion (THD), the total spurious distortion (TSD) and the signal to noise ratio (SNR). Therefore, we used these five parameters to assess the electromagnetic immunity of the considered measurement systems.
In order to apply standard requirements and criteria for the immunity tests, we took into account the IEC-61236 standard [21] that specifies minimum requirements for immunity and emissions regarding electromagnetic compatibility for electrical equipment for measurement, control and laboratory use.
We performed an extensive series of experiments on various configurations of systems, varying the typology, the shielding conditions, the relative and absolute position of each component of the measurement chain and varying typology, amplitude and/or frequency of the electromagnetic disturbance.
By means of time and frequency analysis [22-23], we were able to assess, the electromagnetic immunity degree of a generic measurement system when it is subjected to the standardized disturbances prescribed in [21]. However, from the obtained data, we can not establish if, considering the real shielding and grounding conditions of the measurement chain, the actual and generally unknown electromagnetic environment, where the instrument will actually operate, is able to compromise its metrological characteristics. Therefore, our target is the definition of a procedure to assess the actual immunity degree to the unknown electromagnetic disturbances that are actually present in the place where the measurement is performed.
In the following we abridge the results obtained subjecting the systems to the tests advised in [21] (chapter II). In chapter III we propose the procedure to assess the immunity degree of the instruments in presence of unknown electromagnetic disturbances and in chapter IV this procedure is validated by applying it to various practical cases.
II. THE IEC-61236 STANDARD
The IEC-61236 standard [21] prescribes to subject the measurement system to the following electromagnetic phenomena: radiated radio-frequency disturbances; bursts; surges; conducted radio-frequency disturbances; voltage interruptions; electrostatic discharges; rated power frequency magnetic field. For each phenomenon the immunity requirements and limits are given for normal environments, industrial locations and for controlled electromagnetic environments. As for the instrumentation, setup and management of the experimental tests, we took into consideration the IEC-61000-4 series standards [24]. We considered the total measurement chain, constituted of cables, antialias filter, connector box, data acquisition board and personal computer, testing both full-shielded configurations and not-shielded configuration. In this framework we consider four different National Instrument data acquisition boards, whose technical characteristics are reported in table I.
TABLE I. CHARACTERISTICS OF THE TESTED BOARDS

The data acquisition boards are linked to a shielded connector box NI SCB68 through a shielded cable NI SCH6868 (1m). We tested also a not-shielded configuration linking the boards to a CB-68LP connector block trough a R6868 ribbon cable (1m). To link the measurement point to the various connector boxes, we use a RG-58 type coaxial cable (0.5 m) or a LMR0-600-DB double-shielded coaxial cable for the full-shielded configurations. Before the connector boxes is inserted an ad-hoc build IV order low-pass antialias filter.
The environment and the instrumentation used to generate the electromagnetic disturbances are full-compliant with [24].
As inputs for the tested systems, DC and sinusoidal signals are generated by the Agilent 33120A function and arbitrary waveform generator. All the measurements are performed in differential mode, sampling at the maximum rate.
In order to test the systems under radiated emissions, we performed various tests inside both a semi-anechoic chamber and a GTEM cell. radio-frequency fields with 1, 3, 10 V/m strength are irradiated towards the tested instruments, as prescribed in [21]. The disturbance frequency is incrementally swept in the frequency range 80 ÷ 1000 MHz with a 1% step size and the disturbance fields are 80% amplitude modulated with a 1 kHz sine wave [24]. All the tests were performed varying personal computers, data acquisition boards, cables and connector boxes of the tested systems, the reciprocal positions and orientations of these components and the frequency and strength of the disturbance fields.
In all cases, we observed that spurious frequencies arise during the signals acquisition [22]. These spurious components are a DC component, the disturbance modulating signal and its harmonics; in the prescribed frequency range, the disturbance carrier signal and its harmonics are completely filtered by the limited bandwidth of the tested instruments. In any case, mainly for the not-shielded configurations, the presence of these spurious frequencies reduces the TSD value and alters the offset value. By analyzing the acquired signals, we verified that the amplitude of the spurious frequency components (and consequently the coupling intensity and the immunity level) is: weakly depending on the data acquisition board, motherboard and case models and strongly depending on the shielding dress of cables and connector boxes; slightly depending on the personal computer and connector box position and strictly depending on the signal cables position; strictly depending on the disturbance strength, but not-depending on the disturbance frequency, except when the system resonates, allowing a much tighter coupling and strongly increasing the spurious frequencies amplitude.
As for the conducted disturbances, we started the experiments with the burst, which consists of a sequence of a limited number of distinct pulses whose characteristics are prescribed in [21].
Using the not-shielded configurations, during the burst injection into the supply cable, visible spikes, superimposed to the sinusoidal signal, appear causing a temporary variation of the offset and SNR values [22]. However we noticed that the acquired disturbance level depends on the reciprocal position of the signal cables and the supply cable, where the bursts are injected. This means that the disturbance injected in the supply cable produces an inductive interference with the measurement system. With the aim to quantify the inductive coupling mechanism, we tested a full-shielded configuration. With this arrangement, no effects are observed when the measurement system is subjected to the bursts; therefore, from this experiment, we can deduce that the coupling mechanism between disturbance and the measurement system is only inductive and only caused by the disturbance flowing in the supply cable [22]. To find another evidence of this thesis, we tested again the not-shielded configuration, but shielding the supply cable. Also in this way, the system is immune to the bursts.
Injecting into the supply cable a surge, which is a voltage pulse wave whose characteristics are prescribed in [21] and repeating the same methodology employed for the bursts, we obtained similar results, namely that the full-shielded configurations are practically immune to the surges, while with a not-shielded configuration the surges effects are manifestly visible on the acquired signals [22].
With the same methodology, we tested the effects of the conducted radio-frequency fields, injecting in the supply cable of the tested instruments 1 V and 3 V amplitude disturbances. The disturbance frequency is incrementally swept in the frequency range 80 ÷ 1000 MHz with a 1% step size and the disturbance signals are 80% amplitude modulated with a 1 kHz sine wave [21]. Once more the coupling mechanism between disturbance and the measurement system is only inductive and there are not conductive paths. Therefore, for the full-shielded configurations, no visible effects appear while a radiofrequency threat crosses the supply cable, and no variations of offset, gain and TSD values were observed. Repeating the experiments onto the not-shielded configuration, the emissions flowing in the supply cable couple with the measurement system and spurious frequencies arise during the signals acquisition. These spurious components are a DC component, the disturbance carrier signal and its harmonics and the disturbance modulating signal and its harmonics [22]. Of course some of these components can appear in their alias version or can be completely filtered, depending on the sampling frequency and on the instrument bandwidth. In any case the presence of these spurious frequencies reduces the TSD value and alters the offset value.
When the tested systems are subjected to 1-cycle supply interruptions, no visible effect appears during the signals acquisition, either with full-shielded configuration or with not-shielded configuration.
Contact and air discharges in both polarities were applied in various points of the measurement system, starting from 1 kV and increasing the test level value with a step size of 0.5 kV until reaching, as prescribed in [21], the 8 kV level. No visible effects were observed and therefore, with respect to the not-perturbed conditions, no changes were detected in the offset, gain, TSD and SNR values.
Eventually, the systems were subjected to 50 – 60 Hz magnetic field reaching the 30 A/m strength level prescribed for industrial locations. Also in this case, no effects were observed.
To perform the tests, we used the NI LabView programming language to drive the data acquisition boards, to process the acquired samples and to realise the user interface. During all the immunity tests, no faults of the software were detected, no system resets occurred and the measurement instruments kept on working without any loss of functions. Therefore, the software part of the instruments can be considered immune to all the electromagnetic emissions prescribed in the IEC 61326 standard.
The results of the tests can be summarized stating that, under the standard electromagnetic disturbances prescribed in [21] and mainly for the not-shielded configurations, the offset values can appreciably change and the TSD and SNR values can lower. Therefore, the standard uncertainties associated to these uncertainty sources can increase.
III. THE PROPOSED APPROACH
By analyzing the results of the tests, we are able to assess the immunity degree of a self-made power quality analyzer when it is subjected to the standardized disturbances prescribed in [21], deducing that the instrument performances can reveal perceptible degrade and, consequently, the uncertainty values can raise. However, from the obtained data, we can not establish if, considering the real shielding and grounding conditions of the measurement chain, the actual electromagnetic environment, where the instrument will actually operate, is able to compromise its metrological characteristics. Therefore, it could be useful to define a procedure which, by means of a desirably simple and fast test, allows the assessment of the actual immunity degree to the electromagnetic disturbances that are actually present in the place where the measurement is performed.
To outline this procedure, we started analyzing two interesting phenomena: we experimentally noticed that the disturbance effect is linearly added to the measurement signal (obviously excluding the cases which cause the A/D converter saturation and excluding the alias phenomena which however are avoided by the insertion of the low-pass filter). Moreover, we observed that, simultaneously applying various electromagnetic threats, the effects of these disturbances combine in an approximately linear way. Therefore, for whatever input signal, if it is known, it is possible to quantify the consequences produced by the actual electromagnetic conditions. It is clear that the more accurate and less expensive signal to use in order to perform the test is a 0 V DC signal.
It is enough, therefore, to close the measurement chain in short circuit and, by means of a time and/or frequency analysis, it is possible to evaluate if and how the real electromagnetic disturbances alter the offset, TSD and SNR values. Starting from this data and applying the method suggested in [20], we can estimate the actual measurement uncertainty and we can easily decide if, considering the target uncertainty, the considered instrument can still be adequately used in the electromagnetic environment where is performing the measurement.
If possible, better results can be obtained closing the measurement chain in an impedance equal to the one of measurement point.
In the cases of steady disturbances and if their effects are not within the bandwidth of interest of the measurement, it is possible to implement, into the software part of the instruments, algorithms to compensate for the disturbance effects.
IV. VALIDATION
In order to validate the proposed approach, we performed various measurements in locations where heavy, but unknown, electromagnetic disturbances were present.
Let us consider the AI 16XE10-50 data acquisition board inserted in the notebook with a not-shielded configuration operating in the nearness of a voltage source inverter working in steady conditions.
By means of this board, we build a system for DC, RMS and THD value measurement of a distorted 50 Hz voltage signal with the characteristics reported in row II of table II.
TABLE II. MEAN VALUES OF THE MEASURES PERFORMED NEARBY THE INVERTER

The signal is generated by the Agilent 33120A. The measurement is performed in differential mode, setting the gain to 1, sampling at 100 KS/s and choosing a 100 ms time window.
Before performing the measurements, we short circuited the measurement chain and we performed a frequency analysis, which is reported in fig.1.
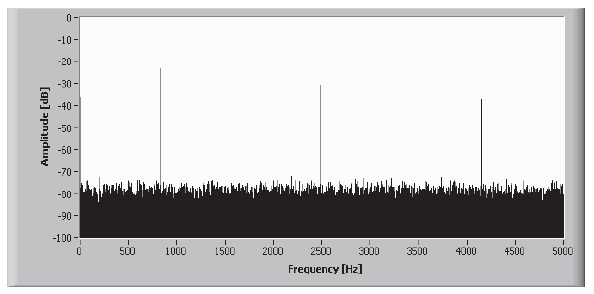
The analysis show that the inverter is producing a visible interference with the system, generating a 15.5 mV DC component; a 831 Hz component and its III and V order harmonics. For the measurement at issue, these components will not alter the measured THD value, but will alter the measured RMS and DC value. Performing the measurement, in fact, we get the values reported in row III of tab. II (all the reported values are the means of 50 measurements).
Filtering the disturbance components and subtracting the DC value measured during the test, it is possible to correct the results, obtaining the data reported in row IV of tab. II.
In order to validate the used approach, we repeated the measurement turning off the voltage inverter, obtaining the values reported in row V of tab. II.
For this measurement, therefore, the impact of the voltage source inverter can be practically removed by implementing the appropriate compensation algorithm and the system can be safely used even with a not-shielded configuration.
Repeating the measurement with a full-shielded configuration and without the compensation algorithm, the inverter impact is almost completely negligible; in fact we obtained the value reported in row VI of tab. II.
The results obtained with the last experiment ensure that the electromagnetic disturbance has no effect on the signal generator.
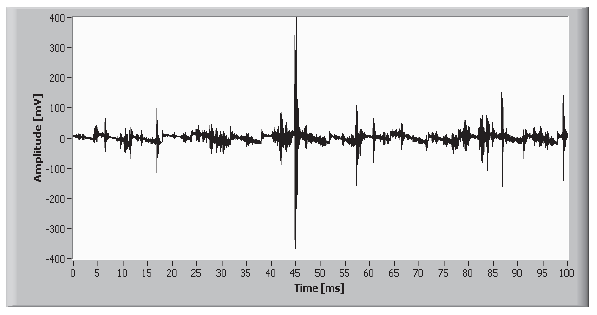
We repeated the same measurement in the proximity of a 15 kVA welding machine. Before performing the measurements, we short circuited the measurement chain and we carried out a time and frequency analysis, which are respectively reported in fig.2 and in fig.3.
nearness of the welding machine

nearness of the welding machine
In this case, the electromagnetic disturbance produces a heavy and not steady interference with the instrument and therefore the repeatability of the measurement get worse. Moreover, the disturbance effect occupies the bandwidth of interest and therefore, in these electromagnetic environment conditions, it is not possible to correct the disturbance impact.
In table III the mean values and the standard deviations of 50 measurements are reported.
TABLE III. MEAN VALUES AND STANDARD DEVIATIONS OF THE MEASURES PERFORMED IN THE NEARNESS OF THE WELDING MACHINE USING THE NOT-SHIELDED CONFIGURATION

The same measurement was performed by using a full-shielded configuration and, in this case, the impact of the electromagnetic disturbance is greatly reduced (table IV).
TABLE IV. MEAN VALUES AND STANDARD DEVIATIONS OF THE MEASURES PERFORMED IN THE NEARNESS OF THE WELDING MACHINE USING THE SHIELDED CONFIGURATION

In this case, even though it is not possible to correct the disturbance effects and even though these effects are quite heavy, a good shielding allows a correct employment of the system.
Also the not-shielded configuration can be used if the uncertainty target is compatible with the uncertainty enhancement caused by the electromagnetic threat. To assess this enhancement, let’s consider that, on the average, the considered electromagnetic disturbance causes a 4 mV offset expansion and a 9 dB SNR reduction. Starting from this information and applying the method suggested in [20], it is possible to estimate the actual combined uncertainty.
The proposed approach can be easily extended to more complex measurement chains, such as when transducers and signal conditioning accessories are connected to a data acquisition board. Also in these cases, after having closed the measurement chain in short circuit, a time and/or frequency analysis allows to evaluate if and how much the actual electromagnetic disturbances can distort the measurement results.
For instance, let us consider the same board used in the previous examples. In order to perform a 230 V 50 Hz feed voltage RMS measurement in an industrial location where various welding machines and other metallurgic devices were operating, we connected to the board the differential high voltage probe Tektronics P5200 through an ad-hoc built IV order antialias filter with a 4 kHz cut-off frequency. The measurement is performed in differential mode, setting the probe attenuation ratio to 50 and the board gain to 1, sampling at 10 KS/s and choosing a 1 s time window. Let the standard uncertainty target be 0.5 %. Without electromagnetic disturbances, the instrument is safely capable to achieve this uncertainty. In order to evaluate the disturbance impact, before performing the measurements, we short circuited the measurement chain and we carried out a time analysis, which is reported in fig.4.
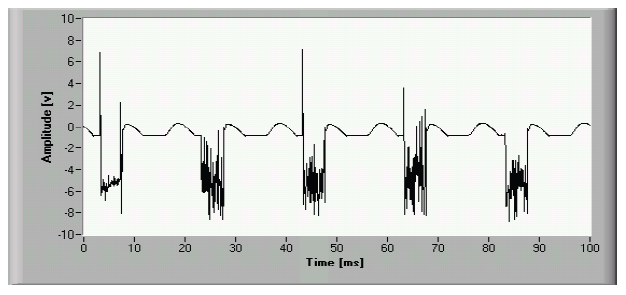
The electromagnetic disturbances produce a heavy interference with the measurement instrument, which causes a 2.4 V RMS noise; since their effects occupy the bandwidth of interest of the measurement at issue, it is not possible to correct the disturbance impact. Since this noise cause a 14 dB SNR reduction, as a consequence, in the described electromagnetic environment the uncertainty target cannot be reached.
The experiments performed both under standardized disturbances and under unknown disturbances have shown that the full-shielded configurations of measurement systems are practically immune to the electromagnetic interferences. Even the heaviest radiated and conducted emissions cause a negligible impact if the good practices of shielded are observed.
However a full-shielded configuration of the whole measurement chain is quite expensive, since it is necessary to employ quite costly cables and connector boxes and the measurement shell be performed by skilled personnel.
We are investigating the chance to safely use the not-shielded configurations in a hostile electromagnetic environment, by the implementation of a procedure which allows the compensation of the disturbance effects.
The basic idea is established on a two channel acquisition technique. The measurement signal is sent to the first channel and, simultaneously, to the second channel, but with inverse polarity; the cable paths are arranged in a manner that the electromagnetic emissions induce the same effects on the two channels. Adding and dividing by two, via software, the data acquired by the two channels, we should obtain the measurement signal without the effect of the electromagnetic disturbances.
We are performing various tests to validate this technique and the first results are encouraging [25].
V. CONCLUSIONS
Starting from the experimental results obtained subjecting various configuration of systems to the electromagnetic disturbances prescribed in the IEC-61236 standard, in the paper we defined and proposed a simple and fast procedure to assess the actual impact of unknown electromagnetic disturbances on a measurement system for the electric power quality evaluation.
By means of this approach, it is possible to quantify the electromagnetic environment interference with the measurement systems and, therefore, to decide if the actual shielding conditions are adequate for the measurement purposes.
The application of this procedure has shown that the well-shielded configurations are virtually immune also to heavy disturbances.
As for the not-shielded configurations, the procedure allows the measurement correction when the measured typology is known and the disturbance effects are steady and not within the bandwidth of interest.
ACKNOWLEDGMENT This publication was partially supported by the PON04a2_H “i-NEXT” and PON01_02422 “SNIFF – Sensor Network Infrastructure For Factors” Italian research programs. This work was realized with SDESLab – University of Palermo.
REFERENCES
[1] G. Cipriani, G. Ciulla, V. Di Dio, D. La Cascia, and R. Miceli, “A device for PV modules I-V characteristic detection,” in Clean Electrical Power: Renewable Energy Resources Impact, 2013. ICCEP ’13. International Conference on, 2013.
[2] V. Di Dio, G. Cipriani, D. La Cascia, and R. Miceli, “Design, Sizing and Set Up of a Specific Low Cost Electronic Load for PV Modules Characterization,” in Ecological Vehicles and Renewable Energies (EVER), International Conference & Exhibition on, 2013.
[3] A. Ando, S. Mangione, L. Curcio, S. Stivala, G. Garbo, A. Busacca, G. M. T. Beleffi, and F. S. Marzano, “Rateless codes performance tests on terrestrial FSO time-correlated channel model,” in 2012 International Workshop on Optical Wireless Communications, IWOW 2012, 2012.
[4] A. C. Busacca, S. Stivala, L. Curcio, and G. Assanto, “Parametric conversion in micrometer and submicrometer structured ferroelectric crystals by surface poling,” International Journal of Optics, vol. 2012, 2012.
[5] M. Cherchi, S. Bivona, A. C. Cino, A. Busacca, and R. Oliveri, “Universal Charts for Optical Difference Frequency Generation in the Terahertz Domain,” IEEE Journal of Quantum Electronics, vol. 46, pp. 1009–1013, 2010.
[6] A. O. Di Tommaso, F. Filippetti, Y. Gritli, F., R. Miceli, and C. Spataro, “Double Squirrel Cage Induction Motors: a New Approach to Detect Rotor Bar Failures,” in 19th IMEKO TC 4 Symposium and 17th IWADC Workshop Advances in Instrumentation and Sensors Interoperability, 2013.
[7] A. O. Di Tommaso, F. Genduso, R. Miceli, and C. Spataro, “Voltage Source Inverters: an Easy Approach for Fast Fault Detection,” in 19th IMEKO TC 4 Symposium and 17th IWADC Workshop Advances in Instrumentation and Sensors Interoperability, 2013.
[8] G. Cipriani, V. Di Dio, D. La Manna, F. Massaro, R. Miceli, and G. Zizzo, “Economic Analysis on Dynamic Photovoltaic Systems in New Italian ‘Feed in Tariffs’ Context,” in Clean Electrical Power: Renewable Energy Resources Impact, 2013. ICCEP ’13. International Conference on, 2013.
[9] G. Cipriani, V. Di Dio, L. P. Di Noia, F. Genduso, D. La Cascia, R. Miceli, and R. Rizzo, “A PV Plant Simulator for Testing MPPT Techniques,” in Clean Electrical Power: Renewable Energy Resources Impact, 2013. ICCEP ’13. International Conference on, 2013.
[10] V. Di Dio, R. Miceli, C. Rando, and G. Zizzo, “Dynamics photovoltaic generators: Technical aspects and economical valuation,” in Power Electronics Electrical Drives Automation and Motion (SPEEDAM), 2010 International Symposium on, 2010, pp. 635–640.
[11] Boscaino, V., Pellitteri, F., Rosa, L., & Capponi, G. (2013). Wireless battery chargers for portable applications: design and test of a high efficiency power receiver. IET Power Electronics, 6(1), 20-29.
[12] V. Boscaino, R. Miceli, and G. Capponi,, MATLAB-based simulator of a 5 kW fuel cell for power electronics design, International Journal of Hydrogen Energy, Volume 38, Issue 19, 27 June 2013, Pages 7924-7934, ISSN 0360-3199
[13] V. Boscaino, R. Miceli, and G. Capponi, “A semi-empirical multipurpose steady-state model of a fuel cell for household appliances,” Proceedings of the International Conference on Clean Electrical Power: Renewable Energy Resources Impact, ICCEP 2013, 2013, pp. 1–6.
[14] V. Boscaino, P. Livreri, F. Marino, M. Minieri, Current-sensing technique for current-mode controlled voltage regulator modules, Microelectronics Journal, Volume 39, Issue 12, December 2008, Pages 1852-1859, ISSN 0026-2692.
[15] S. Caldara, S. Nuccio, and C. Spataro, “A virtual instrument for measurement of flicker,” IEEE Transactions on Instrumentation and Measurement, vol. 47, pp. 1155–1158, 1998.
[16] A. Cataliotti, V. Cosentino, D. Di Cara, A. Lipari, S. Nuccio, and C. Spataro, “A PC-based wattmeter for accurate measurements in sinusoidal and distorted conditions: Setup and experimental characterization,” IEEE Transactions on Instrumentation and Measurement, vol. 61, pp. 1426–1434, 2012.
[17] A. Cataliotti, V. Cosentino, D. Di Cara, A. Lipari, S. Nuccio, and C. Spataro, “A PC-based wattmeter for high accuracy power measurements,” in 2010 IEEE International Instrumentation and Measurement Technology Conference, I2MTC 2010 – Proceedings, 2010, pp. 1453–1458.
[18] S. Nuccio and C. Spataro, “Uncertainty management in the measurements performed by means of virtual instruments,” in AMUEM 2008 – IEEE Workshop on Advanced Methods for Uncertainty Estimation Measurement Proceedings, 2008, pp. 40–45.
[19] C. Spataro, “ADC based measurements: A common basis for the uncertainty estimation,” in 17th Symposium IMEKO TC4 – Measurement of Electrical Quantities, 15th International Workshop on ADC Modelling and Testing, and 3rd Symposium IMEKO TC19 – Environmental Measurements, 2010, pp. 389–393.
[20] C. Spataro, “ADC based measurements: Identification of the parameters for the uncertainty evaluation,” in 2009 IEEE International Workshop on Advanced Methods for Uncertainty Estimation in Measurement, AMUEM 2009, 2009, pp. 80–84.
[21] IEC 61326 “Electrical equipment for measurement, control and laboratory use – EMC requirements”, 2002.
[22] S. Nuccio, C. Spataro, and G. Tinè, “Immunity of a virtual instrument to radiated electromagnetic disturbances,” in Conference Record – IEEE Instrumentation and Measurement Technology Conference, 2003, vol. 1, pp. 780–784
[23] S. Nuccio, C. Spataro, and G. Tinè, “Immunity of a virtual instrument to conducted electromagnetic disturbances,” in Conference Record – IEEE Instrumentation and Measurement Technology Conference, 2004, vol. 3, pp. 1886–1890.
[24] IEC 61000-4-Series “Electromagnetic compatibility (EMC) – Part 4: Testing and measurement techniques”.
[25] S. Nuccio, C. Spataro, and G. Tinè, “Virtual instruments: Uncertainty evaluation in the presence of unknown electromagnetic interferences,” in AMUEM 2008 – IEEE Workshop on Advanced Methods for Uncertainty Estimation Measurement Proceedings, 2008, pp. 56–61.
Source: International Conference on Renewable Energy Research and Applications (ICRERA). Madrid, Spain, 20-23 October 2013.
