Published by Igor PETROVIĆ1, Zdenko ŠIMIĆ2, Mario VRAŽIĆ2,
Technical College in Bjelovar (1), University of Zagreb, Faculty of Electrical Engineering and Computing (2)
Abstract. The object of this research is to compare three of the most popular conventional analytical models used for estimation of electrical energy production of photovoltaic panels. From this analysis a single model will be selected with the best characteristics for implementation of modifications and corrections in order to get better energy production prediction results. Monthly and annual production results and errors will be the main criteria for the selection of a single model. Single prediction results of the selected model should be as accurate as possible in the smallest time periods, which are in this case monthly energy prediction results. This should guarantee that annual results are also rather accurate.
Streszczenie. W artykule porównano trzy modele analityczne umożliwiające analizę energii elektrycznej wytwarzanej przez panele fotowoltaiczne. Analizuje się miesięczną i roczną produkcję energii na podstawie wybranych okresów czasowych. (Porównanie metod przewidywania produkcji enegii przez panele fotowoltaiczne)
Keywords: PV plant, conventional analytical model, electrical energy production.
Słowa kluczowe: ogniwa fotowoltaiczne, prognozowanie produkcji energii
Introduction
Accuracy of conventional analytical models used for estimation of electrical energy production of photovoltaic panels and systems is the main characteristic that determines tool expediency. Conventional analytical models are mathematical methods which use theoretical values and estimated relations between energy production and hydrological conditions in the surroundings of the production system ([1], [2]). These assumptions are made on perennial average values for a specific location. In average cases, error estimation from the modelled values and specific annual production can drop over 10%. The main task of this research is to take results of the conventional analytical model from the actual measured input data for a specific location (solar radiation and temperature) and compare them ([3], [4], [5], [6]) with the real measured energy production. One will be able to use the analysis of these results to implement corrections in order to improve conventional analytical model results towards the real measured values ([7], [8]). Conventional analytical model energy production estimations are made for a commercial photovoltaic energy plant, which has measuring data bases for a whole year. The selected tools are three of the most popular software tools: the Homer, the PVSYST and the PVGIS. The same set of data is used for all three production estimations, which is calculated from the measured values in the database of the PV plant.
Approach to PV plant energy generation prediction
It can be assumed that by predicting only radiation and temperature, energy production prediction for a PV plant can be made inside a certain error span ([9], [10]). Errors are determined by a range of conditions that are neglected in the specific analytical model. Other data come from construction characteristics of the PV plant, which in this case cannot be altered since the PV plant is already built and running. Data for determining the subject PV plant and conventional analytical models are presented in the following sections.
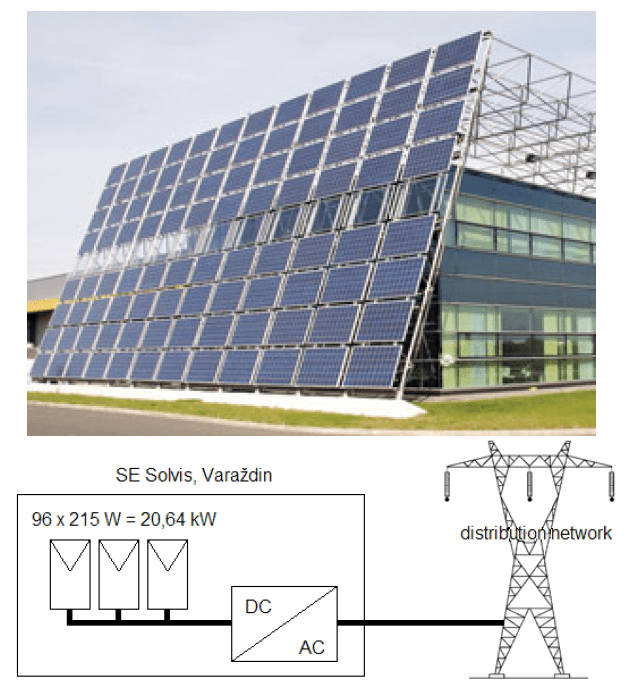
The Solvis SE PV plant (Fig.1) is located in Varaždin in the north of Croatia, with geographical coordinates 16.3245° east and 46.3245° north and elevation of 170 m. The climate is temperate continental. The PV plant consists of 96 PV modules with 215 W of electrical power, which are installed in a fixed mode and connected to the commercial electrical energy distribution network. Efficiency of the DC/AC inverter is 96%. The PV plant DC power is 20.64 kWmpp defined for 1000 W/m² irradiance on the PV modules surface and temperature of 25°C. The PV plant orientation is not optimal. The azimuth is set to 0° (south) and inclination to 70°. The albedo is estimated as 0.26.
The real electrical energy production is measured and the results are written in the PV plant database. The measured values consist of data from the PV system, grid consumption and physical data from the surroundings such as global horizontal irradiance and ambient temperature. The available measurement time period was from 1 March 2011 to 7 March 2012 and represents a whole year. The used data necessary for analysis of conventional analytical model of energy production prediction are presented in Table 1.
The software solutions for calculating energy production are most used tools in PV plant planning. The mathematical model of the PV module in ambient conditions describes the real state of the PV plant which is expected at a selected location. This description consists of various parameters which include some estimated values for defining the PV plant energy production. Ambient influence models affect the PV modules energy production results for average or specific input data. The most common professional software solutions for predicting PV plant energy production are the Homer ([11], [12], [13], [14]), the PVSYST ([15]) and the PVGIS ([3]). The installation mode in this research is set to fixed installation. The input hydrological data for the specific location can be calculated from the PV plant database. An average day cumulative daily irradiances and average monthly temperatures were used as input data in the software tools.
Table 1. Featured measured values of the Solvis SE
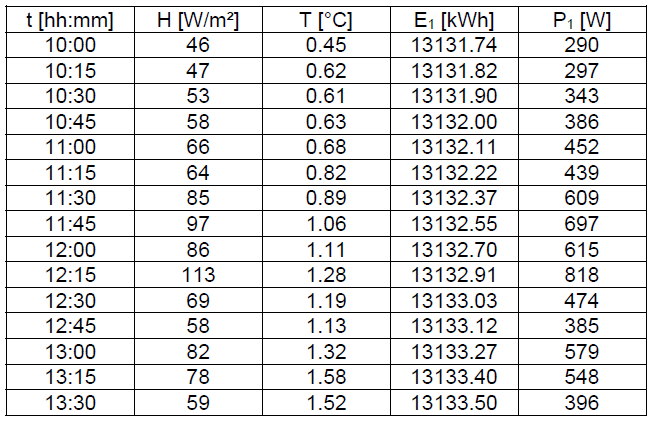
t – time of data acquisition
H – global radiation on horizontal plane
T – ambient temperature
Ex – cumulative energy production by xth inverter
Px – electrical power of xth invert
The used models calculate final energy production by using different algorithms. The Homer calculates energy in two steps based on input data for average irradiation and temperature. In the first step synthetic hourly data are calculated from an average day cumulative daily irradiances and average monthly temperatures. The Liu-Jordan-Klein model is used for transferring the global horizontal irradiance onto the sloped surface. In the second step the PV plant electrical power is modelled from the sloped surface irradiance and ambient temperature. A selection of most common PV modules, inverters and batteries is available in Homer’s equipment catalogue. Produced energy is calculated on the basis of cumulative hourly electrical power. The PVSYST model uses the same input data sets as the Homer model. A transposition model is used for calculating the effective irradiation on the sloped surface from estimated global, diffuse and reflected components of irradiation. The PVSYST offers a selection of two transposition models: the Hay’s model or the Perez model. The Hay’s model is robust and does not require the exact value of diffuse irradiance. The Perez model is more sophisticated, but needs quality data measured on a horizontal surface. Every component is separately calculated with a transposition model. These calculations are made on synthetic hourly data for a clear sky average day of the month. The errors which occur in such calculations are also dependent on azimuth and inclination of the PV modules. Average errors are all in range from 1.1% (maximum for 0° of azimuth and 0° of inclination) to 11 % maximum for ±90° of azimuth and 90° of inclination. The PVGIS is a very empirical model developed for European locations. The input data is irradiance which is developed from the database for Europe. R.sun and s.vol.rst models are used for interpolation. The algorithm consists of estimation for direct, diffuse and reflected irradiation components for the clear sky, and also global real irradiance on a horizontal or sloped surface. Irradiation is calculated by integrating hourly irradiance. Databases have measured data for daily global irradiation for horizontal and sloped surfaces (15°, 25° and 40°). Also, raster maps of 1x1km cell resolution with clear sky irradiation, linke turbidity and ratio of diffuse to global irradiance are computed. The main source of data is presented in the European Solar Radiation Atlas. The albedo used in PVGIS is constant and equal to 0.15. Energy production is estimated from history data of power production measured on PV stations across Europe, installed with inclinations of 15°, 25°, 40° and 90°. Therefore, it should be noted that classic PVGIS model can only generate results based on the measured data, and has a very small modelling contribution.
Analysis of PV plant energy generation prediction for conventional analytical models
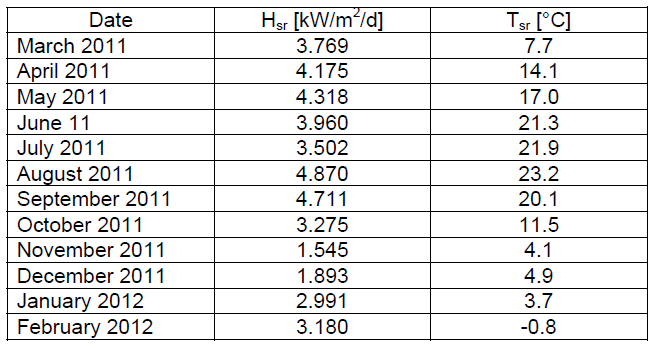
The input data for modelling of PV plant energy generation with conventional analytical models are generated from the PV plant database. The input values are presented in Table 2 for each month from March 2011 till February 2012.
Table 2. Input data for the Solvis SE in Homer model
A comparison of conventional analytical models and measured results is presented in Fig. 2. The presented measured data were acquired from March 2011 to March 2012, and represent a whole year. For better visual interpretation of results January and February 2012 values are moved in front of the 2011 measured values, although they were recorded in 2012.
It can be seen that most of monthly modelled results have significant errors. In most cases the modelled results are also somewhat different from each other. Monthly errors for conventional analytical model results are presented in Fig. 3. All results were compared with measured energy generation results.
Monthly energy production model errors are presented for each model regarding the measured values. The PVGIS result errors generally underestimate energy production. These results are expected considering the empirical modelling which is affected by the used equipment. The equipment used for the selected PV plant is not used in the PVGIS model. The PVSYST and the Homer monthly errors are rather significant in some months, but they also oscillate around zero during the one year period. The Homer model results have five monthly absolute result errors smaller than 500 kWh, while the PVSYST has only two months in that range. Therefore, it can be concluded that synthetic modelling of hourly data used by the Homer is more accurate than the one used in the PVSYST model. While the PVGIS calculates energy production results from empirical data, the Homer and the PVSYST model use synthetic hourly data from monthly averages. In the synthetic data temperature values are used as a constant for every hour, and have a value of monthly average. Modelling factors are also calculated from average annual data. Errors are partly caused by the measured period which was not close to annual averages.
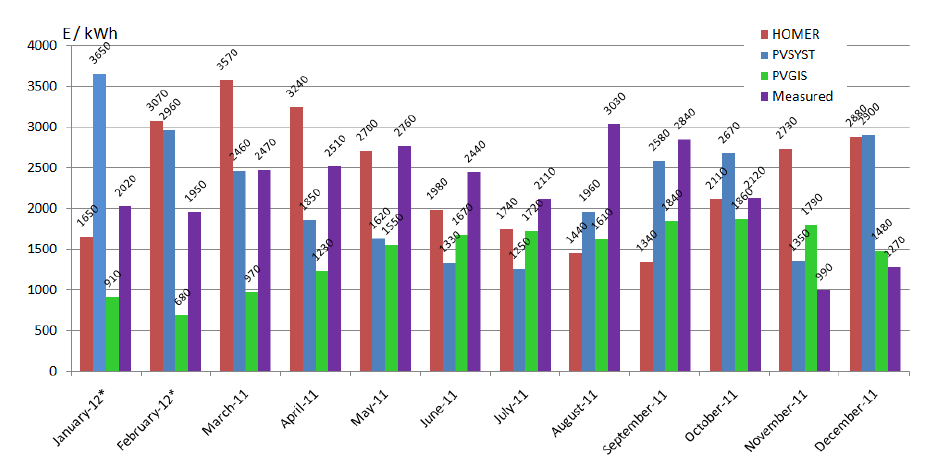
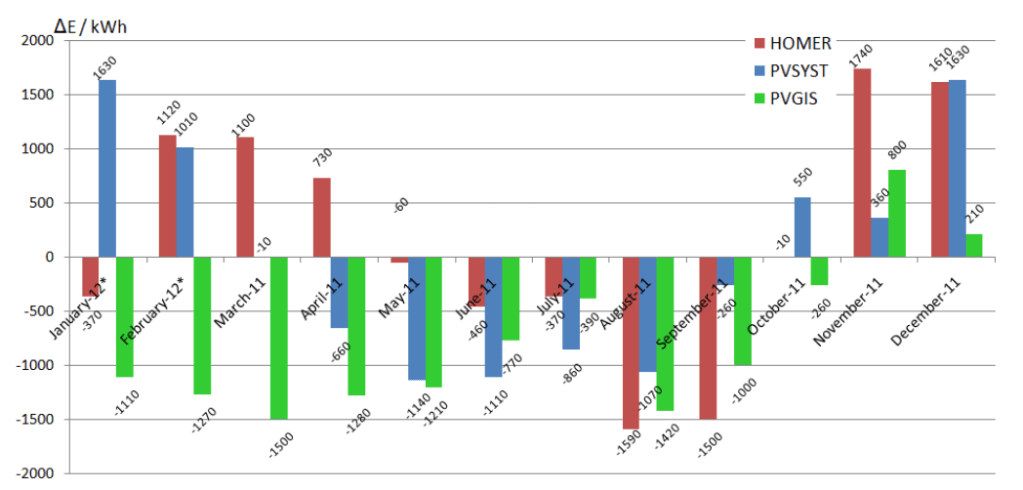
Table 3. Annual energy generation for the Solvis SE
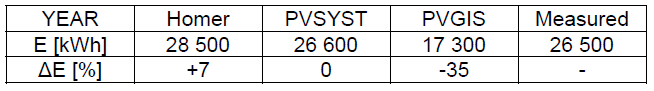
Cumulative annual energy results for the Homer, the PVSYST, the PVGIS and the measured results are presented in Table 3. Relative energy production errors are also presented in comparison with the measured energy of the PV plant. The greatest annual energy production error is the one made by the PVGIS model. The PVSYST model has annual energy production error under 1% and is the most accurate. The Homer annual result is also rather accurate in comparison with the PVGIS model result. Therefore, it can be concluded that the Homer and the PVSYST models predict annual energy production with the acceptable level of precision.
Conclusion
A comparison of each model with the measured monthly results shows that all models can have significant monthly and/or annual errors in energy production estimation. While the PVSYST and the PVGIS both have multiple monthly errors over 100% of the measured energy production in a given month, the Homer never exceeds that percentage of error for each month in the given year. It can also be seen that all model calculations for warm weather are lower than real energy production, while in cold weather model results are always higher than real energy production. The PVSYST calculated the most accurate annual results, while the Homer and the PVGIS have some errors. When all of these characteristics combine, the Homer proves to be a rather good model with some deficiency which must be considered. The Homer model has been selected for implementation of corrections that will result in better hourly predictions based on its single monthly predictions. These corrections should finally result in better daily, monthly and annual energy production predictions.
REFERENCES
[1] R. Chenni, M. Makhlouf, T. Kerbache, A. Bouzid: A detailed modeling method for photovoltaic cells, Energy 32 (2007), pages 1724–1730
[2] T. Kerekes, E. Koutroulis, S. Eyigün, R. Teodorescu, M. Katsanevakis, D. Sera: A Practical Optimization Method for Designing Large PV Plants, ISIE 2011, 2011 IEEE International Symposium in Industrial Electronics, Poland, 27-30 june 2011, pages 2051 – 2056
[3] André Coelho, Rui Castro: Sun Tracking PV Power Plants: Experimental Validation of Irradiance and Power Output Prediction Models, International journal of Renewable energy research, Vol.2, No.1, 2012
[4] Ahmet Senpinar, Mehmet Cebeci: Evaluation of power output for fixed and two-axis tracking Pvarrays; Energy 92, Elsevier Ltd., 2012, pages 677-685
[5] Steve R. Best, Julie A. Rodiek, Henry W. Brandhorst Jr.: Comparison of solar modeling data to actual pv installations: power predictions and optimal tilt angles, 37th IEEE Photovoltaic Specialists Conference (PVSC), 2011, pages 1994-1999
[6] Ali Naci Celik, Nasır Acikgoz: Modelling and experimental verification of the operating current of mono-crystalline photovoltaic modules using four- and five-parameter models, Applied Energy 84, 2007, pages 1 – 15
[7] E. Kymakis, S. Kalykakis, T. M. Papazoglou: A photovltaic park’s performance on the island of Crete, Energija 57 (2008), Nr. 3, pages 300-311
[8] Francisco Javier Gómez-Gil, Xiaoting Wang, Allen Barnett: Energy production of photovoltaic systems: Fixed, tracking, and concentrating, Renewable and Sustainable Energy Reviews 16, Elsevier Ltd., 2012, pages 306– 313
[9] R. Pašičko, Č. Branković, Z. Šimić: Assessment of Climate Change Impacts on Energy Generation from Renewable Sources in Croatia, Generation from RES Croatia, Renewable Energy. 46 (2012) , October 2012; pages 224-231
[10] Matic Z.: Solar radiation in Republic of Croatia, Croatian Energy Institute ‘‘Hrvoje Pozar’’, Zagreb, 2005
[11] Mohammad Saad Alam, David W. Gao: Modeling and Analysis of a Wind/PV/Fuel Cell Hybrid Power System in HOMER, Industrial Electronics and Applications, 2007. ICIEA 2007, Second IEEE Conference on Industrial Electronics and Applications 2007, pages 1594 – 1599
[12] Nurul Arina bte Abdull Razak, Muhammad Murtadha bin Othman, Ismail Musirin: Optimal Sizing and Operational Strategy of Hybrid Renewable Energy System Using HOMER, The 4th International Power Engineering and Optimization Conf. (PEOCO2010), Shah Alam, Selangor, MALAYSIA: 23-24 June 2010, pages 495 – 501
[13] Kandula Murali Krishna: Optimization Analysis of Microgrid using Homer- A Case Study, India Conference (INDICON), 2011 Annual IEEE 2011, pages 1 – 5
[14] T. Givler and P. Lilienthal: Using HOMER® Software, NREL’s Micropower Optimization Model, to Explore the Role of Gensets in Small Solar Power Systems, Case Study: Sri Lanka, Technical Report, NREL/TP-710-36774, May 2005.
[15] Sun Jianping: An optimum layout scheme for photovoltaic cell arrays using PVSYST, International Conference on Mechatronic Science, Electric Engineering and Computer, August 19-22, 2011, Jilin, China, pages 243 – 245
Authors: Igor Petrović, B.Sc., Technical college in Bjelovar, Trg Eugena Kvaternika 4, 43000 Bjelovar, Croatia, E-mail: ygor.petrovic@gmail.com; prof. dr. sc. Zdenko Šimić, University of Zagreb, Faculty of Electrical Engineering and Computing, Unska 3, 10000 Zagreb, E-mail: zdenko.simic@fer.hr; doc. dr. sc. Mario Vražić, University of Zagreb, Faculty of Electrical Engineering and Computing, Unska 3, 10000 Zagreb, E-mail: mario.vrazic@fer.hr.
Source & Publisher Item Identifier: PRZEGLĄD ELEKTROTECHNICZNY, ISSN 0033-2097, R. 89 NR 6/2013
