Published by Electrotek Concepts, Inc., PQSoft Case Study: Transmission System Harmonics Study, Document ID: PQS0501, Date: March 31, 2005.
Abstract: A utility presently operates two 16.8 MVAr capacitor banks in a 161/69kV substation. Supplied by this substation are residential, commercial, and industrial loads, including a steel manufacturing facility. For increased voltage support, the utility is investigating the installation of three additional 16.8 MVAr, 69kV capacitors to be installed within the substation. Concerns have been raised with regards to the change in resonance as a result of these additional capacitors. The proposed capacitors could result in resonance conditions that could be excited by the locally operated arc furnace, thus possibly producing high levels of voltage distortion at the substation. This case study presents some of the findings associated with a resonance study that included power quality monitoring and harmonic distortion simulations.
INTRODUCTION
The scope of this study is to investigate the impact a capacitor bank has on the harmonic impedance at a utility owned, 69kV substation. The utility presently operates two 16.8 MVAr, 69kV capacitor banks at the substation. Upgrade plans include the installation of three additional 16.8 MVAr banks. For regulation of the 69kV bus voltage, automatic capacitor controls will provide staging of capacitors in 16.8 MVAr increments, from 0 to 84 MVAr. Due to a locally operated arc furnace, there are concerns that the additional capacitance could result in a shift in resonance; thus possibly resulting in overvoltage conditions due to excitation from the arc furnace. Of particular interest is the impact on harmonic distortion levels that result due to the interaction (resonance) between the capacitors and system impedance.
The scope of this harmonic evaluation study includes:
− Frequency Response Evaluation
− Field Measurements
− Harmonic Distortion Evaluation
SYSTEM MODEL DESCRIPTION AND DEVELOPMENT
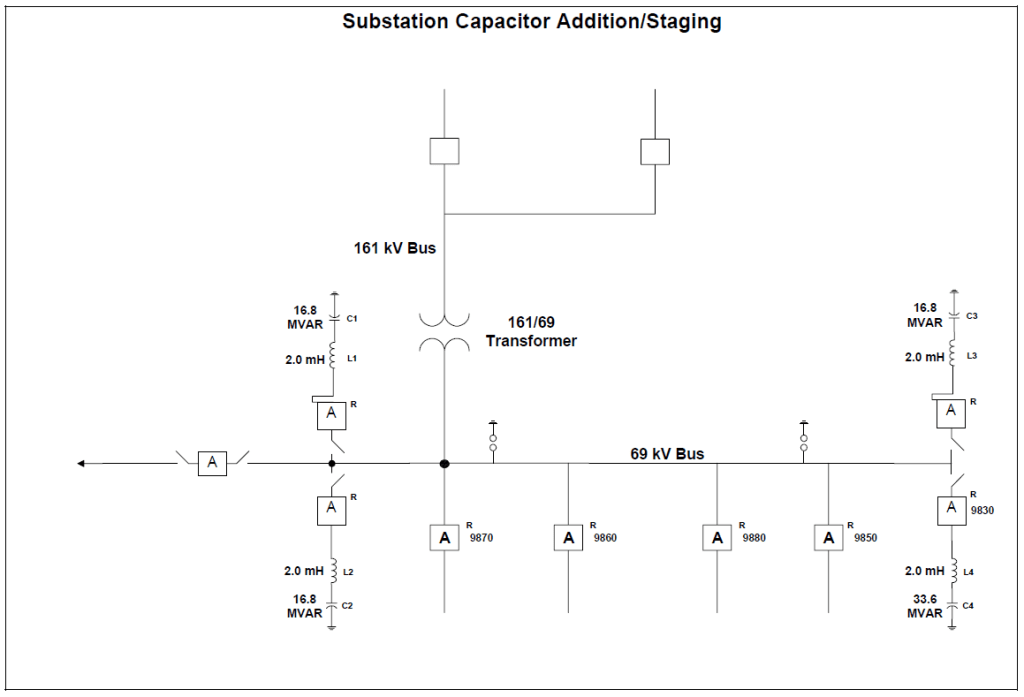
A one-line diagram of the substation and surrounding transmission system is shown in Figure 1 and Figure 2.
The system model was developed using Electrotek’s SuperHarm® program. A three-phase model was used to simplify the analysis of transformer connections on harmonic cancellation. All transmission lines were modeled using a three-phase PI model, thus taking into consideration charging capacitance. Linear load was modeled to provide a realistic amount of system damping. Without these loads, the simulation results would be too conservative, especially at or near system resonance. Transformers were modeled using the SuperHarm three-phase transformer model. Transformer test report data was used when provided, and a default X/R ratio of 20 was used when resistances were not available. A typical capacitance of 16nF/mile was used to represent the charging MVAr of the overhead lines.
Analysis of Resonance Concerns for Harmonics
Frequency scans were performed at the substation to evaluate the affect of different capacitor configurations on system resonance. The scans demonstrate the expected harmonic voltage at the 69kV level per amp of harmonic current injected into the system. A summary of some of these cases is described in this section.
Figure 3 illustrates the affect of staging the substation capacitors (C7) from 16.8 MVAr to 84 MVAr on system resonance. For Case 15 (16.8 MVAr capacitor), a significant amount of resonance occurs between the 7th and 9th harmonic. As additional capacitance is added, this resonance is slightly decreased in magnitude. Unfortunately, this resonance is shifted to lower harmonic values (5th harmonic for Case 17 and 3rd harmonic for Case 19).
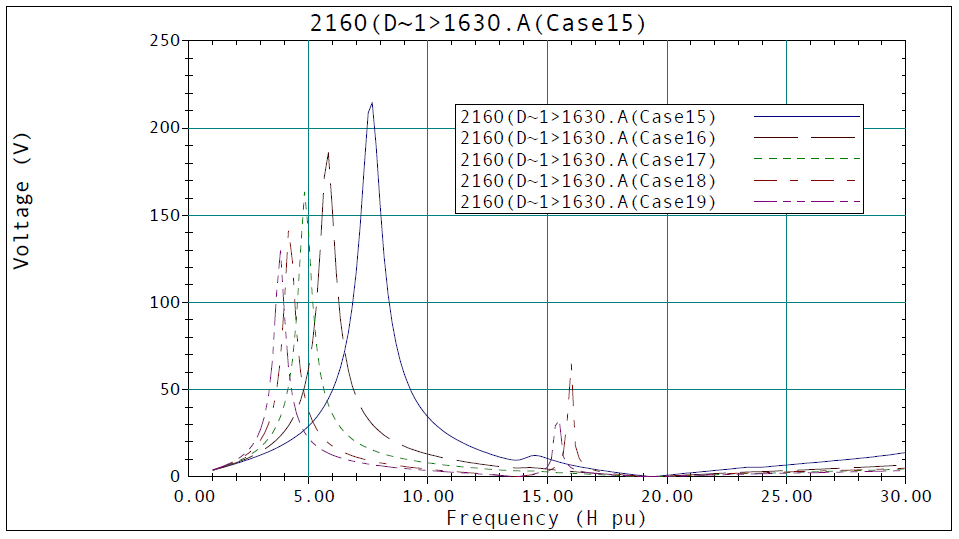
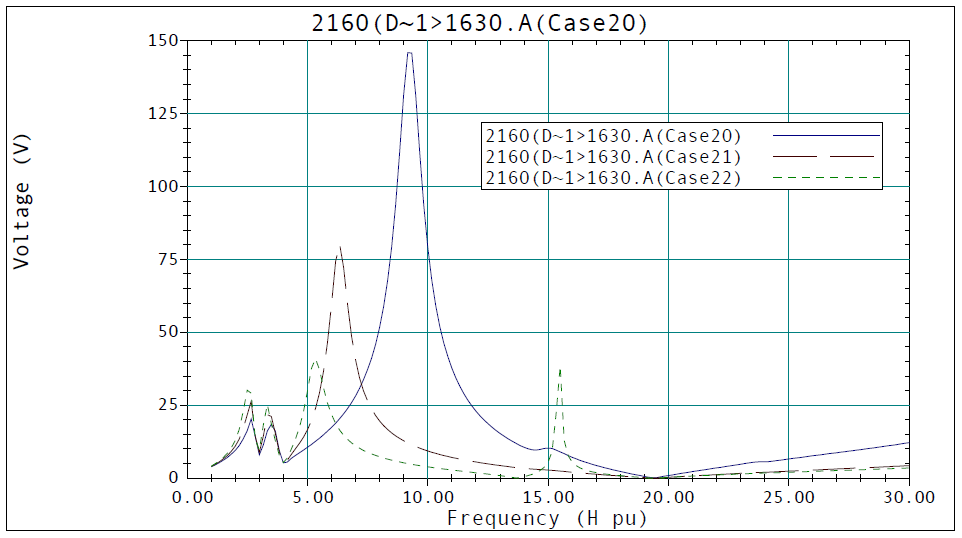
Figure 4 demonstrates the result of 3 levels of capacitance at the substation (C7 – 16.8, 50.4, and 84 MVAr) and capacitor banks C1, C2, C3, C4, and C5. Compared to Figure 3, the overall affect on resonance is a slightly decreased magnitude with a shift to higher harmonics.
The cases shown in Figure 5 are similar to that of Figure 3 with the exception of the added 24.4 MVAr capacitor C6. As illustrated in Figure 5, the interaction of the substation capacitors and C6 have a strong impact on the overall system resonance at the substation. Increased resonance occurs at the 9th harmonic (Case 24) and 10th (Case 23). High levels of resonance also occur between the 3rd and 6th harmonics for all five cases.
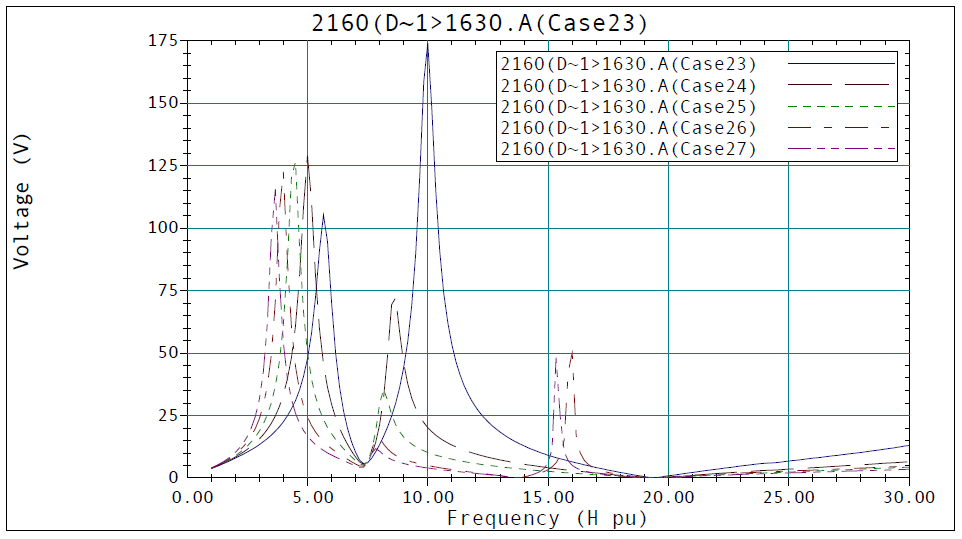
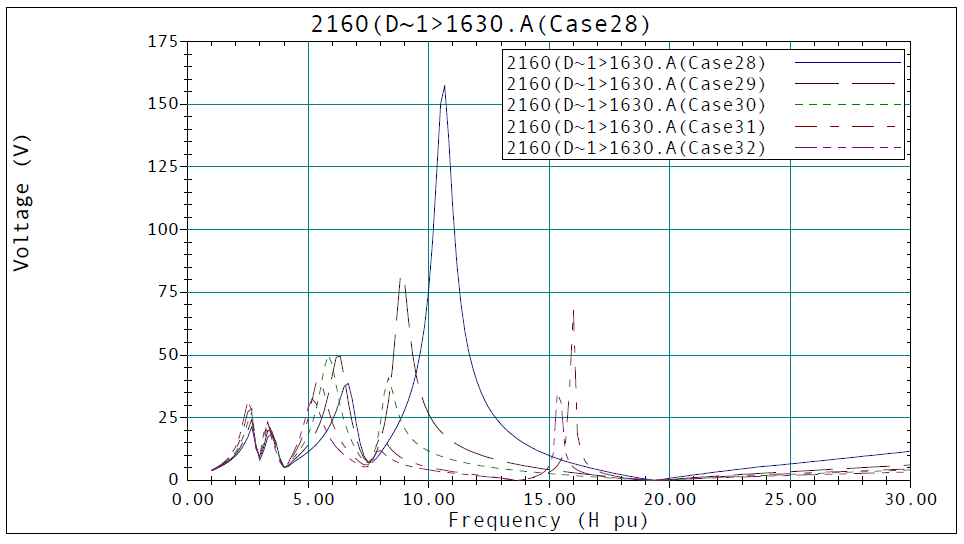
Figure 6 illustrates the affect of total capacitance (all capacitors switched in at the 13.2 kV level and C6) with the substation capacitors varied in 16.8 MVAr stages. The affect of additional capacitors at the 13.2 kV level have an overall positive effect on system resonance by reducing the magnitude of the lower order harmonic resonance considerably (compared to Figure 3 and Figure 5). High resonance conditions, however, do occur at the 11th harmonic (Case 28) and the 9th harmonic (Case 29).
Field Measurements – Power Quality Monitoring
A Dranetz-BMI PQNode 8020 was installed at the substation and power quality data was collected for a period of 30 days. The PQNode monitored three-phase voltage (line-to-line) and current on the 69kV bus supplying the feeder to the arc furnace.
This section will summarize the data collected.
During the 30 day monitoring period, the arc furnace was not fully operational, thus limiting the amount of usable data for statistically characterizing the harmonic content on the feeder. During the first week of monitoring, arc furnace was not operating 100% of the time, and unfortunately, it was switched completely offline for approximately two weeks for routine maintenance, thus limiting the amount of usable data to roughly two weeks.
Figure 7 and Figure 8 illustrate the RMS line current and line-to-line voltage measured on the arc furnace feeder for the 30 day period. The various operating conditions in which the furnace undergoes are most evident in the current measurements.
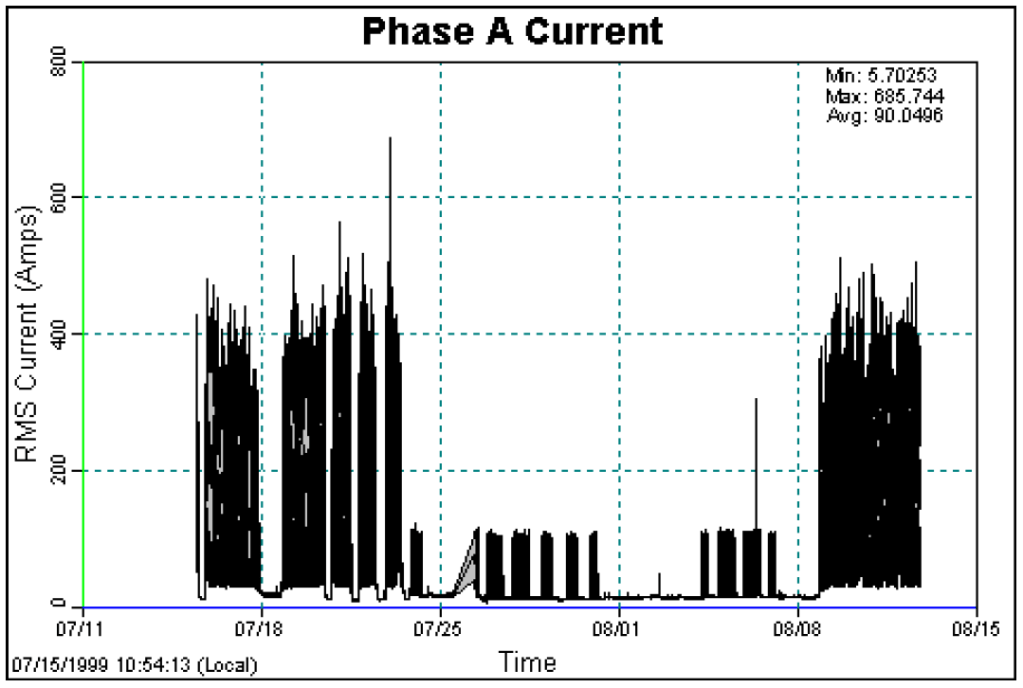
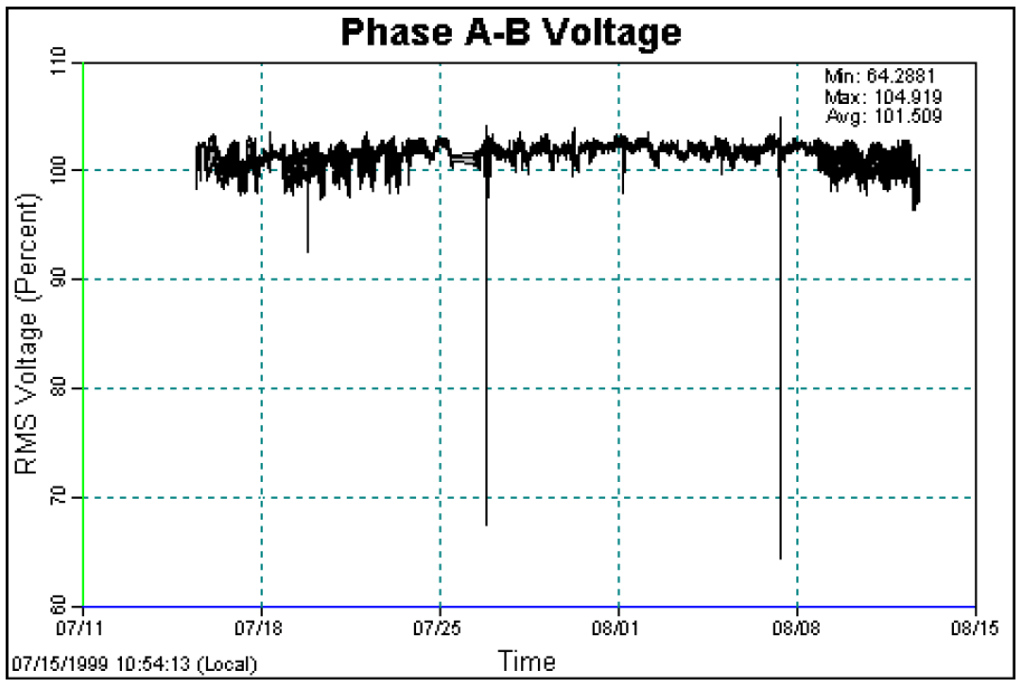
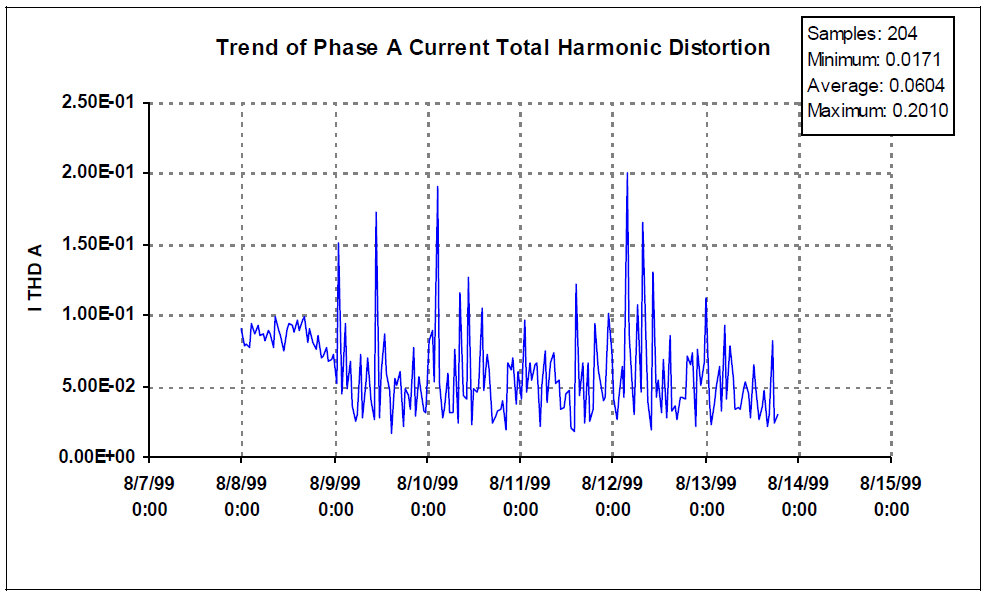
Figure 9 and Figure 10 illustrate the Phase A current THD from 8/8/99 to 8/14/99. Using the Electrotek/EPRI PQView® software, a statistical analysis of the measured data was easily performed with the results shown in Figure 10. These calculations were also performed for both B and C phases.
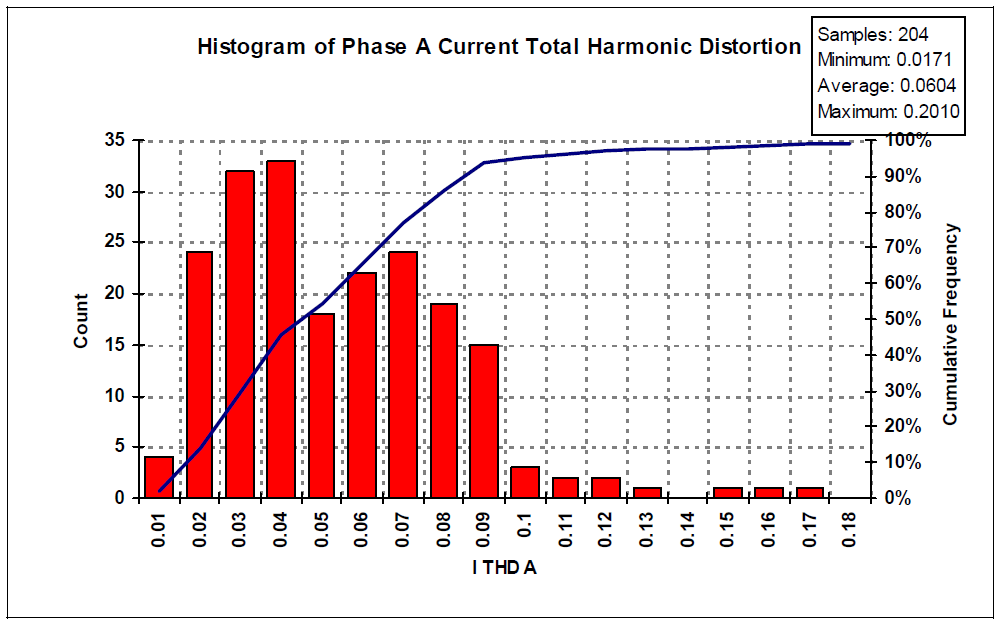
Using the data shown in Figure 10, PQView was used to calculate the average, CP05, and CP95 harmonic current values over this period. The statistical summary for the TDD and harmonics are shown in Figure 11.
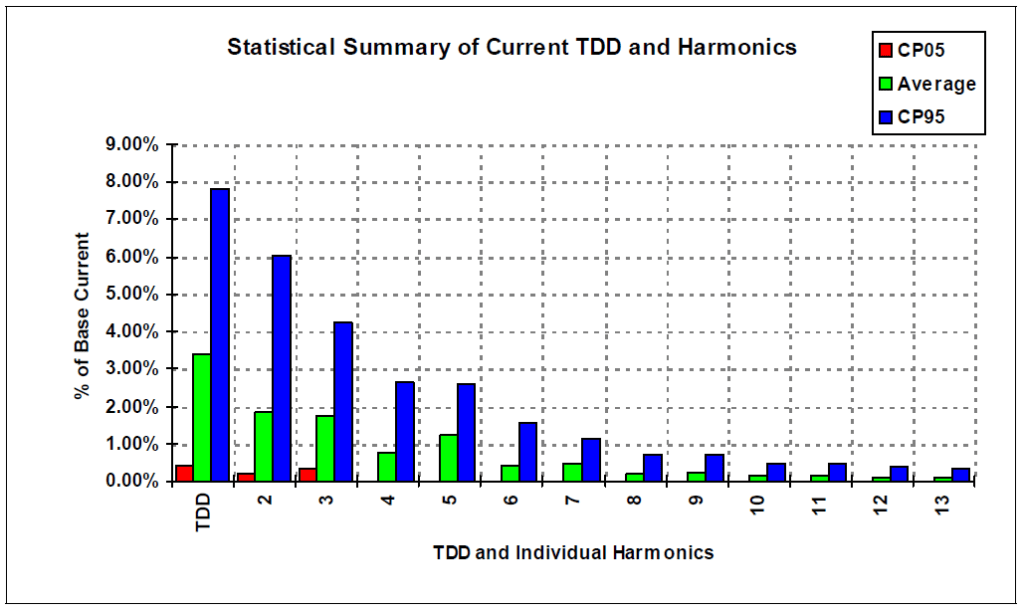
Note: Base Current CP99 – 240A
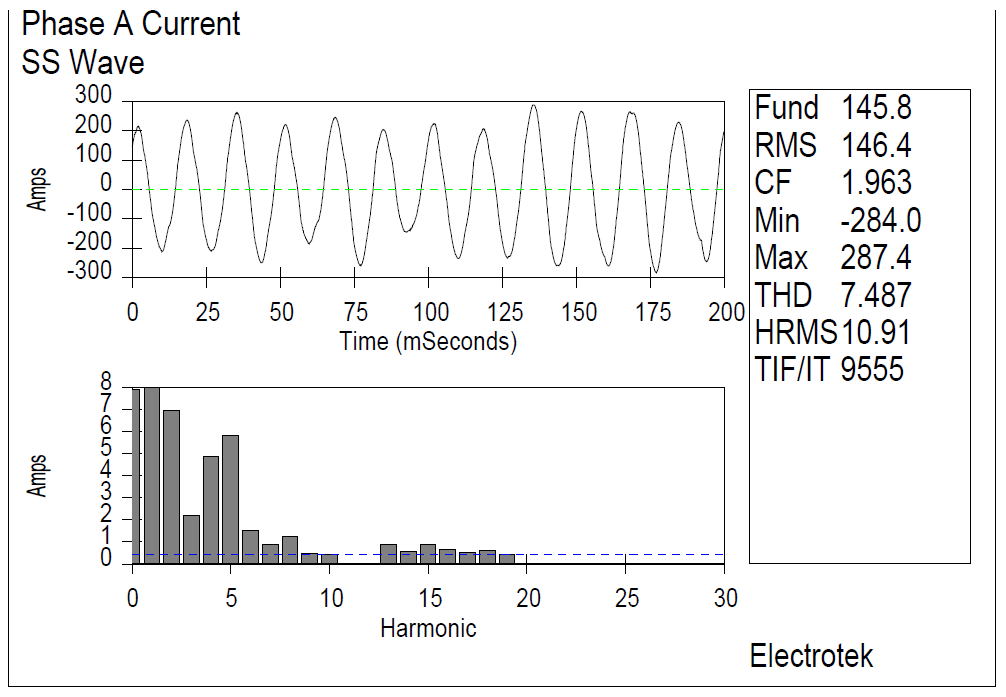
Using the data in Figure 11, a representative current spectrum, shown in Figure 12, was chosen from the 12-cycle samples taken. The fundamental (and corresponding current spectrum) was scaled up from 150A to 240A, a factor of 1.6, to simulate CP99 conditions. By doing so, this creates a considerably conservative approach. This scaled current spectrum was then used to represent the nonlinear characteristics of the arc furnace load.
Harmonic Distortion Simulations
Using the system model developed for the resonance simulations, the scaled harmonic spectrum in Figure 12 was modeled in SuperHarm as a non-linear load connected directly to the utility substation 69kV bus. A conservative approach was taken in modeling the transmission system by removing the parallel resistance used with each source equivalent. This parallel resistance provides the damping necessary to estimate “actual” system conditions. By removing this resistance, “worse than actual” system conditions can be simulated, thus providing extremely conservative results. Note: Because this source damping is not included, a direct comparison with measured THD values cannot be performed.
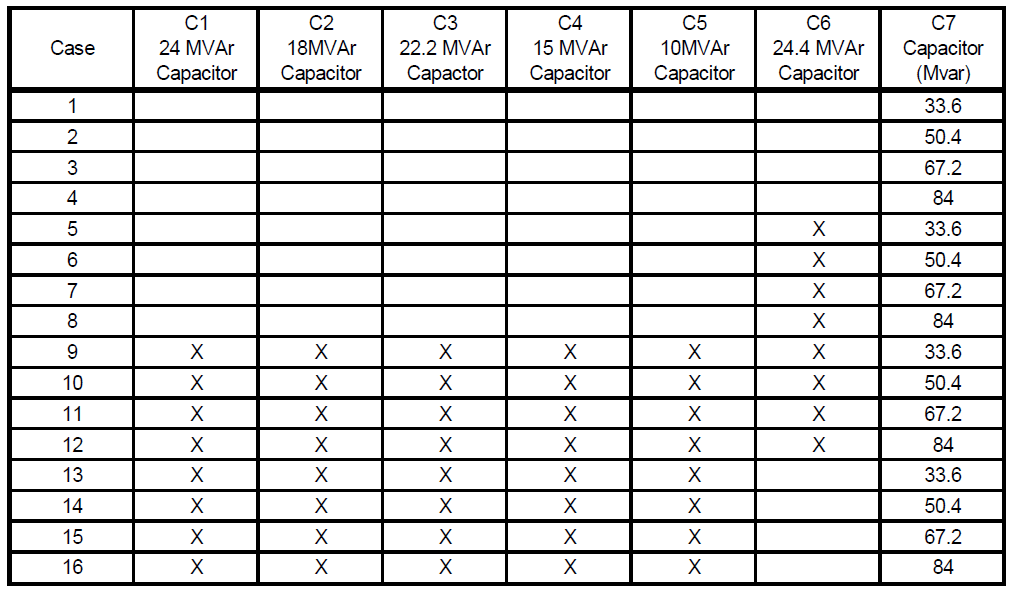
Based upon the frequency scan results found in Figure 3 through Figure 6, various worst case system configurations were considered for calculating the expected THD as the additional 50.4 MVAr capacitors are added at the utility substation. These cases are summarized in Table 1. For each of the below cases, the amount of capacitance at the substation is increased from the presently operating 33.6 MVAr to 84 MVAr in increments of 16.8 MVAr.
The capacitor configurations considered in Cases 1 through 8 are not considered realistic scenarios. However, to simulate the absolute worst case conditions, they were included.
Table 1 – Summary of Harmonic Distortion Simulations Performed
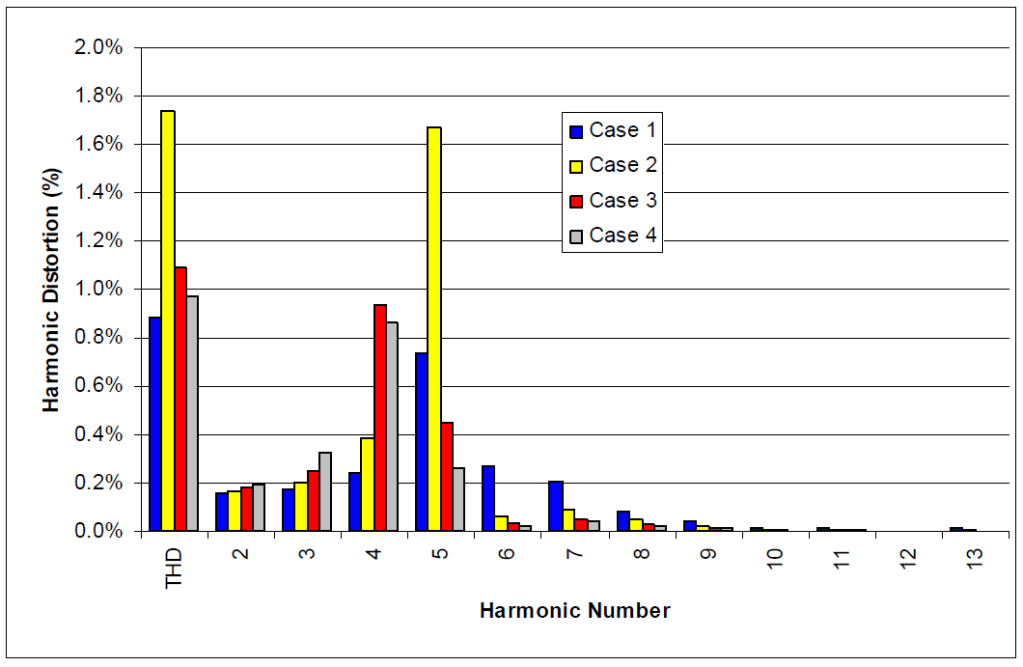
As seen in Figure 13, with only capacitors operational at the substation, the maximum THD value calculated is found in Case 2, with less than 1.8% THD.
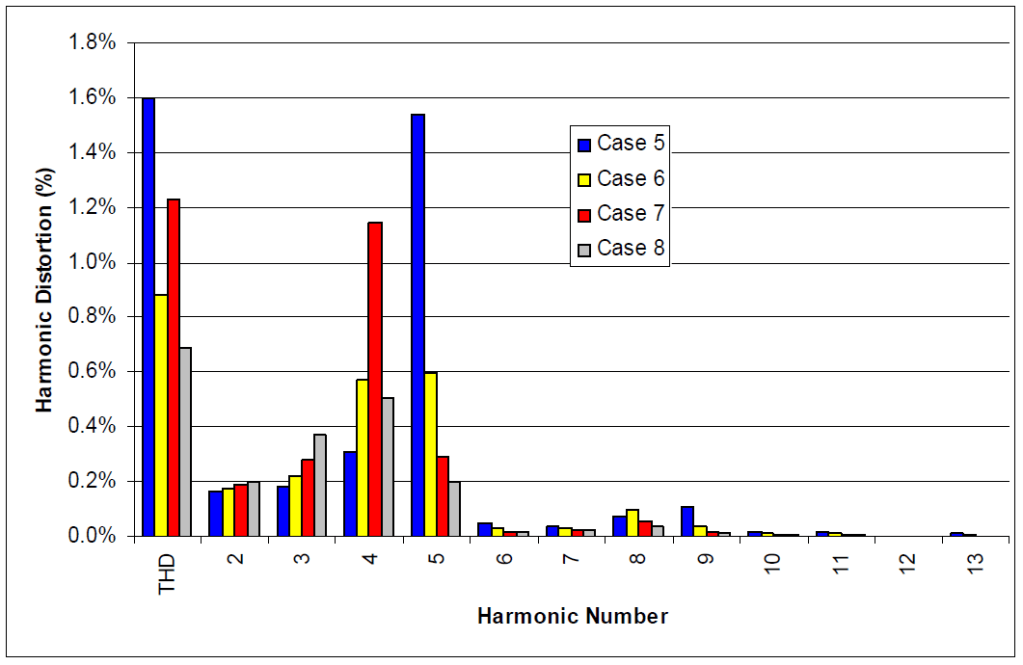
With the C6 24.4 MVAr capacitor online (Figure 14), the maximum THD values are found in Case 5, which represents the existing substation capacitor configuration. The maximum THD value reaches 1.6%, with the 5th harmonic topping at approximately 1.5%. As capacitance is increased at the substation, it is shown that the THD values are actually reduced in magnitude.
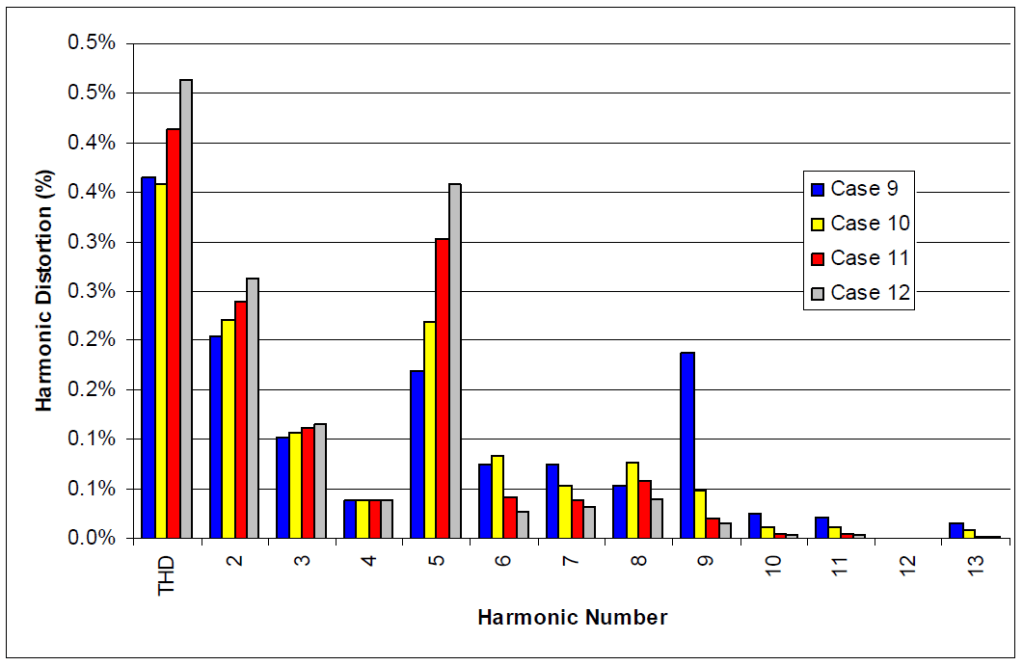
Figure 15 represents typical system capacitor configurations with the addition of C1, C2, C3, C4, C5, and C6 capacitors in service. The additional capacitance reduces the THD to approximately less than 0.5% for all cases. This reduction in THD is due to the reduced driving point impedance as the additional capacitors are switched into service (see Figure 5 and Figure 6).
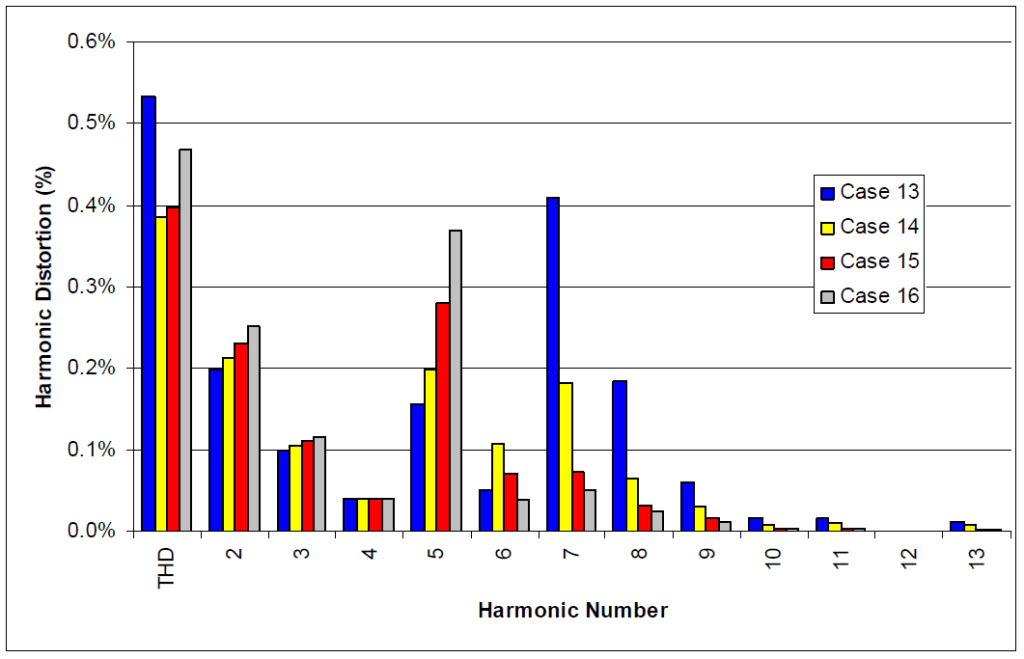
Similar results are found with the C6 24.4 MVAr capacitor taken out of the circuit (Figure 16). The maximum THD value reaches approximately 0.5%.
SUMMARY
The purpose of this study was to investigate the possible resonance conditions that would occur with the introduction of 3 additional 16.8 MVAr capacitors at a utility-owned substation and to determine if any harmonic distortion limits would be exceeded due to excitation from a locally operated arc furnace. A complete three-phase model of the substation and surrounding transmission system was modeled in SuperHarm and the frequency response characteristics were examined for various system capacitor configurations.
A wide range of capacitor combinations was simulated using SuperHarm. As shown in Figure 3 through Figure 6, the introduction of the additional 3 capacitor banks at the substation reduces the magnitude of the present harmonic resonance. However, as a result of the added MVAr introduced into the system, the resonance frequency is also reduced to lower order harmonic values. This shifting of harmonic resonance has resulted in peaks occurring around the 3rd, 5th, and 7th harmonics.
With the locally connected arc furnace, it was quite possible for the furnace to excite this lower-order resonance, thus resulting in extreme overvoltages occurring at the substation. Due to the shifting of resonance to the 3rd, 5th, and 7th harmonics, it was determined that additional investigation would be required before conclusions with regards to possibly harmonic distortion problems could be made.
The second portion of this study involved monitoring the 69kV bus for possible harmonic currents that could excite the resonant conditions as a result of the additional capacitor bank installation. To simulate the affects of the arc furnace, the measured data was then incorporated into the three-phase model developed previously.
The harmonic distortion simulations proved that the amount of harmonic current being drawn by the arc furnace was not enough to cause problematic voltage distortion levels. The maximum voltage distortion levels were calculated at approximately 1.8%, well below the 5% THD limit specified in IEEE Std. 519-1992. Therefore, the additional three capacitor banks will not cause excessive voltage distortion at the utility substation and surrounding transmission system.
REFERENCES
1. IEEE Std. 519-1992, “IEEE Recommended Practices and Requirements for Harmonic Control in Electrical Power Systems.”
