Published by Arif Nur AFANDI1,2,3, Irham FADLIKA1, Langlang GUMILAR1, Takeshi HIYAMA4
1Electrical Engineering, Universitas Negeri Malang, Malang, Indonesia
2Center for Advanced Materials for Renewable Energy, Universitas Negeri Malang, Malang, Indonesia
3Smart Power and Advanced Energy Systems Research Center, Batu, Jawa Timur, Indonesia
4The IROAST, Kumamoto University, Kumamoto, Japan
Abstract. Based on current developments related to the application of technology and the growth of load demand, power system structure (PSS) has grown into a large, intelligent network by integrating many new systems. At present, many classical systems are being modernized and developed towards smart systems to various technical performances while providing continuously energy from the generating sites to serve load centres as end energy users. On the other hand, protection and attention to the environment and renewable energy sources also affect the power system operation which is intended to reduce emissions and include green energy sources. Furthermore, these works explore an assessment of operations on local interconnection system topologies which are installed captive power plants. These studies are used to develop and evaluate the performance, where solar power plants are also installed as sources of energy suppliers. In this study, operating assessments are approached using a power flow study (PFS) to define structural performance expanded through several scenarios. In addition, the procedure for obtaining optimal conditions is also facilitated by using the Takagi Method (TM) and Thunderstorm Algorithm (TA) for PFS hybrid structures considered an integrated renewable energy source (IRES). Based on the technical scenario set, the results show that the applied scenarios have different performances. In addition, this study also provides various implications. IRES has affected system performance. PSS contributes to the part that is committed to covering the burden. TM and TA can be applied to the hybrid PFS structure.
Streszczenie. W artykule przedstawiono metodę PFS (power flow study) do optymalizacji struktury lokalnej sieci zasilającej z zainstalowanymi źródłami fotowoltaicznymi. Zastosowano też metodę Takagi i algorytm burzowy do optymalizacji sieci z różnymi scenariuszami. . Analiza pracy lokalnej sieci z uwzględnieniem własnych źródeł energii i możliwości rozbudowy
Keywords: operation, performance, power flow, structure.
Słowa kluczowe: lokalna sieć zasilająca, własne (captive) źródła energii
Introduction
In principle, the power system (PS) is related to the process of converting primary energy sources and consumers as users of converted energy. So far, the energy conversion process has been carried out with applied technology which is now able to convert natural resources into a type of energy that can be used through a series of certain processes in the generating unit. On the other hand, power systems are prepared with various levels of electricity network services to form interconnection networks that connect generating units and load centers. In general, an integrated network power system (INPS) is widely used to integrate all sections [1], [2]. At present, INPS is a large network and consists of complex integrated companies and operators to control operations [3]–[6]. In general, this system is used to maintain the availability and adequacy of sustainable energy as long as customers use utilities [7]–[11]. In addition, this network is also used to combine all generating units located close to various primary energy sources. In addition, this network is also connected to the load center at different distances for power delivery.
Nowadays, the INPS is displayed by integrating a local power grid (LPG) to increase the guarantee of performances [12]–[15]. On the other hand, LPG continues to look for applied technologies as well as acceptable for the operation. Technically, LPG is operated in the classification structure which is used to supply power demands in accordance with the connections at backbone systems [2]. In particular, customers are growing faster with increasing power demand, thus, it is requiring a different generation system area with the addition of a power plant. To cover this condition, the power balance must be acceptable for energy producers and users with a reasonable low cost [16]–[19]. Increased PS operation that is guaranteed based on LPG performance is an important aspect of the level of system deviation, so as not to experience blackouts. One of the most sensitive problems of this condition is identified using shift factors and uninterrupted conditions. The most critical aspect of this other situation is related to the severity of the PS presented in generator outages, loading of transmission lines, and the magnitude of bus voltage drop.
Moreover, the operation is carried out sustainably and continuously to maintain quality and performance under the technical constraints and environmental conditions by maintaining the quality of daily operations. In addition, operations need to give double attention to dealing with complex operational problems and to include high requirements [20], [21]. INPS is also monitored and controlled in steady and transient conditions, as well as to define the power system performance (PSP) [11], [22], [23]. In addition, the contingency problem is also recognized by the power flow study (PFS) to immediately overcome the impact of faulted lines, including connected or disconnected connections, integrated and host load generators, and load changes. In detail, the system should be identified in technical indicators and it needs to maintain regularly on normal and fault conditions.
Presently, many approaches have been proposed and have been implemented to measure technical performances, including INPS and LPG. In line with the development of infrastructure and services, demand for expenses is growing in line with the availability of the produced power and the capacity of the INPS network, although load growth is faster than the provision of power plants. Therefore, the provision of power will face the possibility of exploring primary energy sources as an alternative energy source. Regarding the protection of the environment and non-fossil energy sources, renewable energy is an energy source that is an opportunity to be developed and this implementation depends on the technological readiness currently applied [19], [21], [24]– [27]. In this case, an integrated renewable energy source (IRES) is involved in the power system which is performed in an assessment of the operation of INPS, as part of the system development.
Operating
Performances In general, the assessment is used to identify system conditions throughout technical performances evaluation using operational indicator for determining the operating status under all requirements, as in previous research studies [28], [29]. Many PFS techniques have been proposed and applied to evaluate INPS and LPG. The most popular approach which widely applied is a Newton Raphson Method (NRM) and it has applied to various technical problems for power system calculations [30], [31]. Recently, PFS become an important review for presenting the performance of the electricity network. The basic equation for PFS is built in its entirety and comes from the nodal analysis equation for PSP. In detail, each bus in PS is classified into three types of load buses, bus generators, and swing buses [26], [30], [32].
In detail, the load bus referred to in the P-Q bus is defined as a bus where real and reactive power is determined and determined, while the bus voltage will be calculated and is the result of system conditions. In addition, many methods have been proposed and applied to find the optimal PFS solution as a description of the system performance is evaluated. In this study, PFS will be combined with the Thunderstorm Algorithm (TA) and the Takagi Method (TM). The structure and intelligent TA agents are discussed fully in previous works while TM effectiveness for PFS is also reported clearly in [25], [33], [34].
Recently, the use of fossil fuels is faced with environmental requirements and also meets the requirements of safety, reliability, and quality. In addition, commercially available energy storage systems are currently not technically or economically feasible for mass energy storage that includes the IRES [24], [26], [32], [35]. From this economic perspective, renewable energy sources become competitive icons in terms of costs compared to fossil-based energy sources [18], [25], [32], [34], [36]. This inclusion is an opportunity for PSP as part of a combination of energy supply. Based on the IRES, PFS is approached by using power injection into the system where the captive power plant (CPP) is also injected into the system.
Moreover, this PFS is used to determine steady-state performance in certain power plants from CPP-based on developed solar power plants. Therefore, PFS is designed to determine technical performance, for example, voltage, current, power loss, real power, and reactive power included in the system under the limits and requirements for the given load conditions [11], [26], [31], [37]. This assessment is very important in LPG role plays [31], [38]. Many PFS techniques are introduced to implement and assess power system performances.
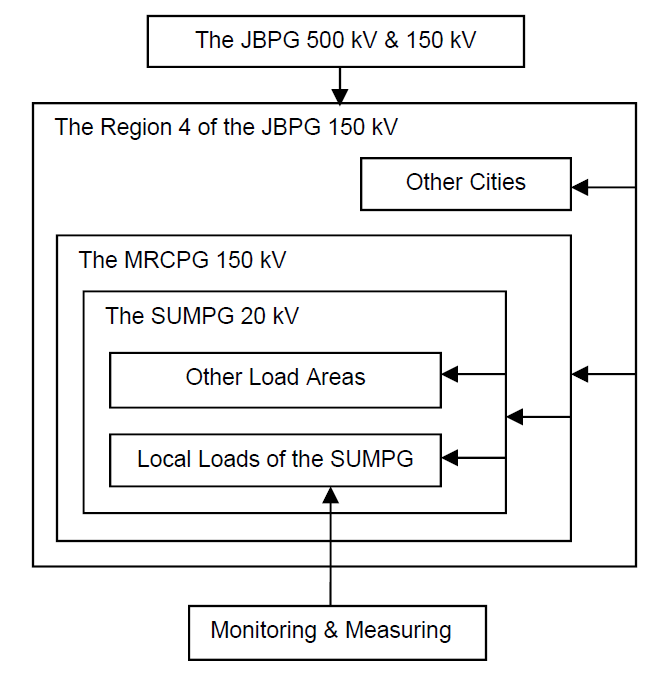
In these studies, NRM is facilitated by using TM and TA to complete LPG assessments. To cover LPG interactions, the power system infrastructure development (PSID) is a very important part of exploring [1], [39]. In fact, the power system performance has presented the system in many voltage levels which are gained in indicators as well as parameters for operating status. PSID is imposed to expand the classical system from the State University of Malang Power Grid (SUMPG). In detail, SUMPG is illustrated in Figure 1. Operationally, this system is connected to the main Java Bali Power Grid (JBPG) network connected in the Malang Raya City Power Grid (MRCPG) which is established using 150 kV. In this electricity network, MRCPG supplies to Malang Regency, Malang City, and Batu City for the main areas. All cities are linked in a 150 kV system as interconnecting backbones through several other network systems of 70 kV, 20 kV and 220 V. Regarding JBPG, MRCPG is operated in two ways namely to export and import energy which is the main source of point connections. Refer to the interconnection of JBPG and MRCPG, SUMPG is supplied using 20 kV for existing local networks distributed to several main load centers. Now, SUMPG is growing and is facing increasing loads as end-energy users and is indicating that it needs infrastructure improvements and new opportunities in the main power supply system. This system also requires a backbone level of improvement to maintain performances. In these works, SUMPG is designed for the 70 kV expansion system.
Power Grid Development
As mentioned before that the PS is constructed simply in a line networking for energy productions and energy users, which is now becomes a large network and it is presented in INPS to cover the LPG area. Recently, The PSID meets a demand growth during the operating time. Moreover, an additional generating capacity, power line strengthening, and system expansion are major issues which are should be covered for the existing condition in high reliabilities. In this study, SUMPG is expanded in several additional load blocks as given in Figure 3 and designed in Figure 2.

According to Figure 2 and Figure 3, the SUMPG topology is developed based on two sub-systems which were approached using a 16 bus system, where three energy suppliers are applied as available resources. In detail, this system is also arranged using 17 lines; 9 load buses, and 2 solar energy centers. This topology is modified from an old structure designed based on an existing system, which is presented as a square type on the bottom side of Figure 3. Specifically, SUMPG is LPG from MRCPG which is connected to JBPG at 150 kV. In detail, the load block is concentrated on the selected 20 kV bus to integrate local load connections. This load is given in Table 1 for Ring 1 and Ring 2. In total, LPG has 15.55 MVA which is covered in 14,949 kW and 7,100 kVar.

Table 1. Partial loads of the sub-systems
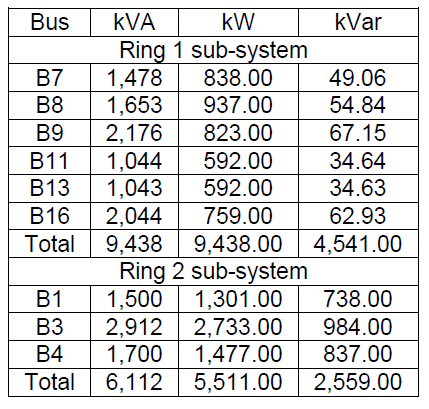
In particular, LPG is rearranged using a double area for Ring 1 and Ring 2, while CPP is installed in certain buses which have been determined based on the ratio of reality. Refer to the 20 kV backbone system, Ring 1 is developed to modify the radial system into a mesh form of the system. This type is redesigned from the original topology which includes all incoming electricity networks. Ring 1 integrates all load buses in partial locations. Future developments and potential sources are required to be plotted in Ring 2. Ring 2 is developed from Ring 1 by completing the IRES at the specified location for the CPP. In these locations, the CPP is presented as a solar power plant (SPP) installed on Bus 6 and Bus 9.In general, PSID is built using several electrical connection lines which are used to place two buses. This connection is also used to search for distributed power plants that are installed tightly in the load center [19], [40], [41]. In addition, the inclusion of CPP presented in SPP ensures a decrease in dependence on fossil fuels. SPP integration should contribute to the commitment of the electricity production unit. This SPP contribution also increases energy reserves and system capabilities [42], [43].
Assessing Procedures
As illustrated in Figure 2 and Figure 3, the LPG structure is divided into two areas, namely Ring 1 and Ring 2. SPP is installed in selected potential buses, where it is related to the IRES area which is designed based on the potential primary energy. In this work, the system is assessed in several case studies related to technical requirements and environmental constraints. In detail, this assessment is included in several operating scenarios, namely normal operation (NO), Ring 1 operation (R1O), Ring 2 operation (R2O). In normal operation, the system presents both rings without IRES. Ring 1 operations are focused on the circle shape of the topology structure with an open loop for Ring 2. Ring 2 operations are carried out by releasing Ring 1 so that it forms a radial type with an open circle shape as being the topology structure. By considering the disruption to the electricity network, the assessment is designed to state certain disturbances that have an impact on the breakdown of the electricity grid line. Furthermore, the termination of power production is displayed by means of operation off as it is now, that is the power grid 1 off (G1off), the power grid 2 off (G2off), and the power grid 3 off (G3off).
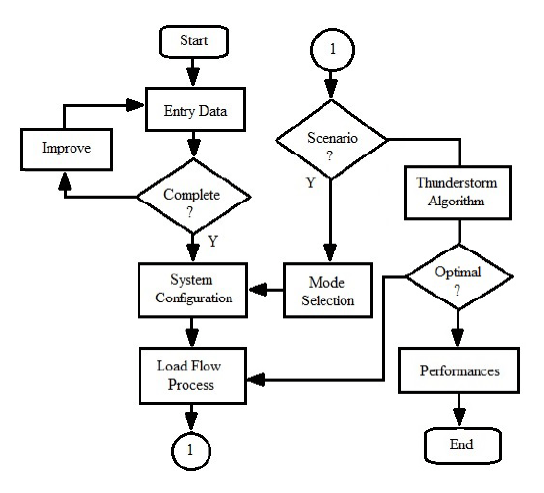
In particular, the assessment procedure for evaluating the system is shown in Figure 4. This figure illustrates all the steps to find out the optimal performance based on NO, R1O, R2O, G1off, G2off, and G3off. In addition, TM is applied to the PSP by applying PFS, as detailed in [33], [44]. In this study, the implementation of TM is referred to the previous work [45], [46]. Technically, PFS is limited by several requirements. Power delivery is also constrained using technical limits for the export-import (Exim) system. In these works, TA refers to procedures and hierarchies as detailed in [25], [32]. In addition, the performance of TA and TM is not explored in these works but it is concerned in the PSP through LPG link to SUMPGS for these studies. Computationally, TA and TM performance is only used in the entire process.
Results and Discussions
In this section, this work is intended to assess PSP based on the development of topological structures and to advance the electricity system in the development of SUMPG. This system is developed in a 20 kV system as well as the operating system of its formation. This evaluation is inline with previous works [31], [38], [47], [48]. In this work, LPG is expanded in the 16 bus system model, which includes local buses designed for load blocks in Ring 1 and Ring 2. Regarding the operational scheme, PFS is analyzed using NRM, where NRM is prepared using TM and TA. From the process, the optimal results of the process are presented in normal operation, Conditions of G1off, G2off, and G3off.
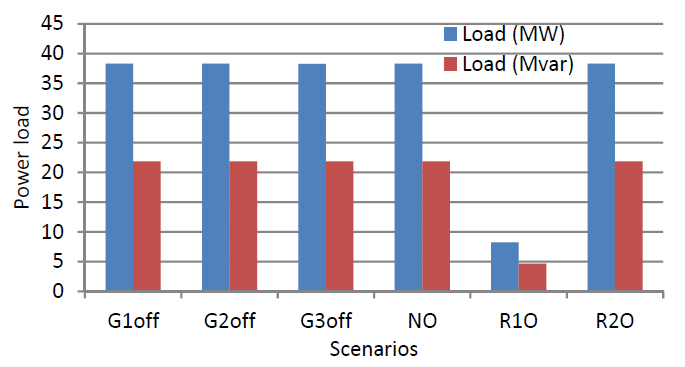
In addition, Table 2, Table 3, Table 4, and Table 5 show results of the evaluation subjected the LPG. These results are given for measuring performances in several parameters that corresponded to the power grid expansion. Another results are illustrated in Figure 5 related to demands which are presented based on the scenario.
Table 2. System performances of the ring assessment scenario

Table 3. Power flow performances of the ring assessment scenario

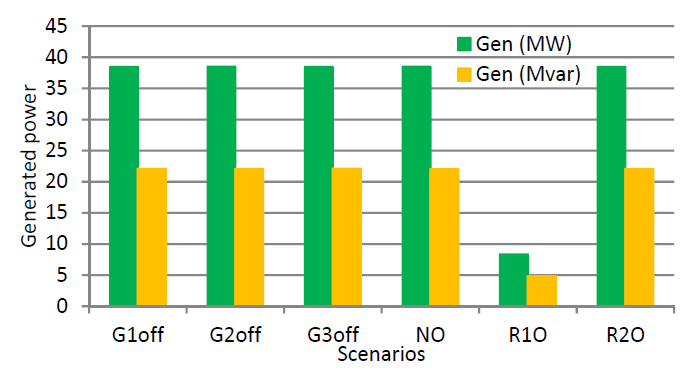


Focused on the power production, Figure 6 gives information for partial contributions in the operation while the power loss is depicted in Figure 7. In addition, the system also has different performance, as well as every assessment applied to the system model reflecting to normal R1O, R2O, and other schemes. In general, the Exim is presented in Table 3 and Table 6 for the power delivery between each pair of buses. This table also shows a charging map for each load block. Furthermore, power delivery, voltage drop, loss are given in Figure 8, Figure 9, and Figure 10.
Table 4. System performances of the grid assessment scenario

Table 5. Power flow performances of the grid assessment scenario
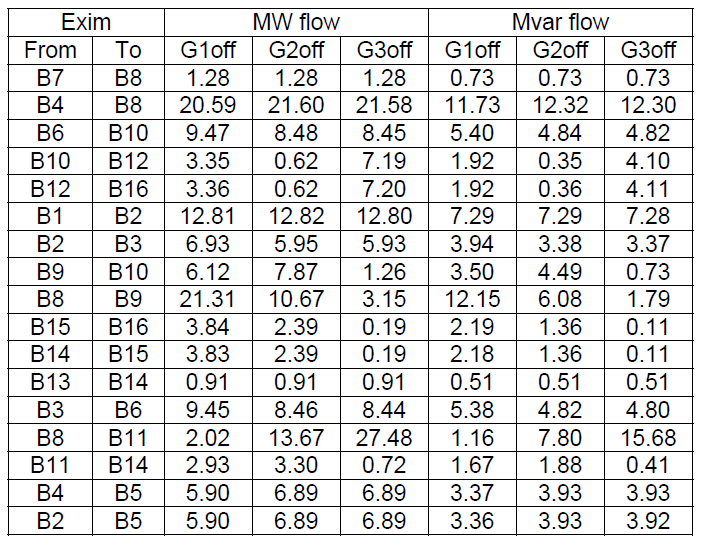
Refer to Figure 8, Figure 9, and Figure 10, it can be seen that each power delivery has different characteristics and profiles. According to Exim tracking, the highest power transaction is partially generated by the G3off operation, as illustrated in Figure 8. This characteristic is also supported by Table 5 where power delivery includes 27.48 MW and 15.68 Mvar for tracking Exim 14 or the line B8 to B11. Typically, LPG provides the power around 38.48 MW and 22.05 Mvar to meet load demand at 38.32 MW and 21.84 Mvar. Other contributions are given in Table 2, Table 3, and Table 4 for all scenarios, respectively. Regarding the system performance, the voltage drop is explained in Figure 2 and Table 4. In particular, the highest decrease occurred the line B2 to B8 for all types of valuations. This condition is in line with power loss as illustrated in Figure 10, which occurs in Exim 2 which is the highest power loss.
Conclusions
This paper presents the development of a local electricity network based on operational assessment of system performances, where the local system is expanded using the 16 bus model approach and integrating potential energy resources. On the other hand, the study also refers to loading systems designed through load center blocks. Furthermore, these works show that solar power plants affect to the power production and have an effect on system performances. Each scheme has different implications on results. TM and TA have the opportunity to be applied to the evaluation of power flow. For future work, uncovering the computational structure and power transactions is recommended
Acknowledgment
The authors gratefully acknowledge the support of Universitas Negeri Malang, Malang, Indonesia, for the PNBP Research Gran
REFERENCES
[1] Z. Q. Bo, X. N. Lin, Q. P. Wang, Y. H. Yi, and F. Q. Zhou, “Developments of power system protection and control,” Prot Control Mod Power Syst, vol. 1, no. 1, p. 7, Dec. 2016.
[2] P. Cuffe and A. Keane, “Visualizing the Electrical Structure of Power Systems,” IEEE Systems Journal, vol. 11, no. 3, pp. 1810–1821, Sep. 2017.
[3] A. N. Afandi, “Solving Combined Economic and Emission Dispatch Using Harvest Season Artificial Bee Colony Algorithm Considering Food Source Placements and Modified Rates,” International journal on electrical engineering and informatics, vol. Vol. 6, p. 267, Jul. 2014.
[4] N. S. da Silva, A. Simões Costa, K. A. Clements, and E. Andreoli, “Simultaneous estimation of state variables and network topology for power system real-time modeling,” Electric Power Systems Research, vol. 133, pp. 338–346, Apr. 2016.
[5] M. Aien, A. Hajebrahimi, and M. Fotuhi-Firuzabad, “A comprehensive review on uncertainty modeling techniques in power system studies,” Renewable and Sustainable Energy Reviews, vol. 57, pp. 1077–1089, May 2016.
[6] A. N. Afandi and H. Miyauchi, “Improved artificial bee colony algorithm considering harvest season for computing economic dispatch on power system,” IEEJ Trans Elec Electron Eng, vol. 9, no. 3, pp. 251–257, May 2014.
[7] S. Hr. A. Kaboli, J. Selvaraj, and N. A. Rahim, “Long-term electric energy consumption forecasting via artificial cooperative search algorithm,” Energy, vol. 115, pp. 857–871, Nov. 2016.
[8] B. Zakeri and S. Syri, “Electrical energy storage systems: A comparative life cycle cost analysis,” Renewable and Sustainable Energy Reviews, vol. 42, pp. 569–596, Feb. 2015.
[9] A. N. Afandi, “Weighting Factor Scenarios for Assessing the Financial Balance of Pollutant Productions and Fuel Consumptions on the Power System Operation,” Wseas Transactions On Business And Economics, vol. 14, 2017.
[10] A. N. Afandi, I. Fadlika, and Y. Sulistyorini, “Solution of dynamic economic dispatch considered dynamic penalty factor,” in 2016 3rd Conference on Power Engineering and Renewable Energy (ICPERE), 2016, pp. 241–246.
[11] A. N. Afandi et al., “Designed Operating Approach of Economic Dispatch for Java Bali Power Grid Areas Considered Wind Energy and Pollutant Emission Optimized Using Thunderstorm Algorithm Based on Forward Cloud Charge Mechanism,” International Review of Electrical Engineering (IREE), vol. 13, p. 59, Feb. 2018.
[12] J. Geeganage, U. D. Annakkage, T. Weekes, and B. A. Archer, “Application of Energy-Based Power System
Features for Dynamic Security Assessment,” IEEE Transactions on Power Systems, vol. 30, no. 4, pp. 1957– 1965, Jul. 2015.
[13] A. N. Afandi, “Optimal scheduling power generations using HSABC algorithm considered a new penalty factor approach,” in The 2nd IEEE Conference on Power Engineering and Renewable Energy (ICPERE) 2014, 2014, pp. 13–18.
[14] F. Luo et al., “Advanced Pattern Discovery-based Fuzzy Classification Method for Power System Dynamic Security Assessment,” IEEE Transactions on Industrial Informatics, vol. 11, no. 2, pp. 416–426, Apr. 2015.
[15] H. Gharavi, M. M. Ardehali, and S. Ghanbari-Tichi, “Imperial competitive algorithm optimization of fuzzy multi-objective design of a hybrid green power system with considerations for economics, reliability, and environmental emissions,” Renewable Energy, vol. 78, pp. 427–437, Jun. 2015.
[16] A. N. Afandi and Y. Sulistyorini, “Thunderstorm Algorithm for Determining Unit Commitment in Power System Operation,” Journal of Engineering and Technological Sciences, vol. 48,no. 6, pp. 743–752, Dec. 2016.
[17] M. Pandit, L. Srivastava, and M. Sharma, “Environmental economic dispatch in multi-area power system employing improved differential evolution with fuzzy selection,” Applied Soft Computing, vol. 28, pp. 498–510, Mar. 2015.
[18] A. N. Afandi, Optimal Solution of the EPED Problem Considering Space Areas of HSABC on the Power System Operation, vol. 7. 2015.
[19] N. Tutkun, O. Can, and A. N. Afandi, “Low cost operation of an off-grid wind-PV system electrifying residential homes through combinatorial optimization by the RCGA,” in 2017 5th International Conference on Electrical, Electronics and Information Engineering (ICEEIE), 2017, pp. 38–42.
[20] V. M. More and V. K. Chandrakar, “Power system performances improvement by using static synchronous series compensator,” in 2016 2nd International Conference on Advances in Electrical, Electronics, Information, Communication and Bio-Informatics (AEEICB), 2016, pp. 198–201.
[21] A. N. Afandi, Y. Sulistyorini, H. Miyauchi, G. Fujita, X. Z. Gao, and M. El-Shimy, “The Penetration of Pollutant Productions on Dynamic Generated Power Operations Optimized Using a Novel Evolutionary Algorithm,” International Journal on Advanced Science, Engineering and Information Technology, vol. 7, no. 5, pp. 1825–1831, Oct. 2017.
[22] G. Lammert et al., “Impact of fault ride-through and dynamic reactive power support of photovoltaic systems on short-term voltage stability,” in 2017 IEEE Manchester PowerTech, 2017, pp. 1–6.
[23] Z. Liu and Z. Zhang, “Quantifying transient stability of generators by basin stability and Kuramoto-like models,” in 2017 North American Power Symposium (NAPS), 2017, pp. 1–6.
[24] A. Ganapathy, G. Soman, G. M. VM, and R. Lekshamana, “Online Energy Audit and Renewable Energy Management System,” in 2016 International Conference on Computing Communication Control and automation (ICCUBEA), 2016, pp. 1–6.
[25] A. N. Afandi, “Thunderstorm Algorithm for Assessing Thermal Power Plants of the Integrated Power System Operation with an Environmental Requirement,” International Journal of Engineering and Technology, vol. 8, pp. 1102–1111, Apr. 2016.
[26] M. EL-Shimy, N. Mostafa, A. N. Afandi, A. M. Sharaf, and M. A. Attia, “Impact of load models on the static and dynamic performances of grid-connected wind power plants: A comparative analysis,” Mathematics and Computers in Simulation, Feb. 2018.
[27] D. Arengga, W. Agustin, Y. Rahmawati, S. Sendari, and A. N. Afandi, “SPEKTRA fast and smart software for renewable energy management,” IOP Conf. Ser.: Earth Environ. Sci., vol. 105, no. 1, p. 012077, Jan. 2018.
[28] W. Liu, R. Cheng, Y. Xu, and Z. Liu, “Fast reliability evaluation method for composite power system based on the improved EDA and double cross linked list,” Transmission Distribution IET Generation, vol. 11, no. 15, pp. 3835–3842, 2017.
[29] S. Zhao and C. Singh, “A reliability evaluation method for line switching operations in power systems,” in 2016 Power Systems Computation Conference (PSCC), 2016, pp. 1–7.
[30] S. Chatterjee and S. Mandal, “A novel comparison of gaussseidel and newton- raphson methods for load flow analysis,” in 2017 International Conference on Power and Embedded Drive Control (ICPEDC), 2017, pp. 1–7.
[31] J.-J. Deng and H.-D. Chiang, “Convergence Region of Newton Iterative Power Flow Method: Numerical Studies,” Journal of Applied Mathematics, 2013. [Online]. Available: https://www.hindawi.com/journals/jam/2013/509496/.%5BAccessed: 18-Mar-2018].
[32] A. N. Afandi, Y. Sulistyorini, G. Fujita, N. P. Khai, and N. Tutkun, “Renewable energy inclusion on economic power optimization using thunderstorm algorithm,” in 2017 4th International Conference on Electrical Engineering, Computer Science and Informatics (EECSI), 2017, pp. 1–6.
[33] H. M. Hasanien and S. M. Muyeen, “A Taguchi Approach for Optimum Design of Proportional-Integral Controllers in Cascaded Control Scheme,” IEEE Transactions on Power Systems, vol. 28, pp. 1636–1644, May 2013.
[34] A. N. Afandi and Y. Sulistyorini, “Thunderstorm Algorithm for Determining Unit Commitment in Power System Operation,” Journal of Engineering and Technological Sciences, vol. 48, no. 6, pp. 743–752, Dec. 2016.
[35] M. El-Shimy, M. A. Attia, N. Mostafa, and A. N. Afandi, “Performance of grid-connected wind power plants as affected by load models: A comparative study,” in 2017 5th International Conference on Electrical, Electronics and Information Engineering (ICEEIE), 2017, pp. 1–8.
[36] A. N. Afandi, I. Fadlika, and A. Andoko, “Comparing Performances of Evolutionary Algorithms on the Emission Dispatch and Economic Dispatch Problem,” TELKOMNIKA (Telecommunication Computing Electronics and Control), vol. 13, no. 4, pp. 1187–1193, Dec. 2015.
[37] M. A. Elizondo, F. K. Tuffner, and K. P. Schneider, “Three-Phase Unbalanced Transient Dynamics and Powerflow for Modeling Distribution Systems With Synchronous Machines,” IEEE Transactions on Power Systems, vol. 31, no. 1, pp. 105–115, Jan. 2016.
[38] Z. Ren, K. Wang, W. Li, L. Jin, and Y. Dai, “Probabilistic Power Flow Analysis of Power Systems Incorporating Tidal Current Generation,” IEEE Transactions on Sustainable Energy, vol. 8, no. 3, pp. 1195–1203, Jul. 2017.
[39] X. Luo, J. Wang, M. Dooner, and J. Clarke, “Overview of current development in electrical energy storage technologies and the application potential in power system operation,” Applied Energy, vol. 137, pp. 511–536, Jan. 2015.
[40] Y. Menchafou, H. E. Markhi, M. Zahri, and M. Habibi, “Impact of distributed generation integration in electric power distribution systems on fault location methods,” in 2015 3rd International Renewable and Sustainable Energy Conference (IRSEC), 2015, pp. 1–5.
[41] F. S. Abu-Mouti and M. E. El-Hawary, “Optimal Distributed Generation Allocation and Sizing in Distribution Systems via Artificial Bee Colony Algorithm,” IEEE Transactions on Power Delivery, vol. 26, no. 4, pp. 2090–2101, Oct. 2011.
[42] N. Gupta, A. Swarnkar, and K. R. Niazi, “Distribution network reconfiguration for power quality and reliability improvement using Genetic Algorithms,” International Journal of Electrical Power & Energy Systems, vol. 54, pp. 664–671, Jan. 2014.
[43] A. Mohamed Imran and M. Kowsalya, “A new power system reconfiguration scheme for power loss minimization and voltage profile enhancement using Fireworks Algorithm,” International Journal of Electrical Power & Energy Systems, vol. 62, pp. 312–322, Nov. 2014.
[44] S. R. Karnik, A. B. Raju, and M. S. Raviprakasha, “Genetic Algorithm Based Robust Power System Stabilizer Design Using Taguchi Principle,” in 2008 First International Conference on Emerging Trends in Engineering and Technology, 2008, pp. 887–892.
[45] “Taguchi’s method for probabilistic three-phase power flow of unbalanced distribution systems with correlated Wind and Photovoltaic Generation Systems – ScienceDirect.” [Online]. Available: https://www.sciencedirect.com/science/article/pii/S096014811731011X. [Accessed: 11-Apr-2018].
[46] “Improving the quality of an optimal power flow solution by Taguchi method – ScienceDirect.” [Online].Available:https://www.sciencedirect.com/science/article/pii/014206159591406A. [Accessed: 11-Apr-2018].
[47] T. Kulworawanichpong, “Simplified Newton–Raphson power flow solution method,” International Journal of Electrical Power & Energy Systems, vol. 32, no. 6, pp. 551–558, Jul. 2010.
[48] R. Muzzammel, M. Ahsan, and W. Ahmad, “Non-linear analytic approaches of power flow analysis and voltage profile improvement,” in 2015 Power Generation System and Renewable Energy Technologies (PGSRET), 2015, pp. 1–7.
Authors. Corresponding email: an.afandi@um.ac.id, an.afandi@ieee.org
Source & Publisher Item Identifier: PRZEGLĄD ELEKTROTECHNICZNY, ISSN 0033-2097, R. 95 NR 8/2019. doi:10.15199/48.2019.08.19
