Published by Peter JANIGA, Dionýz GAŠPAROVSKÝ, Slovak University of Technology in Bratislava
Abstract. The aim of this paper is to share the results of measurements in public lighting networks of current status in terms of electrical characteristics. Based on the measurements it is possible to create an image of the actual power proportions in public lighting networks and the problems that arise after incorrect design. The optimal solution to the energy aspects of public lighting networks requires an assessment of a several technical and electrical inputs.
Streszczenie. Celem artykułu jest przedstawienie wyników pomiarów parametrów elektrycznych publicznej sieci oświetleniowej. Na podstawie pomiarów możliwe było odwzorowanie rzeczywistych poziomów mocy w publicznej sieci oświetleniowej i problemów pojawiających się przy niewłaściwym projektowaniu. Optymalne rozwiązanie aspektów energetycznych publicznej sieci oświetleniowej wymaga oceny kilku parametrów technicznych i elektrycznych (Pomiary parametrów mocowych w publicznej sieci oświetleniowej).
Keywords: public lighting networks, power quality, power measuring, smart metering
Słowa kluczowe: publiczna sieć oświetleniowa, jakość mocy, pomiar mocy, inteligentne pomiary
Introduction
Nowadays, the energy consumption is assessed and evaluated in most of new products. In order to use technology more effectively and reduce CO2 emissions in the construction industry, new and renovated buildings are certifying since 2008. Preparation methods and determining the limits of different classes, depending on conditions in individual countries, lasted several years. The aim is to fulfil the obligations of the Kyoto Protocol, which EU committed.
Short time ago, the EU has created mandate to assess the energy consumption of public lighting systems. It is one of the best ways to evaluate the effectiveness of proposed solutions and to meet Kyoto Protocol commitments. The evaluation methodology was created in the working group CEN TC 169/226 JWG. The aim is not only define the evaluation process but also to verify the measurement of energy consumption in the sections under consideration.
Energy performance assessment methodology currently created is based on the determination of the consumption in selected sections with the same lighting parameters and geometry of communication. This method is showed in Figure 1. By comparing the calculated values and the measured values of electricity consumption are emerging differences. In order to identify and quantify these differences, the measurements in real public lighting networks was performed. From measurements is possible to identify and quantify a more conclusions. Evaluating the energy consumption in public lighting networks brings some specific problems. It is because of the harmonic currents flowing through lamps, voltage drop, load asymmetry, variability installed lamps and other factors.
Measurement of electrical parameters in public lighting networks
Lamp is a major appliance in public lighting networks. The true consumption to get in lighting networks is not possible by simply multiplying the installed power and the time of its operation. For better understanding the particularity of public lighting networks, the electrical parameters were measured in switchboards and endpoints of line.

In this paper are presented the results from measuring in Slovak Republic networks. Public lighting networks have various years of construction; some networks are also reconstructed or newly built. A totally was analysed 130 public lighting networks.
Table 1. The parameters of networks
| Municipality | Number of measured switchboards | Network |
| Michalovce | 82 | Cable, overhead lines |
| Dunajská Streda | 43 | Cable, overhead lines |
| Gabčíkovo | 1 | Overhead lines |
| Handlová | 2 | Cable |
| Galanta | 1 | Cable |
| Matúškovo | 1 | Cable |
Measurements have been realised at the time of the minimum and maximum load of distribution networks in terms of distribution network impact to the public lighting network. Electricity consumption affects the size and distorted supply voltage of the surrounding customers.
Specifics of public lighting networks in determining the energy consumption
Exact determination of network power consumption in time is nearly impossible. This is due to many influences and variable network characteristics. Lamps and network analysis identified the following impacts on instantaneous consumption:
– Voltage drop,
– The impact of switchboard, line, connectors, fuse and luminaries,
– Power variability of lamp during stabilisation,
– Passive consumption of the network,
– Control, measurement, and communication equipment consumption,
– Effect of harmonic voltages and currents – distortion power,
– Installed regulators,
– Variable operating time during the year,
– Reactive power,
– Load asymmetry,
– Connected other devices (kiosk lighting, building illumination, etc.)
Measured data
The aim of the measurements is to determine the consumption of public lighting networks and analyse the effects to power consumption. From the measurements is possible to identify specifics of public lighting networks in terms of electrical parameters.
Effective values and transients of voltages and currents have been measured. Values have been recorded at start, during, and after stabilisation of lamp. Measuring sensors have been connected in the switchboard and in selected line endpoints. From waveforms is possible to determine voltage and current harmonic analysis at start and after stabilization.

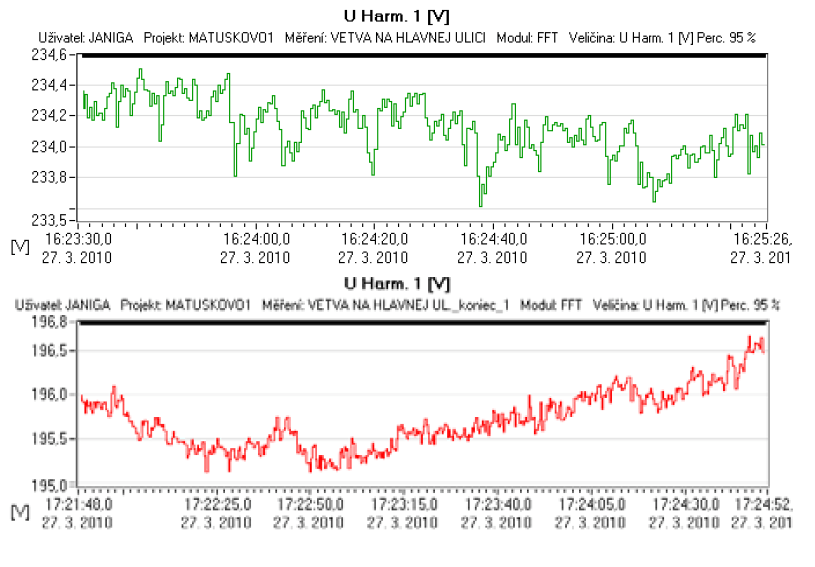
Drop voltage
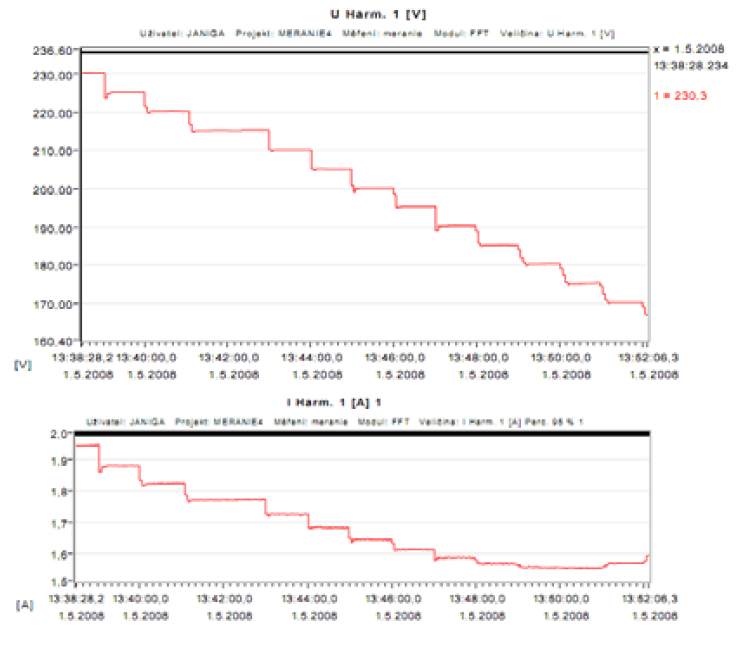
Design of cables in public lighting networks requires checking the current capacity and dropping voltage, especially if lighting regulator is used. This could be caused by reduced voltage by regulator and large voltage drops at the end of the line. Large voltage drops cause problem with discharge stability in the lamp. This problem occurs mainly for lamps with magnetic ballasts. Electronic ballasts can solve problem with voltage drop.
From measurements performed in Matúškovo it can be seen that at the end of the line voltage was out of the boundaries of EN 50 160. Although at the beginning of the branch is almost nominal voltage. This situation occurs when at the beginning of the line is almost nominal voltage. This network has been just before reconstruction and almost half of the lights have been broken. Some lamps have been connected to another phase, but it is expected that already during the construction of the network with a 250 W mercury lamps.
More often lamp switching due to unstable discharge is reason of low voltage in lighting network. This could cause the state where the two phases are interrupted.
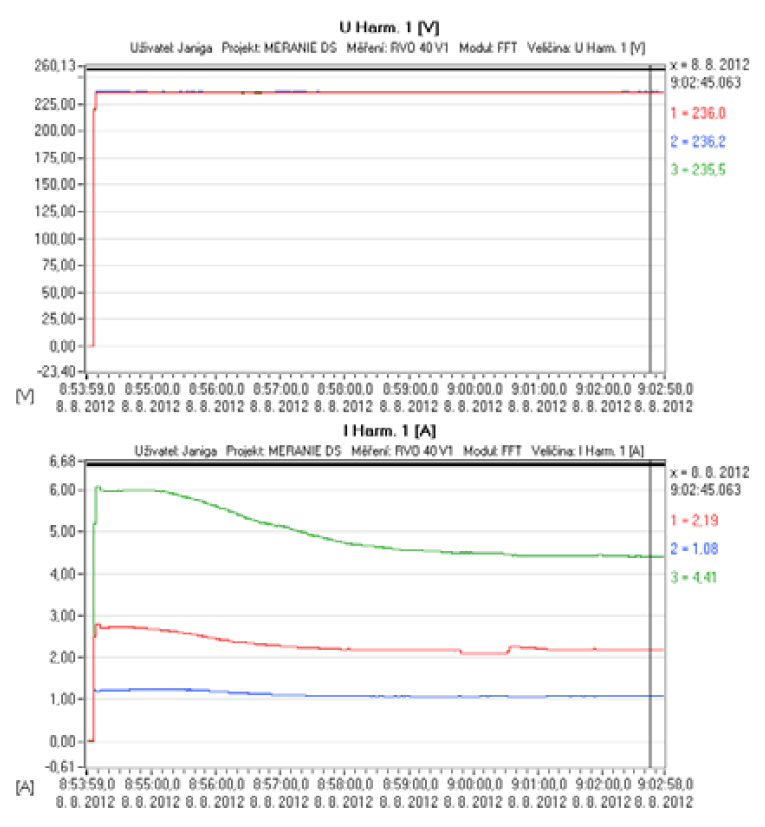
Variation of lamp power during stabilization
In street lighting networks, usually discharge lamps are used. For these lamps are characteristic progressive stabilisations of parameters. Stabilization of the discharge and electrical parameters is not longer than 15 minutes.

What concerns the lamp power; there are two typical situations during start-up of discharge lamps. If the lamp is supplied by inductive ballast, then current flowing in lamp is higher at start up and during stabilisation the current flow decreases. In the case of a lamp with electronic ballast, the situation is reversed. This means that due stabilisation the current increases.
Control, measurement and communication equipment consumption
The calculations consider only lines resistance. Reactance is ignored because it is several times lower. Measurement in real networks with nine lamps has confirmed a little impact on the course of the current reactance. The following figure shows, that the harmonic content is not changed by distance, but only due to distorted voltages. Slight differences are due to age of lamps (lifetime lamps are changing the electrical parameters) and small variations of electrical parts (the same lighting parameters are slightly different).

Passive consumption of the network
Consumption in network consists of the consumption of lamp and consumption of the other equipments. Usually these elements are placed inside the switchboard. Passive consumption and the consumption of auxiliary equipments can be divided into two groups:
– Consumption depends on the installed power consumption,
– Consumption is independent of the installed power consumption.
Passive consumption in public lighting networks is caused by loss of breakers, power control circuit (timer or sensor light intensity). This group includes the consumption of the controller.
Effect of harmonic voltages and currents – distortion power
Lamps with inductive ballast currently dominate in the public lighting networks. These lamps have a nonlinear VA characteristic and non-harmonic currents flow thru. Current distortion increases with voltage distortion. Undistorted power supply voltage does not occur.
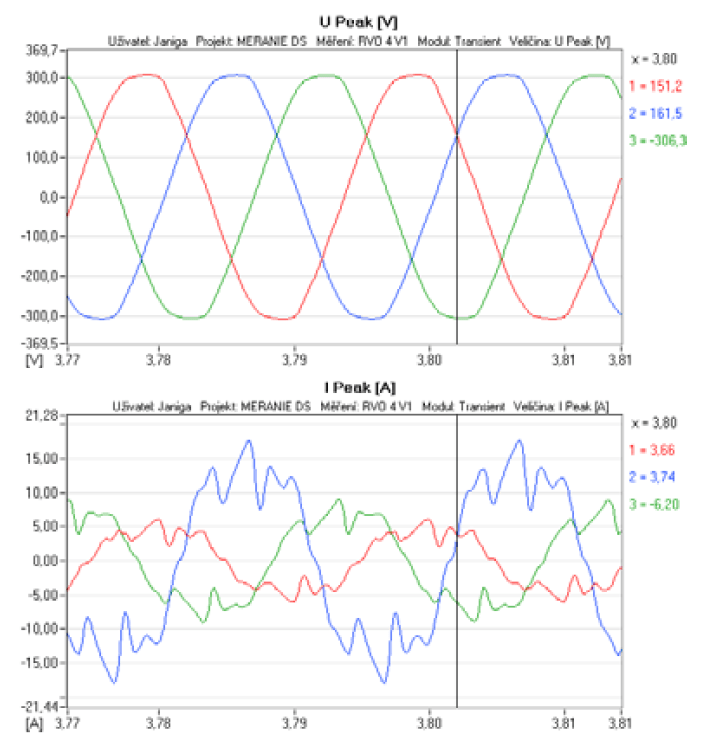
Distorted currents cause distortion power. Apparent power takes into account distortion power necessary.

where: S– apparent power, P – active power, Q – reactive power, D – distortion power.
Finally distorted currents cause increase losses, voltage distortion and greater stress of network elements. Deformed currents flows are eliminated in lamps with electronic ballasts. Harmonic generation in the LED lamps is depending on the power supply. If the power supplies to the LED don’t have the harmonics filter such lamp generate strong distorted currents.
Installed regulators
In order to reduce the consumption of network, regulators control the power lights. Technically, regulation is designing individually in lamps or in the central switchboard. Deeper analyses are showing that the change in voltage changes the power factor and harmonic content of current. These changes are caused by changing the discharge and capacitor in lamp. In the case of voltage regulation on lamps with electronic ballasts, is to some extent this regulation is ineffective.
Some newer regulators do not change only the amplitude but also the supply voltage waveform. In such cases, it is strongly influenced by the current flow deformation in lamps.
Reactive power
Results of measurements show problem with apparent power and power factor. Although the lights have compensating capacitor, the measured values are outside the range of the desired value given by distribution network operators (PF in the range 0.95 to 1.00). Because it is a small consumption, there is no reactive consumption fee in Slovak Republic. In the measured networks losses caused by reactive power transfer are negligible. With an average wattage of public lighting network to 10 kW are losses not great. Losses due to the transfer of reactive power are not the same throughout the network. Maximum losses are near the switchboard and at the ends of line are minimal. With careful optimization of the network it makes sense to deal with this problem and eliminate possible causes.
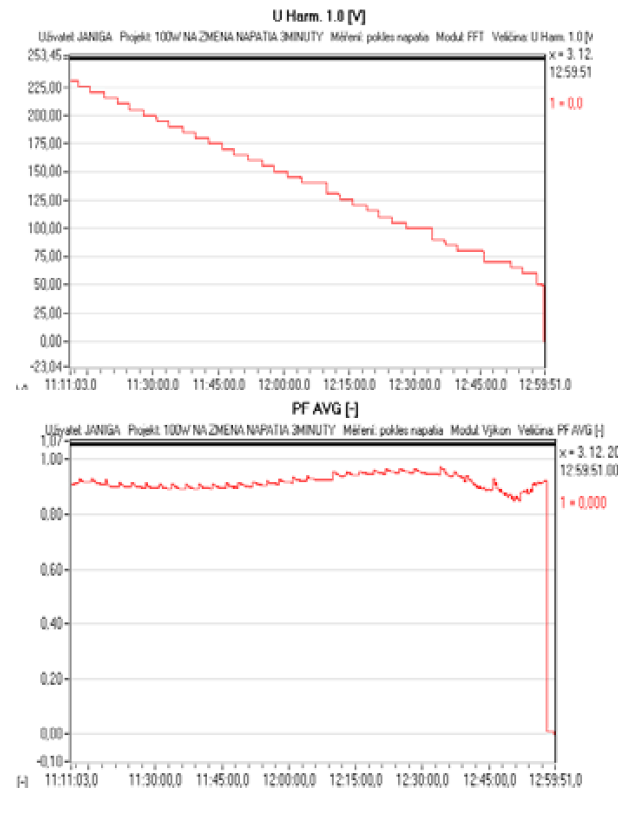
As shown in Figure 10, there is no power factor dependence on voltage change. The problem with reactive power can occur due to loss of capacity of the compensation capacitor. This failure occurs very rarely. Another possible reason may be the usage of an inappropriate capacitor as in lamps in Galanta, where the resultant value of the power factor is 0.77 and the incremental value of the power factor of individual lights is low.
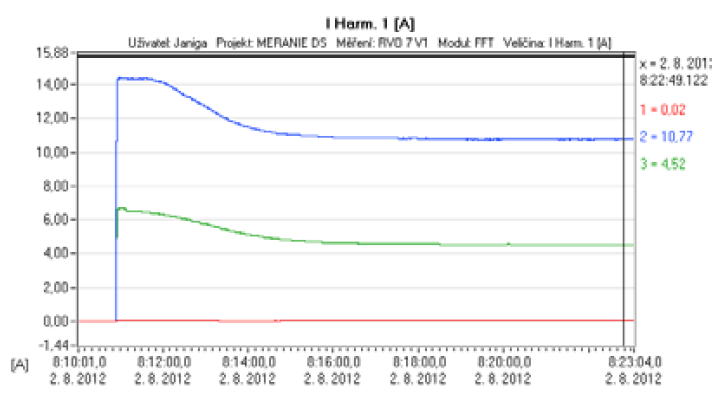
Load asymmetry
From several measurements carried out in the elderly and reconstructed networks is indicated that the load unbalance is a common phenomenon. In terms of power quality this is not a danger. It doesn’t even increase operating costs, because the distribution system operators don’t charge the load unbalance to customers.
Load asymmetry in new networks caused by the inappropriate connecting of lamps to different phases. Except the problem with uneven lighting pronounced in case of failure of one phase may be a problem with overloading phase, because the design is considered with uniform distribution. Very significantly, this problem is seen from measurements in Galanta, where all the lights are connected to one phase even if the network was made the new three-phase cable. If the new networks are not connected with balanced load, it may lead to switch off fuse of line.
Conclusion
In determining consumption in public lighting networks, it is important to first determine whether the assessed instantaneous consumption or annual. Solving instantaneous consumption is easier to take into account, however, setting the operating time. When comparing values calculated with the measured then differences may exist due to other influences such as:
– connecting other devices (phone box lighting, buildings illumination, fountains power source)
– connecting a special occasional light (Christmas decoration, lighting used during holiday)
Because the measurements obtained during the large amount of data, the results are still analyse readings. For solve power balance network of public lighting with LED lighting are not some of the problems. Also in these luminaires can be clearly defined behaviour when a certain voltage. In this case, you can build a network model and make a calculation take into account the most impact.

This work was done during implementation of the project Effective control of production and consumption of energy from renewable resources, ITMS code 26240220028, supported by the Research and Development Operational Program funded by the ERDF.
REFERENCES
[1] Sokansk y K. ; Novak T. , Energy savings in public lighting, Przegląd Elektrotechniczny, 84 (2008), nr 8, 72-74
[2] Sokansk y K. ; Novak T. , Power Saving Potential of Public Lighting in the Czech Republic, 9th International Scientific Conference on Electric Power, PROCEEDINGS OF THE 9TH INTERNATIONAL SCIENTIFIC CONFERENCE ELECTRIC POWER ENGINEERING 2008, Brno Univ Technol, Published: 2008, Pages: 401-403
[3] Onaygil, S., Güler, Ö., Erkin, E. Cost analyses of LED luminaires in road lighting. Light and Engineering, 20 (2012) nr 2, 39-45.
[4] Han Y, Xu L, Yun W-, Yao G, Zhou L-, Khan MM, et al., Power quality enhancement for automobile factory electrical distribution system-strategies and field practice. Przeglad Elektrotechniczny, 85 (2009), nr 6, 159-163.
[5] Škoda J, Baxant P. Non-pointed luminaires and their photometry. Przeglad Elektrotechniczny.84 (2008), nr 8, 44-6.
[6] Dolara A, Faranda R, Guzzetti S, Leva S. Power quality in public lighting systems. ICHQP 2010 – 14th international conference on harmonics and quality of power; 2010.
[7] Andrei, H., Cepisca, C., Dogaru-Ulieru, V., Ivanovici, T., Stancu, L., & Andrei, P. C. Measurement analysis of an advanced control system for reducing the energy consumption of public street lighting systems. Paper presented at the 2009 IEEE Bucharest PowerTech: Innovative Ideas Toward the Electrical Grid of the Future
Authors: Ing. Peter Janiga, PhD., Slovak University of Technology in Bratislava, Institute of Power and Applied Electrical Engineering, Ilkovicova 3, 812 19 Bratislava, E-mail: peter.janiga@stuba.sk; Doc Ing. Dionýz Gašparovský, PhD., Slovak University of Technology in Bratislava, Institute of Power and Applied Electrical Engineering, Ilkovicova 3, 812 19 Bratislava, E-mail: dionyz.gasparovsky@stuba.sk
Source & Publisher Item Identifier: PRZEGLĄD ELEKTROTECHNICZNY, ISSN 0033-2097, R. 89 NR 6/2013
