Published by Aldrin Mubiana, Michael Mutingi, Member, IAENG, Gideon Gope, Charles Mbohwa.
Conference: Proceedings of the World Congress on Engineering and Computer Science 2016 Vol II WCECS 2016, October 19-21, 2016, San Francisco, USA.
Abstract—Power quality (PQ) is concerned with control of harmonic distortions, voltage variations, voltage reductions, power interruptions and voltage surges. Enterprises devices that are sensitive to power system fluctuations, voltage surge, sag and momentary outage on the supply lasting more than a few cycles could cause several equipment malfunctions, resulting in revenue losses. Analysis of power quality is critical. This paper presents a case study Windhoek, Namibia. First, PQ occurrences are explored. A survey is presented to assess the level of consumer satisfaction with services offered. Second, some PQ mitigation and techniques are proposed to capture PQ disturbances. A comparison of results captured from January 2007 to December 2009 and in 2014 is presented. The highest number of PQ disturbances were voltage swells (6954) followed by power dips (2295). In terms of the time lost due to PQ disturbance, outage or interruptions (990420) were leading, followed by swells (1684.27) and power dips (387.75). These results indicate significant PQ disturbances.
Index Terms—Power quality, power quality disturbances, quality analysis, quality factors, Windhoek, Namibia
I. INTRODUCTION
A number of power quality (PQ) monitoring programs and surveys have been conducted across the globe [1][2]. The information collected during these surveys reflect the quality levels expected in particular power systems [3][4]. Literature indicates that power dips, swells and interruptions are the leading causes of PQ disturbances [6]. As industrial automation and control system continues to evolve, the demand for computer systems will continue to increase. Electronic devices continue to be more sensitive to power quality variations and abnormalities. As such, research into power quality and mitigation of the associated disturbances is imperative.
A. Power Quality Disturbances
PQ disturbances are classified into two categories namely as short-duration variation category and long-duration variation category [15]. Short-duration voltage variations are caused by fault conditions, switching of large loads, which require high starting currents or loose connections in a system. Short duration voltage variations can seriously affect equipment, particularly variable frequency drives, computers, programmable logic controls, and motor contactors.
Long-duration variations can either be over-voltages or under-voltages. They are usually caused by switching processes and load changes on the system.
In practice, it is crucial to set up PQ standards. The purpose of the standards is to protect utility and end user equipment from failing or mis-operating when the voltage, current, or frequency deviates from normal. Standards provide this protection by setting measurable limits as to how far the voltage, current, or frequency can deviate from normal. By setting these limits, standards help utilities and their customers gain agreement regarding acceptable levels of service. In Namibia, most of the standards were adopted from South African Standards [16], which are in line with international standards. Some of the organizations responsible for developing PQ standards include the Institute of Electrical and Electronics Engineers (IEEE), American National Standards Institute (ANSI), National Institute of Standards and Technology (NIST), and National Fire Protection Association (NFPA), and International Electro-technical Commission (IEC) [17].
Though not possible to completely eliminate all PQ disturbances, these should be kept at the reasonable levels. Some of the techniques highlighted in the literature are the use of the dynamic voltage restorer (DVR), the use of plugin hybrid electric vehicle, the use of static series compensators [20] [21] [22] [23] [24] [25]. In this respect, a myriad of PQ measurement tools have been developed, including instruments that measure and display the basic electrical parameters of voltage, current, frequency, as well as the impedance of an electrical distribution system. These instruments include ammeters, voltmeters, multi-meters, oscilloscopes, flicker meters, electrostatic voltmeters, infrared detectors, radio-frequency interference and electromagnetic interference meters, harmonic and spectrum analyzers and various types of wiring and grounding testers [26] [27[28][29].
This study aimed at analyzing power quality disturbances affecting Windhoek, Namibia.
B. Previous PQ Monitoring Programs and Survey
Throughout the world there has number of PQ monitoring programs that has been completed. Some of the PQ surveys carried out internationally are as follows: (a) EPRI DPQ(Electric Power Research Institute Distribution PQ) project: general PQ levels on MV feeders of selected utilities in USA [1], (b) NPL (National Power Laboratory) PQ study: Voltage sags, swells and transients in selected Lower Voltage systems in Canada & USA[2], (c) CEA (Canadian Electricity Association) Survey: general PQ levels at main switch boards at distribution level[33], (d) UNIPEDE survey: survey of voltage sags and interruption statistics at selected substations throughout Europe [34] and (e) Pan European PQ Survey [4]: The information collected during these surveys depicts of what is expected in electrical environment[3][4].
Standard procedures and limitations in Iran were surveyed in a distribution system. Experimental data as well as clarifying tables and graphs were presented. The results were then discussed to evaluate the strength and weaknesses of applying standard limits when real observations were to be performed. This survey is relevant to this study because it shows use of statistical tools to quantify PQ disturbances [35].
Mohamed [36] conducted a PQ survey for best power options in Malaysia. This was a questionnaire based survey with the objective of identifying best power options that can be offered to industrial customers in Malaysia.
Islam [37] described PQ audits carried out at hospitals in Western Australia and Puerto Rico. The main PQ disturbances which were observed were voltage flicker, neutral currents, and harmonic distortion. Mitigation solution were then established based on the findings. This survey is relevant to this research because within the CoW there are hospital such as Katutura, Windhoek Central, Roman Catholic etc., and these hospital operates with the equipment’s which are sensitive to PQ.
C. Current Monitoring Process in Windhoek
As the Electricity Control Board (ECB) desires to improve the quality and reliability of power, the ECB installed a PQ monitoring system, with effective PQ monitoring and reporting features [7].
TABLE I – INSTALLED PQ INSTRUMENTS
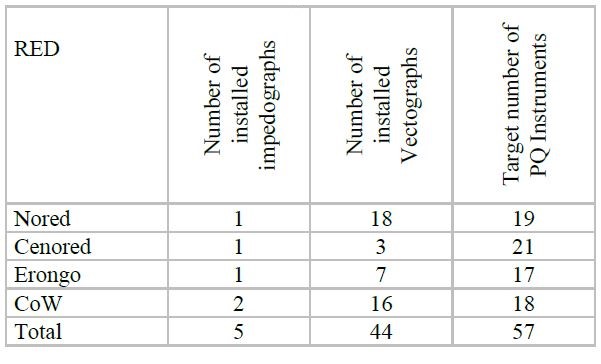
The total number of PQ monitors installed and their locations are illustrated in the Table I, covering four REDs nambely, Nored, Cenored, Erongo, and CoW
II. RESEARCH METHODOLOGY
Fig. 1 presents our research methodology. Various visits to various institutions were undertaken to establish the availability PQ data. Amongst them that were approached were NamPower, City of Windhoek (CoW) and Electricity Control Board (ECB). Interviews were conducted during visits to NamPower, CoW and ECB. Some raw data was available at ECB, however, the data required further analysis and interpretation.
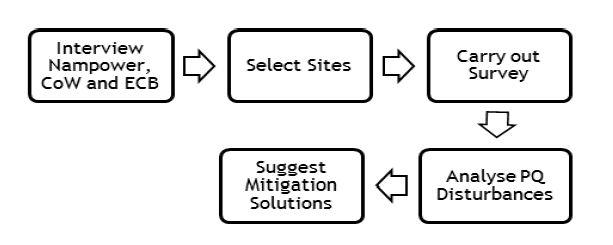
All PQ data for substations were analyzed for PQ disturbances. In line with research objectives and the available PQ data, a PQ survey was conducted. An additional month was allowed to give ample time to the respondents. PQ disturbances were classified using MS Excel. Mitigation solutions were suggested based on this analysis.
The research was aimed at investigating the experiences and opinions of end user consumers on the effects of PQ disturbances and the malfunctions. The sample comprised mining, hospital, hotel/leisure, newspaper publishing, residential building, non-residential building and others. The questionnaire was distributed to 40 industrial customers. Data was collected using the questionnaire which was distributed randomly to selected customers across the country through an online web-based system.
III. CASE STUDY BACKGROUND
The Electricity Control Board (ECB) seeks to improve the quality and reliability of supply to the state. Between 2006 and 2010, ECB outsourced the project to the Regional Electricity Distributors (REDs) and the city of Windhoek to install power quality measuring instruments in their various selected substations [7]. In May 2011, ECB delegation visited all the REDs to assess the outcome of the quality of service. The delegation established that all the REDs were on track with regards to PQ monitoring, and most had installed a PQ monitoring system, with good PQ monitoring and reporting features. With this backdrop, key research questions are:
- What are the factors affecting PQ in Windhoek?
- What are existing standards for PQ in Namibia?
- What are the solution/improvements for PQ?
In this respect, the specific research objectives are as follows:
- Investigate the specific PQ events affecting Windhoek substations;
- Carry out a pilot survey on PQ in order to assess the level of consumer satisfaction with the services offered;
- Analyze the PQ disturbances, and their effects on the supply network;
- Monitor the PQ disturbances and suggest suitable monitoring instruments.
The research suggests recommendations that if implemented will go a long way in solving PQ problems.
IV. LITERATURE REVIEW
PQ is defined as a set of electrical limitations that allows equipment to function in its intended manner without substantial loss of performance or life expectancy [8]. PQ study is needed for a number of reasons, either as power suppliers or as power consumers. Some of the main reasons are not limited to: i) Municipalities’ or REDs Perspective[9], (ii) Consumer’s Perspective[10], (iii) Equipment Manufacturers’ Perspective[11], (iv) Increase in Sensitive loads[12], (v) Increase in Nonlinear loads[12], (vi) Increase in Interconnected Power System[12], (vii) Source of Supply[13], (viii) Supply Verses End Use Issues[13] and ix) Increase in Generation of Renewable Energy[14]. PQ disturbances are classified into two categories namely as short-duration variation category and Long-duration variation category [15].
V. RESULTS AND DISCUSSIONS
PQ events data from 15 CoW’s substations and ECB was analyzed. Fig. 2 shows the total number of PQ disturbances per substation. Additionally, Fig. 3 presents the seasonal PQ disturbances. It can be seen that Shilunga, Elizenheim TRF1 and Jan Brand MiniSub Avis have consistently higher disturbances than Gloudina P Station Ludwigsdorf, Shilunga Cimberbasia and Gough Ms Rocky Crest.

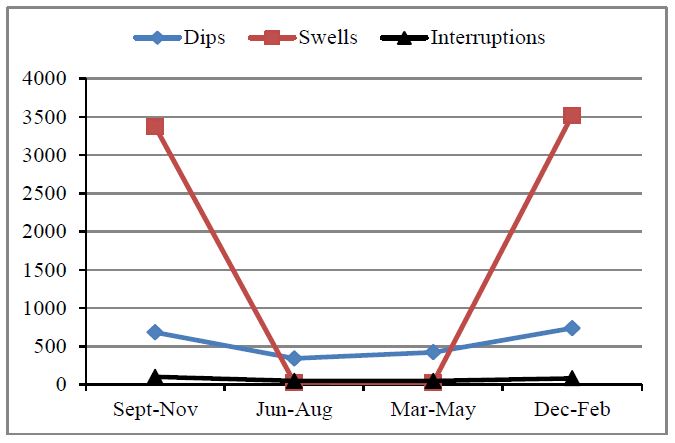
While some sites clearly exhibit their worst PQ performance during the mid-winter months (June to August), this is not consistent across all sites. Gloudina P Station Ludwigsdorf had a definite peak in PQ index in the June – August quarter. Shilunga experienced its highest PQ levels between December and February (perhaps due to airconditioning load – the load on Shilunga zone substation is predominantly commercial-retail). The exact reasons for the relatively better or worse seasonal trend are unknown; however, it will be related to loading levels during the various seasons. Further investigation into these seasonal trends is an area of further research.
A. Response Analysis
Data collection occurred from March to May 2015. Participants were contacted telephonically followed by mailing the questionnaire. Out of 40 selected participants, 11 (28%) responded, which is acceptable for this type of research [5]. Data obtained from the respondents were analyzed using the SPSS software along with MS Excel. Respondents were mainly industrial customers from the mining industry, hospital, bank, hotels, manufacturing, newspaper, residential, non-residential and others.
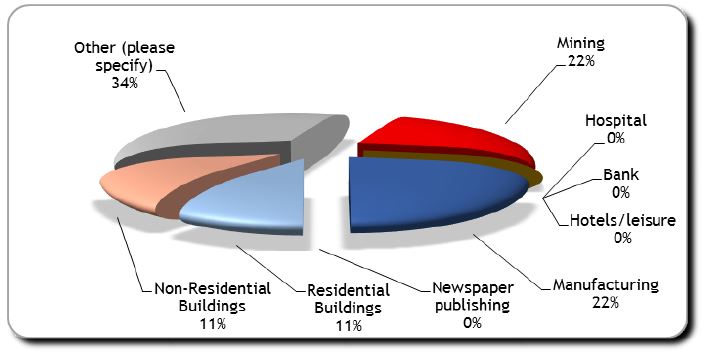
TABLE II – NUMBER OF RESPONDENTS PER QUESTION
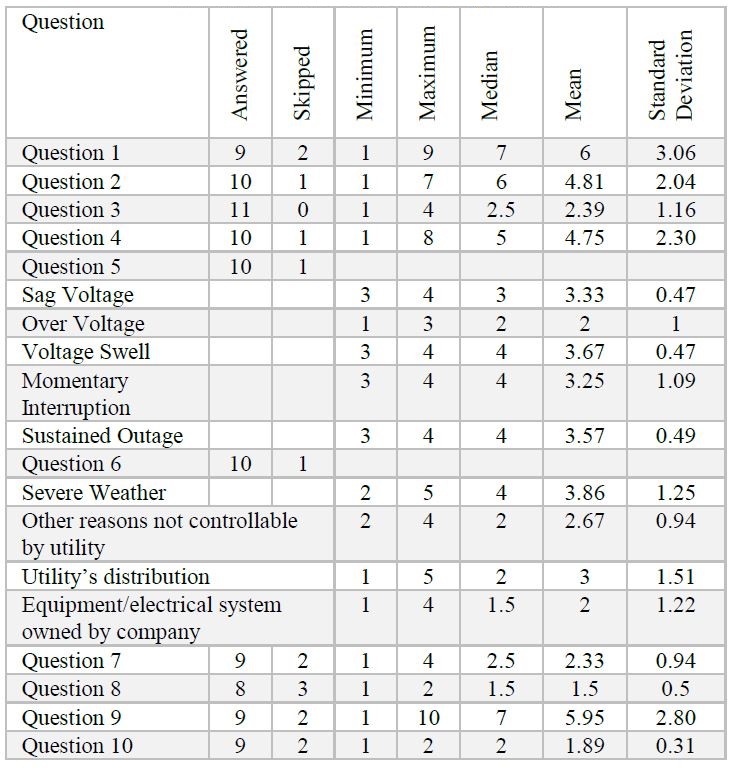
Fig. 4 shows the percentage of respondents per industry. The highest response is obtained from the others (34%), which includes office building and consumers, followed by mining and manufacturing (22%) that consist of food, plastic and paper industries, residential and non-residential building (11%). There were no (0%) responses from hospitals, bank, hotels and newspaper publishing.
Table II shows the number of respondents per question, detailing the answered and the skipped questions, together with other statistics such as the median, mean, and standard deviation.
B. Comparative Results Analysis
Although a large volume of data is not available for comparison, based on available literature, there is considerable evidence to suggest that sags, swells and interruptions were leading in previous results compared to current results.
TABLE III – UNITS FOR MAGNETIC PROPERTIES
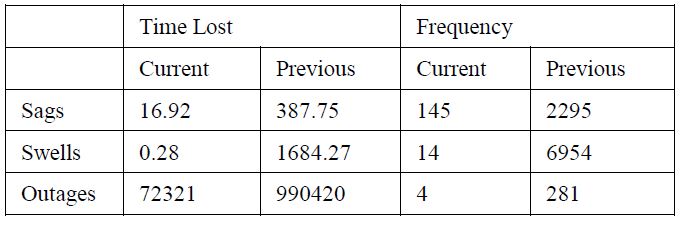
Table III summarize the lost time in seconds and their respective frequencies. Due to the instruments malfunctions on some of substations (2014), not all data for current analysis were captured. In terms of time lost due to interruptions, previous results (2007-2009) show worse outages (990420 seconds) compared to the 2014 results with lost time of 72321 seconds. In terms of frequency of interruptions, previous results showed worse interruptions as compared to the current data. Substation Goreangab Busbar 1(583 406 s) was ranked the highest in terms of the time lost due to interruption, followed by CBD 2 (95210s) and Gough Ms Rocky Crest (69653s). Exact causes of power outages is not an area of this research, however it is assumed that it might be caused by aging of electrical equipment’s, damage to electrical transmission lines or poor maintenance.
Considering frequency of disturbances, previous results were leading with swells (6954) compared to 2014 results in which swells recorded only 14. Above all, there is a common denominator that voltage dips, swells and outages existed in both periods. This literally translates that there is a need to address these disturbances.
VI. CONCLUSIONS
From this study, a number of lessons and recommendations were derived, including the following:
- There is need for further studies on the impact of PQ in terms of engineering, economy and environmental impacts. In Namibia, PQ data is a scarce.
- There is need for comprehensive standards on PQ, especially as the nation enters deregulation market.
- Since compact fluorescent lamps are nonlinear loads which inject harmonics in an electrical system, causing network voltage distortions, further research is necessary.
- There is a need to quantify the cost incurred as a result of PQ disturbances.
- Electricity providers must provide detailed information about their PQ compliance to customers.
- The scope of continuous PQ monitoring programs should be extended to regional electricity distributors.
ACKNOWLEDGMENT
The authors would like to than the NamPower, Windhoek, Namibia, for their assistance in providing relevant information.
REFERENCES
[1] Sabin, D.D., Grebe, T.E., and Sundaram, A., “RMS Voltage variation statistical analysis for a survey of distribution system power quality performance,” IEEE PES Winter Meeting, 1999.
[2] Dorr, D.S., Point of utilization power quality study results, 1995.
[3] Gosbell, V.J., Integral Energy Power Quality Centre – Newsletter No.5. University of Wollongong, 2001.
[4] Targosz, R. and Manson, J., “Pan European LPQI Power Quality Survey”, Vienna, Italy, 2007.
[5] G. Van Dessel, “How to estimate your population and survey sample size”, 2013.
[6] A. Mohamed, H.Shareef, M.A. Hannan, A. Ayob, R. A. Begum, and M. F. Faisal, ‘Power Quality Survey for Premium Power Options in Malaysia’, 2012.
[7] Electricity Control Board, Electricity Control Board Annual Report. 2011.
[8] Parimal S. Patel, “Improved control method of UPQC for unbalanced and non-linear load conditions,” India, 2015.
[9] Sakthivel K. N., Das S. K., and Kini K. R., “Importance of quality AC power distribution and understanding of EMC standards IEC 61000-3-2, IEC 61000-3-3 and IEC 61000-3-11,” vol. 8th International Conference on Electromagnetic Interference and Compatibility (INCEMIC 2003), 423-30. 2003a.
[10] Brauner G. and Hennerbichler C., “Voltage dips and sensitivity of consumers in low voltage networks, Part 1: Contributions, CIRED” IEEE International Conference and Exhibition on Electricity Distribution, vol. 5 No. 482, 2001.
[11] Romano C. and Perli G., “Technological evolution of MV equipment technological evolution”, 18th International Conference and Exhibition on Electricity Distribution (CIRED 2005). 2005.
[12] S. Jain, S. S.Thakur, and.S. P. Phulambrikar, “Improve Power Quality And Reduce The Harmonics Distortion Of Sensitive Load,” 2012.
[13] Energy @ Work for the CEA and Technologies Inc., Power Quality-Energy Efficiency Reference Guide.
[14] E. Vilchez and J. Stenzel, “Impact of Renewable Energy Generation Technologies on the Power Quality of the Electrical Power Systems,” 22nd International Conference and Exhibition on Electricity Distribution (CIRED 2013), 10-13 June 2013, pp. 1-4
[15] Nor Asrina Binti Ramlee, Detection of Voltage Disturbances in Power Quality Using Wavelet Transforms. Universiti Tun Hussein Onn Malaysia, 2012.
[16] Electricity Control Board, Quality of Supply and Service Standards. 2004.
[17] J. Arrillaga, N.R Watson, and S. Chen, Power Systems Quality Assessment. John Wiley & Sons, 2000.
[18] ECB Namibia: seeking independent power producers, 2004.
[19] D. Francis and T. Thomas, “Mitigation of voltage sag and swell using dynamic voltage restorer,” IEEE International conference, Kottayam, 2014.
[20] D. Rajasekaran, S. Sekhar Dash, and P. Vignesh, “Mitigation of voltage sags and voltage swells by Dynamic voltage restorer,” IET International conference, Bangalore, 2011.
[21] A. Ashourpouri, M. Dargahi, and S. Nabavi Niaki, “Residential voltage dip and swell mitigation using Plug-in Hybrid Electric Vehicle in smartgrid,” IEEE power engineering conference, Hobart, 2013.
[22] M. Eskander and S. Amer, “Mitigation of voltage dips and swells in grid-connected wind energy conversion systems,” IEEE conference, Fukuoka, 2009.
[23] H. Awad and F. Blaabjerg, “Mitigation of voltage swells by static series compensator,” IEEE 35th annual conference on Power Electronics Specialists Conference, Vol.5, 2004, pp. 3505 – 3511.
[24] A. Pathan, S. Vanamane, and R. Chile, “Different control techniques of Dynamic Voltage Restorer for power quality problems,” IEEE International conference, Hougly, 2014.
[25] V. Jayalakshmi and N. Gunasekar, “Implementation of discrete PWM control scheme on Dynamic Voltage Restorer for the mitigation of voltage sag /swell” IEEE International conference, Nagarcoil, 2013.
[26] Paun M. Power Quality Monitoring. Task Force Power Quality Monitoring Kevin Niall (IE) Chair: A EURELECTRIC comments paper, 2009.
[27] Z. Kokolanski, M. Srbinovska, A. Simevski, C. Gavrovski, and D. Dimcev, “Power Quality Monitoring and Power Measurements by Using Virtual Instrumentation,” vol. ELECTRONICS, VOL. 13, NO. 1. 2009.
[28] Bilik P. “Internet-Ready Power Network Analyzer for Power Quality Measurements and Monitoring,” 2012.
[29] D. Divan, W. Brumsickle, and J. Eto, “A New Approach to Power Quality and Electricity Reliability Monitoring – Case Study Illustrations of the Capabilities of The I-GridTM System”, April. 2003.
[30] Key, T., “Diagnosing power quality – related computer problems,” IEEE Transactions on Industry Applications, Vol. 15, No.4 vols. 1979.
[31] G.T. Heydt, G.G Karady, B. Cummings, and J. Tang, “Improved application of power acceptability curves and their application to certain three-phase loads,” Journal of Electrical Machines and Power Systems, Vol. 27. 1999.
[32] M.A.S, Jamali S, and N. Ghaffarzadeh, Detection and classification of power quality disturbances using discrete wavelet transform and wavelet networks. 2010.
[33] D.O. Koval, and Leonard, J.J., Rural power profiles. 1994.
[34] Electromagnetic compatibility – Part 2.8: Environment– Voltage dips and short interruptions on public electric supply systems with statistical measurement Results, IEC Draft Technical Report – Edition 1.0, IEC 61000-2-8:2004, vols. 2002.
[35] H. Mokhtari, S. Hasani, and M. Masoudi, “Power Quality Survey in a Distribution System, Standard Procedures and Limitations,” 2007.
Manuscript received July 16, 2016, revised August 01, 2016.
A. Mubiana was enrolled as a student in MEng Industrial Engineering at the Namibia University of Science and Technology, P Bag 13388, Windhoek, Namibia.
M. Mutingi is a Senior Lecturer at the Namibia University of Science Technology, P Bag 13388, Windhoek, Namibia. He is also a Visiting Senior Research Associate at the Faculty of Engineering and the Built Environment, Johannesburg, South Africa(email: mmutingi@nust.na).
G. Gope is a Lecturer at the Namibia University of Science Technology, P Bag 13388, Windhoek, Namibia (ggope@nust.na).
C. Mbohwa is a Professor with the Faculty of Engineering and the Built Environment, Johannesburg, South Africa (cmbohwa@uj.ac.za)
ISBN: 978-988-14048-2-4
ISSN: 2078-0958 (Print); ISSN: 2078-0966 (Online)
