Published by Electrotek Concepts, Inc., PQSoft Case Study: Distribution Substation Voltage Variation Measurement Data Evaluation, Document ID: PQS1007, Date: October 15, 2009.
Abstract: This case study presents a voltage variation data analysis for a 12.47 kV substation monitoring location for a three-month period. The analysis included trends of the rms voltage and unbalance and statistical analysis of the rms variation events. The results of the analysis showed that most of the events were short duration voltage sags. Constant voltage transformers, coil-lock devices, magnetic synthesizers, and a number of power-electronic based power conditioners may be used for protection against voltage sag events.
INTRODUCTION
A voltage variation measurement analysis case study was completed for the 12.47 kV utility system shown in Figure 1. The utility substation included a 20 MVA, 161 kV/12.47 kV step-down transformer and a number of distribution feeders that supplied a mix of residential, commercial, and light industrial customers. In addition, one of the feeders had a switched 600 kVAr power factor correction capacitor bank.
MEASUREMENT RESULTS
The three-month monitoring period was from January 1, 2009 thru March 31, 2009. The power quality instrument used for the voltage variation measurements was the Dranetz-BMI Encore Series™. The instrument samples voltage at 256 points-per-cycle, current at 128 point-per-cycle, and follows the IEC 61000-4-3 method for characterizing measurement data. The measurement and statistical analysis was completed using the PQView® program.
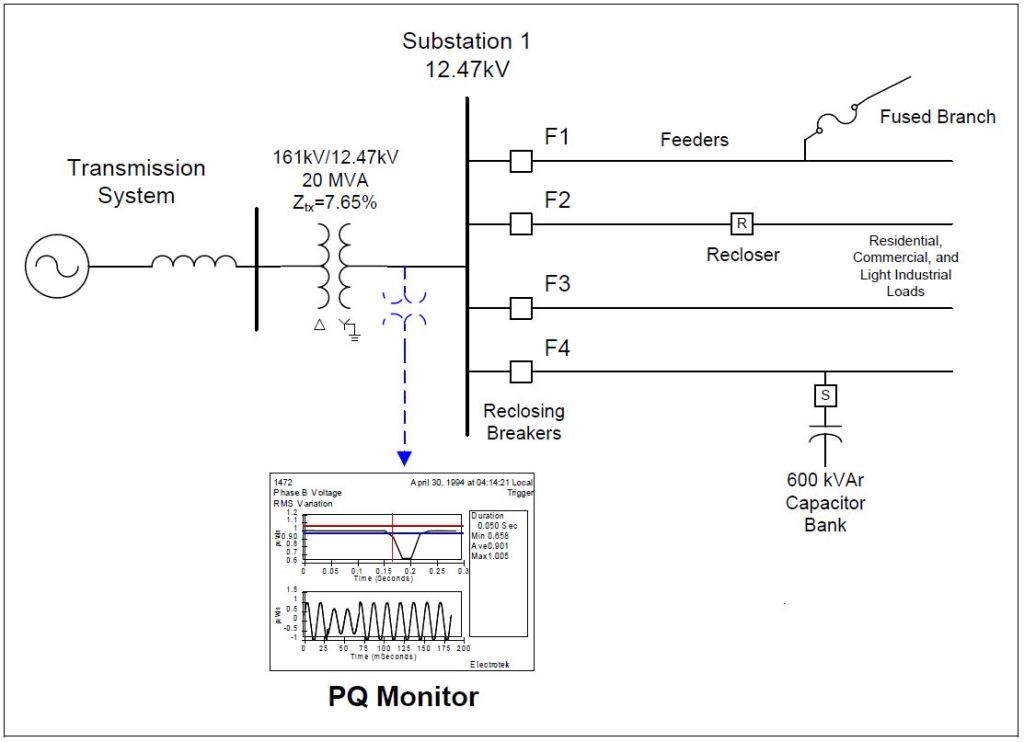
Figure 2 shows the measured rms voltage regulation trend on the 12.47 kV substation bus during the three-month monitoring period. One pole-mounted 600 kVAr distribution feeder capacitor bank was switched on-and-off each day using time clock controls in an attempt to maintain a relatively constant voltage profile. Statistical analysis of the 25,520 individual steady-state measurements yielded a minimum rms voltage of 12.427 kV, an average voltage of 13.022 kV, and a maximum voltage of 13.499 kV. In addition, the CP95 value was 13.277 kV (106.5% of nominal). CP95 refers to the cumulative probability, 95th percentile of a value.
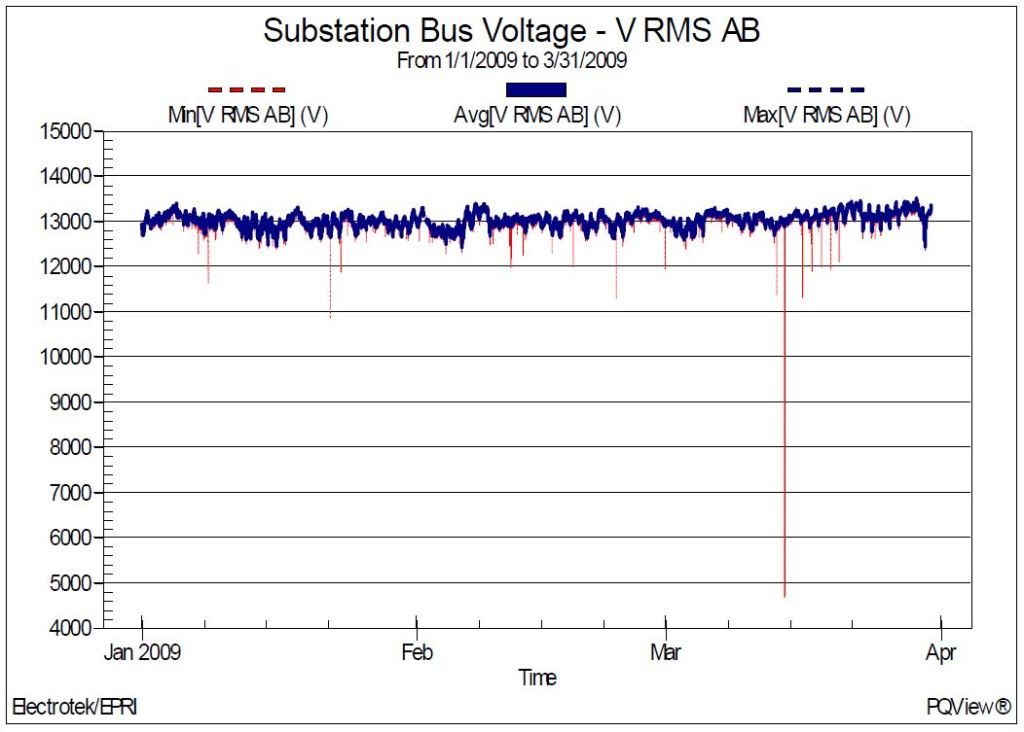
Figure 3 shows the measured negative sequence voltage unbalance trend on the 12.47 kV substation bus during the three-month monitoring period. Statistical analysis of the 25,520 individual steady-state measurements yielded a minimum value of 0.244%, an average value of 0.492%, a maximum value of 0.894%, and a CP95 value of 0.629%.
Voltage unbalance is a steady-state quantity defined as the maximum deviation from the average of the three phase voltages or currents, divided by the average of the three phase voltages or currents, expressed in percent. Voltage unbalance can also be quantified using symmetrical components. The ratio of the negative sequence (or zero sequence) component to the positive sequence component is used to specify the percent unbalance. The negative sequence (or zero sequence) voltages in a power system generally result from unbalanced loads causing negative sequence (or zero sequence) currents to flow.
The primary source of voltage unbalance less than two percent is unbalanced single-phase loads on a three-phase circuit. Voltage unbalance can also be the result of capacitor bank anomalies, such as a blown fuse on one phase of a three-phase bank. Severe voltage unbalance (greater than 5%) can result from single-phasing conditions. Voltage unbalance is most important for three phase motor loads. ANSI Std. C84.1 recommends that the maximum voltage unbalance measured at the service entrance under no load conditions should be 3%. Voltage unbalance greater than this value can cause significant motor heating and subsequent failures. Unbalance detection circuits may be used to protect induction motors from this condition.

Solutions to voltage unbalance include balancing single-phase loads (both utility and customer) on three-phase circuits, minimizing system impedance differences (e.g., transmission line transposing), and utilizing power electronic-based power conditioning devices, such as static VAr compensators and power line conditioners.
This case summarizes an investigation of rms voltage variations. Voltage variations, such as voltage sags and momentary interruptions, are often the most important power quality concern for customers. These conditions are characterized by short duration changes in the rms voltage magnitude supplied to the customer. The impact on the customer depends on the voltage magnitude during the disturbance, the duration of the disturbance, and the sensitivity of the customer’s equipment. Although utilities continuously strive to provide reliable power to their customers, a number of normal operating conditions may cause voltage variation events.
Voltage sags and momentary interruptions are inevitable on the electric power system. Many of these variations occur during faults on the power system, and since it is impossible to eliminate the occurrence of faults, there will always be voltage variations on customer systems. Other sources of voltage variations include unbalance, induction motor starting, and voltage flicker. Table 1 shows the rms variation event summary listing for the three-month monitoring period. The table shows the date-and-time for each event, as well as the phase-to-neutral voltage magnitude in both volts (kV) and per-unit and the event duration in both seconds and cycles.
Figure 4 shows the corresponding waveform and rms characteristic for the worst-case voltage sag event measured during the monitoring period (Event #9). The magnitude of the voltage sag was 44.3% and the duration was 5 cycles. The voltage sag occurred during a thunderstorm. It was caused by a short-duration fault and subsequent fuse clearing on one of the distribution feeder branch circuits.
Table 1 – Event Listing for Measured RMS Variations
| Event Number | Event Time | Magnitude (kVφN) | Magnitude (per-unit) | Duration (sec) | Duration (cycles) |
|---|---|---|---|---|---|
| 1 | 1/8/2009 11:47:27.3300 | 5.587 | 0.776 | 0.058 | 3.5 |
| 2 | 1/22/2009 06:25:56.4200 | 5.863 | 0.814 | 0.058 | 3.5 |
| 3 | 1/27/2009 10:02:34.2140 | 5.943 | 0.825 | 0.075 | 4.5 |
| 4 | 1/27/2009 11:23:22.8930 | 6.136 | 0.852 | 0.067 | 4.0 |
| 5 | 1/28/2009 11:12:27.8920 | 5.631 | 0.782 | 0.092 | 5.5 |
| 6 | 2/1/2009 07:55:20.5900 | 6.401 | 0.889 | 0.175 | 10.5 |
| 7 | 2/11/2009 15:27:45.3340 | 6.146 | 0.854 | 0.158 | 9.5 |
| 8 | 3/13/2009 12:50:27.6560 | 5.132 | 0.713 | 0.075 | 4.5 |
| 9 | 3/14/2009 09:39:49.0670 | 3.189 | 0.443 | 0.083 | 5.0 |
| 10 | 3/14/2009 10:59:51.2400 | 3.708 | 0.515 | 0.117 | 7.0 |
| 11 | 3/24/2009 15:22:58.9810 | 6.436 | 0.894 | 0.108 | 6.5 |

When there are a significant number of events, it is generally not desirable to show the results for each individual measurement. One method for summarizing rms variation event data is to graph the magnitude and duration data on one single scatter plot. This method may also include an equipment tolerance (e.g., CBEMA) overlay. Figure 5 shows a summary of the events listed in Table 1 along with a CBEMA overlay. The graph also shows the number of events that are outside the equipment sensitivity characteristic.

Voltage variation indices may be used to assess the service quality for a particular customer or utility system. One commonly used benchmarking value is known as SARFI, which stands for System Average RMS Variation Frequency Index. SARFI represents the average number of specified rms variation measurements that occurred over the assessed period. For example, SARFI70 is a measure of the number of voltage sags that can be expected with a minimum voltage below 70%. Another popular use of SARFI is to define the threshold as a curve. For example, SARFICMEBA would represent the number of rms variation events outside the commonly used CBEMA voltage tolerance envelope. The CBEMA curve was originally developed by the Computer Business Equipment Manufacturers Association. The curve was first published in IEEE Std. 446-1995.
The calculated SARFI values for the three-month monitoring period are summarized in Table 2. The SARFI90 value of eleven can be determined by counting the number of events in Table 2 with a voltage magnitude below 90%. In addition, the SARFICMEBA value of four that is shown in the table corresponds to the data previously shown in Figure 5.
Table 2 – Summary of RMS Voltage Variation SARFI Values
| SARFI-CBEMA | SARFI-ITIC | SARFI-SEMI | SARFI-90 | SARFI-70 | SARFI-50 | SARFI-10 |
|---|---|---|---|---|---|---|
| 4 | 2 | 1 | 11 | 2 | 1 | 0 |
Voltage sags are momentary undervoltage conditions. They are characterized by a decrease in the rms voltage (between 0.1 and 0.9 per-unit) at the power frequency for a duration of 0.5 cycles to 1 minute. They are typically caused by a fault somewhere on the power system. The voltage sag may occur over a significant area while the fault is actually on the system. As soon as a fault is cleared by a protective device (e.g., fuse), voltage generally returns to normal on most parts of the system, except the specific line or section that was actually faulted. The voltage magnitude during the fault is influenced by system characteristics, system protection practices, fault location and type, and system grounding.
Figure 6 shows the rms variation magnitude histogram for the three-month monitoring period. The cumulative frequency characteristic shows that a majority of the events had voltage magnitudes greater than 70%. Figure 7 shows a three-dimensional cross tabulation view of the rms variation measurements captured during the monitoring period and summarized in Table 1. The figure illustrates that a vast majority of the events had voltage magnitudes between 70-90% and durations that were less than five cycles.
The measurement results and customer equipment sensitivity were used to determine the appropriate mitigation alternatives. Equipment sensitivity is the primary factor that determines if a voltage variation event will disrupt a customer load or process. Some loads may be sensitive to just the magnitude of a voltage variation event, while other loads may be sensitive to both the magnitude and duration of the event.


Power conditioning alternatives for voltage sags and momentary interruptions include a number of alternatives for utilities, customers, and equipment manufacturers. Determining which devices of an electrical load or process are sensitive to voltage variations will allow the selection of the appropriate type and rating for the power conditioner(s).
Modifications to the design of sensitive customer equipment may be the least expensive option, however, it is not always practical to implement. Modifying the utility system may also not be practical and may be, indeed, quite expensive. Power conditioning equipment, applied between the utility system and sensitive customer equipment, may be the most cost effective solution for voltage variation problems.
It is possible to make the equipment being used in customer facilities less sensitive to voltage sags and momentary interruptions. Clocks and controls with low power requirements can be protected with a small battery or large capacitor to provide greater ride-through capability. Motor control relays and contactors can be selected with less sensitive voltage sag thresholds. Controls can be set less sensitive to voltage sags unless the actual process requires an extremely tight voltage tolerance. This solution requires coordination with equipment manufacturers but the trend seems to be in the direction of increased ride-through capability. For instance, most programmable logic controllers use switched-mode power supplies that have a ride-through capability of about four cycles. Therefore, it should not be necessary to trip these controllers under short voltage sag conditions.
Since a vast majority of the measured rms variations events were short-duration voltage sags, the residential and commercial customers can use uninterruptible power supplies for their power conditioning solution. An uninterruptible power supply (UPS) is a power-electronic based device that provides a continuous voltage to a load by supplying power from a separate source when utility power is lost. A UPS is often used to protect computers, telecommunication equipment, or other critical electrical equipment where an unexpected power disruption could cause severe business disruption or data loss. A standby UPS (a.k.a., off-line UPS) with a ride-through range of 5 to 20 minutes will protect the sensitive equipment from most of the voltage sag events. This type of device is the most common configuration for commodity UPS units available at retail stores for the protection of small computer and entertainment system loads.
Industrial customer mitigation options include constant voltage transformers (CVTs), coil-lock devices, uninterruptible power supplies, magnetic synthesizers, dynamic sag correctors (DySC), dynamic voltage restorers (DVR), and motor-generator sets. Customers have the option to protect their equipment from voltage variation phenomena at a number of locations, including the point-of-entry and point-of-use. Generally, a combination of point-of-entry and point-of-use devices will provide the greatest level of protection.
Many voltage sag conditions for the industrial customers can be addressed by using constant voltage transformers. CVTs are especially attractive for constant, low power loads. Variable loads, especially with high inrush currents, present more of a problem for CVTs because of the tuned circuit on the output. A typical CVT circuit is shown in Figure 7. CVTs are an attractive option because they are relatively maintenance free, with no batteries to replace or moving parts to maintain. They are particularly applicable for industrial process control devices such as programmable logic controllers, motor starter coils, and the electronic control circuits of adjustable-speed drives. The negative aspects of CVT applications are efficiency (heat), size, weight, and availability in limited rating ranges. In addition CVTs have difficulty with dynamic and harmonic rich loads often requiring significant over rating. Over rating provides better performance and sag correction, but with a penalty of less efficiency, size, weight, and cost.
SUMMARY
This case study presents a voltage variation data analysis for a 12.47 kV substation monitoring location for a three-month period. The analysis included trends of the rms voltage and unbalance and statistical analysis of the rms variation events. The results of the analysis showed that most of the events were short duration voltage sags. Constant voltage transformers, coil-lock devices, magnetic synthesizers, and a number of power-electronic based power conditioners may be used for protection against voltage sag events.
Voltage sag protection may be implemented on a single coil or piece of equipment. Correction may also be chosen for large portions of a facility or even for the entire facility. The selection of voltage sag mitigation will consist of engineering aspects as well as a cost versus benefit evaluation. The most cost-effective customer power conditioning solutions for this case were uninterruptible power supplies and constant voltage transformers.
The case showed that power quality monitoring can be used to characterize voltage variations at various locations on utility and customer power systems. The length of the monitoring period is dependent on the nature of the power quality problem. For example, voltage flicker trends may be collected over several days or weeks, while voltage sag and momentary interruption levels may need to be monitored for months, or even years to show the influence of seasonal variations. The monitoring period for this study was three months. Additionally, the objectives of a monitoring program determine the choice of measurement equipment, method of collecting data, disturbance thresholds, data analysis requirements, and the overall effort required.
REFERENCES
- IEEE Recommended Practice for Monitoring Electric Power Quality,” IEEE Std. 1159-1995, IEEE, October 1995, ISBN: 1-55937-549-3.
- IEEE Recommended Practice for Emergency & Standby Power Systems for Industrial & Commercial Applications (IEEE Orange Book, Std. 446-1995), IEEE, ISBN: 1559375981.
- American National Standard for Electric Power Systems and Equipment – Voltage Ratings (60Hz), ANSI Std. C84.1-2006, National Electrical Manufacturers Association, December 2006.
RELATED STANDARDS
IEEE Std. 1159, ANSI Std. C84.1, IEEE Std. 446
GLOSSARY AND ACRONYMS
ASD: Adjustable-Speed Drive
CF: Crest Factor
DPF: Displacement Power Factor
PF: Power Factor
PWM: Pulse Width Modulation
THD: Total Harmonic Distortion
TPF: True Power Factor
