Published by S. Bhattacharyya1, S. Cobben2, & W. Kling, Electrical Engineering Department, Eindhoven University of Technology, 5600 MB Eindhoven, The Netherlands.
E-mails: s.bhattacharyya@tue.nl1; sharmirb@yahoo.com2
Published in IET Generation, Transmission & Distribution. Received on 24th May 2011 – Revised on 29th February 2012, doi: 10.1049/iet-gtd.2011.0801
Abstract
Modern customers use many electronics devices that are quite sensitive to the quality of power supply. Voltage dip is an important power quality (PQ) issue that can cause damage to various customers’ devices and might lead to partial or complete interruption of the operation of an installation. Hence, a customer should know the approximate number and types of voltage dips that can happen at the point of connection (POC) so that he can take preventive measure to protect his installation from voltage dip-related problems. In the recent years, the EN50160 standardisation committee has developed a classification methodology to define voltage dips. The committee also recommended that voltage dip-related responsibilities should be clearly defined in the standard to solve disagreements among the different parties in the network. In this study, first voltage dip simulation is done on a typical medium voltage (MV) network, and approximate number of events in a year at a customer’s POC is estimated. Furthermore, the guidelines are proposed to distinguish voltage dip-related responsibilities of the involved parties in the network. Finally, a case study is described in which the proposed guidelines about voltage dip-related responsibilities are applied.
1 Introduction
At an industrial customer’s installation, many sensitive devices are connected. Those devices might have different sensitivities towards voltage dips and can be distinguished by their individual voltage–tolerance performance curve. The most widely used voltage–tolerance curves are the CBEMA (Computer Business Equipment Manufacturers Association) curve, the ITIC (Information Technology Industry Council) curve and the SEMI 47 (Semiconductor Equipment and Materials International Group) curve [1].
For large industries (such as: semiconductor industries, paper plants, steel industries etc.), voltage dips are considered as critical problem as the whole plant operation might get disrupted and the process has to be restarted. Characterisation of various types of voltage dips and assessment of their impacts on equipment sensitivity is a complex and time-consuming process. A device may respond differently depending on the dip type, magnitude, duration, point on wave of dip initiation and ending, phase shift during dip event, dip energy etc. The analysis of the CIGRE/CIRED JWG 4.110 concluded that ‘process immunity time’ (PIT) is an important indicator for designing a customer’s process efficiently and to minimise process outages because of voltage dips [2]. When a customer chooses low process immunity devices for his installation, then he will not be able to protect the process from various voltage dip events. On the contrary, when he selects the high-process immunity, it means that he has to invest more money for the connected devices to make his
installation more immune to different voltage dip events. This choice depends on customer’s installation vulnerability to voltage dips and associated financial consequences. The main contributions of the paper are related to
- Estimation of the annual number of voltage dips in a medium voltage (MV) network in the Netherlands using the field measurement results for high-voltage (HV) network and yearly failure statistics of the MV network components.
- Suggestions for planning-level and compatibility-level values for voltage dips in the MV networks of the Netherlands.
- Discussion on voltage dip-related responsibilities of the involved parties in the power system. This will be supported by a practical case study.
2 Standards on voltage dips
The IEC/TR 61000-2-8 [3] report gives statistical measurement results on voltage dips and short interruptions in different countries of the world. This report stated that the frequency and probability of occurrences of voltage dips at any voltage level are highly unpredictable (both in time and place) as it varies depending on the type of network and the point of observation. In the industries, the standards such as SEMI F42, CBEMA, ITIC, etc are used for
defining immunities of various sensitive devices against voltage dips at the installations. Different immunity classes are also specified in the IEC 61000-4-11 standard [4]. The CIGRE/CIRED JWG C4.110 proposed immunity classes for equipment against balanced and unbalanced voltage dips. In the recent years, the CENELEC members proposed a voltage dip classification table (see Table 1) for the EN50160 standard [5] that can be combined with the product class definition for immunity tests of IEC 61000-4-11
standard. The following holds for Table 1:
- Areas covered by cells ‘A1 + A2 + B1 + B2’ are illustrative for equipment tested as ‘class 2’ (light yellow shaded areas) of the product standards.
- Areas covered by ‘A1 + A2 + A3 + A4 + B1 + B2 + C1’ are valid for equipment tested as ‘class 3’ (all the shaded areas with yellow and green shades) of the product standards. This class of devices has a higher immunity level than that of ‘class 2’ devices.
Table 1 Integrating voltage dip product classification with the EN50160 [5]

The classification of voltage dip events is useful and important for regulation purposes. It can be used as an evaluating tool to measure the network’s voltage dip occurrence frequency over a certain time period. Also, it hypothetically gives a responsibility sharing border between the network operator and the customer/equipment manufacturer. However, standardising on voltage dip limit number is a complex issue as it largely depends on topology of the network, and hence requires a lot of analysis to establish it for voltage quality management purposes.
3 Estimating yearly voltage dip profile for the Dutch grids
In the Netherlands continuous power quality (PQ) measurement is done only in the extra-high and highvoltage networks. Table 2 shows the maximum and average number of dips recorded at a measuring site in the HV network during 2006–2009 [6–9].
The number shown in each cell for each year represents the maximum amount of dips registered at one of the measuring sites. The numbers shown within the brackets of each cell in Table 2 indicate the average number of voltage dips recorded at all measurement sites (e.g. 20 measurement locations in HV network of the Netherlands). From Table 2, the average number of voltage dips per year at a HV site is found approximately 8 based on 4 years measurements. On the other hand, the maximum number of events indicated in the cells had (probably) occurred in different measuring sites. For a worst case scenario, if it is considered that all those maximum number of events mentioned in the Table 2 has occurred at one particular site, then the number of maximum voltage dips would be 52. However, such a situation seldom occurs in reality.
Next, simulation is done on typical MV network model using ‘Power Factory’ software. It is done to find out yearly voltage dip profile of the network because of various fault events within the MV network itself. A typical MV substation consists of 15–20 outgoing feeders and each feeder is of 12 km length on average. Almost every MV feeder in the Dutch network consists of both primary and secondary protection devices. Fig. 1 shows a typical MV feeder and the location of its primary and secondary protections. An industrial customer is assumed to be located at ‘Node 7’ at which the yearly voltage dip statistics will be estimated. In the simulated network, total 15 outgoing feeders are present at the primary MV substation. The response time of the secondary protection is taken as 300 ms and that of the primary protection device is 600 ms.
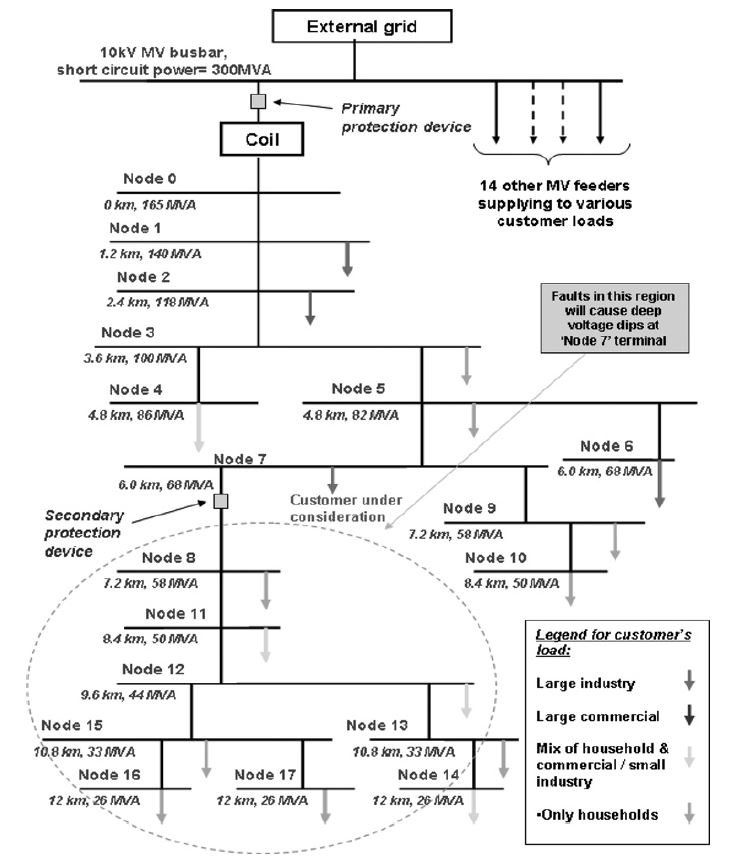
Fig. 1 MV network used for voltage dip simulation
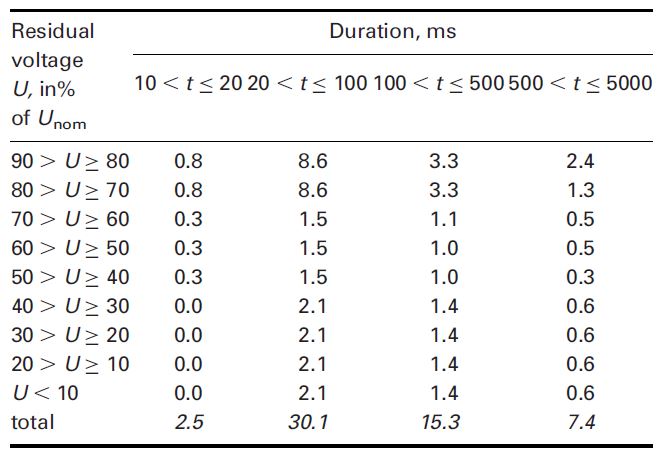
From the network’s national reliability report of the Netherlands [10], it is found that the failure rate of a MV feeder is 0.0243 /km of cable/year and for a MV terminal is 0.012/connection/year. Also, it is assumed that in the MV network 50% faults are of single-phase, 25% are of two-phase and 25% are of three-phase faults [11]. By using the failure data and fault simulation of the MV network, the voltage dip profile at a MV customer’s terminal can be estimated. The faults generated below ‘Node 7’ are cleared by the secondary protection and the customer at ‘Node 7’ faces a deep voltage dip at his terminal. However, when a fault occurs above ‘Node 7’ of that feeder, it is cleared by the primary protection and all customers of the feeder suffer interruption. The annual voltage dip profile at a typical MV customer’s POC (‘Node 7’) is estimated in Table 3. It can be seen that a MV customer is (statistically) expected to face annually 2.5 voltage dip events owing to the various faults in the MV network. Bhattacharyya [12] describes the detailed procedure to estimate voltage dip numbers in the MV networks.
Table 2 Maximum (average) number of voltage dips recorded at a site (all sites) in the HV network

Table 3 Estimated number of dips at a MV customer’s POC due to faults in MV networks

Further, it is assumed that all faults occurring in the HV network are propagating to the MV network. Therefore total number of voltage dips at a MV customer’s POC can be calculated by combining the values of Tables 2 and 3. It can be remarked that the voltage distributions of these two tables are not fully identical. Therefore adjustments are done for the values of Table 2 (such as value indicated in the cell 90 . U ≥ 70 and 10 , t ≤ 20 is divided equally to obtain the values for 90 . U ≥ 80 and 80 . U ≥ 70 with 10 , t ≤ 20). Hence, Table 4 is obtained that indicates average number of voltage dips at a MV customer’s POC in the Netherlands. It is found that there are on average 11 voltage dips/year at a MV customer’s terminal and approximately three events fall in the danger zone, outside the shaded areas of Table 4 (e.g. excluding the areas covered by the green and yellow cells).
Table 4 Average number of dips estimated at a MV customer’s POC

Similarly considering maximum occurrence of dip events (for each cell of Table 2) at a HV site and combining them with the MV simulation results (Table 3), another voltage dip profile is found at a MV customer’s POC (see Table 5). This represents the worst-served (fictitious) site in the MV network. Under such a condition, a MV customer may face a maximum of 55 voltage dips in a year out of which approximately 22 can cause process interruptions when the installation is designed for ‘class 3’ immunity requirements. The numbers found in each cell of Table 5 can be used as an indicative value for the maximum occurrence of voltage dip events at a POC, whereas Table 4 can be used as reference (average) number of voltage dip events/year at a typical MV customer’s POC in the Netherlands.
Table 5 Maximum number of dips estimated at a MV customer’s POC
The probability of occurrence of voltage dip events at a MV customer’s POC can be estimated based on ‘Poisson’s distribution’ function with the assumptions that the occurrence of events is random and the consecutive events are independent of each other [11]. This is a discrete distribution function and calculates the probability of a number of events occurring in a fixed period of time when the average rate of events is known. Fig. 2 shows that when a POC in the MV network registers an average 11 dips/year, then for 95% of the situations the number of voltage dips of that site will be limited to 16 with the maximum probability value 22 dips/year.
Further, to estimate a worse situation in the network, it is assumed that each of the MV customers faces yearly 22 voltage dips. Using the ‘Poisson’s distribution’ function again, it can be found that the number of voltage dips at a MV customer’s POC will be restricted to 30 for 95% of the time in a year (see Fig. 2). In the field measurement in Dutch networks, it was found that most of the MV sites experience less than 15 voltage dips in a year. With the above information, the annual voltage dips numbers at an average MV site in the Netherlands should be limited to 15 (which can be treated as ‘planning-level value’). When the number at a MV site reaches 30 dips in a year, it will be considered as an alarming situation for the network operator (thus can be treated as ‘compatibility level value’).

Fig. 2 Probability of annual occurrence of voltage dips at a MV installation
4 Estimating yearly process failure frequency at a MV customer’s POC owing to voltage dips
An important step in voltage dip performance analysis is to identify the customer’s process performance requirements.
The customer has to decide about the acceptable maximum number of process stoppage possibilities in a year owing to voltage dips. First step is to identify the PIT by including all devices in the process chain and estimate the maximum depth and duration of a voltage dip for which the process can survive. When a voltage dip occurs at a customer’s installation, one or more sensitive devices may trip immediately. However, because of recovery actions they may come back in operation and the process will not be interrupted. By analysing each device and its importance to the whole process chain, the process immunity time and respective voltage tolerance curve for the complete process can be determined. It is also possible that by incorporating some changes in the production chain such as modifying some devices with high immunity class or implementing a mitigation measure in the installation, the process immunity to voltage dips can be increased. The desired immunity requirement for the selected process device can be obtained after analysing the network’s voltage dip profile. It is to be noted that with high immunity requirements of a device, the cost of manufacturing also increases.
As found from Table 4, a typical MV customer can expect yearly on average 11 voltage dips/year at his POC, out of which approximately three events fall in the danger zone, outside the shaded areas of Table 4 (e.g. excluding the areas covered by the green and yellow cells). In an extreme situation, a MV customer can face a maximum of 55 voltage dips in a year out of which approximately 22 can cause process interruptions when the installation is designed for ‘class 3’ immunity requirements (as found from Table 5).
5 Defining responsibility sharing borderlines on voltage dips
PQ mitigation measures can be applied to prevent voltage dip related inconveniences at an installation. As voltage dip mitigation is generally a costly issue, it requires coordinated actions to reach an optimum decision. To implement clear regulation in the electricity supply, the equipment’s performance standard (such as the voltage–time immunity characteristic) should be coordinated with the voltage quality requirements of the network. Such an approach in standards would be useful for all involved parties in the system to minimise voltage dip-related inconveniences. Fig. 3 gives a proposal to define voltage dip-related responsibilities of the three involved parties: the network operator, the customer and the device manufacturer.

Fig. 3 Responsibility borders for different parties about voltage dips in the network
The network operator is responsible to provide information to the customers (when enquired) on various voltage quality parameters such as approximate number of voltage dips on annual basis and their expected characteristics etc. In Table 4, a voltage dip table as per the EN50160 standard format is proposed for medium voltage network in the Netherlands. This gives indication on average number of expected dips on an annual basis, and their respective magnitude and duration. With such information, a network operator will have more insight about the voltage quality performance of his network. If the network operator thinks that a customer’s requirement is too high than the normally offered quality of the supply, he should discuss with the customer before a supply connection agreement is made.
Eliminating voltage dip event completely in the network is not realistic (mainly because of unpredictable natural events); but with robust network design the number of dips can be restricted. Voltage dips of small magnitude with short duration occur relatively frequently in power systems mainly owing to single phase (temporary) faults and are difficult to eliminate [13]. These dips generally do not have major impact on the customer’s POC. However, a customer who is vulnerable to such type of dips should take appropriate measures by himself in protecting the installation. A sensitive customer should also define his process’s typical immunity level based on the voltage–time (‘V-T’) performance of each
process device. A process failure can be affected by various factors. Therefore the customer should recognise the uncertainty region where the process may survive or fail depending on certain circumstances. To avoid voltage dip related problems, he can install a mitigation device, or can use highly immune device components that are less sensitive to voltage dips. The network operator, on the other hand, should provide the customer with the expected number (planning-level value) of all types of voltage dips at the POC, as suggested in this paper. If the customer suspects that his installation is vulnerable to those types of dips, he
can request the network operator for a special connection that fulfills the desired PQ requirements of his installation. This request may be treated as a ‘special contract’. With such a contract, if the network operator fails to meet the agreed commitment, he will be responsible to pay for the solution and the costs involved.
Device manufacturers, on the other hand, should test their devices for different test voltage conditions to define voltage dip immunity characteristics. While selling a device, they should declare the immunity level of their product in the datasheet. If the device still fails to meet the guaranteed performance that is specified in its datasheet, the device manufacturer will be responsible to solve the problem.
The proposed responsibility sharing guidelines proposed in this paper can be explained by a case study conducted at an industrial customer’s POC. Fig. 4 shows the results of a voltage dip measurement campaign conducted at an automobile customer’s installation over a 5 years period [14].
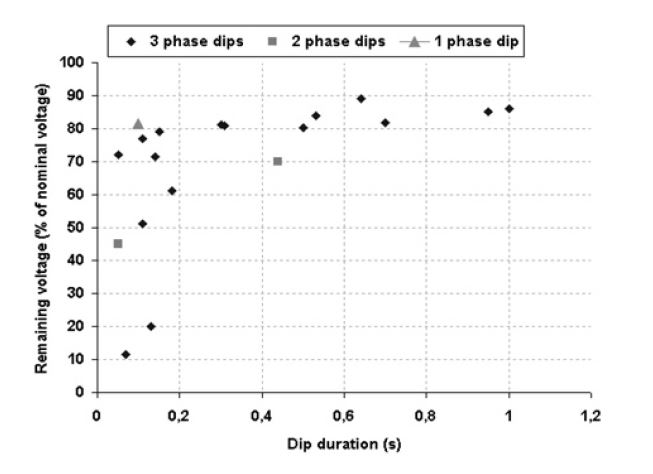
Fig. 4 Recorded voltage dip-data at the automobile customer’s POC (in 5 years period)
From the measurement records, it can be noticed that many three-phase voltage dips have occurred at the customer’s POC. Most of the three-phase dips were of either small duration or small magnitude (voltage dip with a residual voltage of 80% or more). Those types of voltage dips did not cause much damage to the customer’s process operation, as the connected devices (and components) were found immune to withstand short duration and small magnitude voltage dips. However, it was noticed that the customer still suffered approximately three process outages in a year that caused significant financial losses.
At the considered customer’s installation, there are three departments (the metal operation, spray coating, and assembly) where process interruptions occurred owing to voltage dips. Fig. 5 shows the schematic view of the main process operational chain of the considered ‘automobile’ industry along with its detailed assembly process layout. The damage was due to the failures of many programmable logic controllers and variable frequency drives present in the process. The considered customer lost approximately one million euro during the observation period, with an average of E54,000 per interruption [14]. To minimise voltage dip-related financial losses, various mitigation (immunisation) options can be adopted. A modification in the network such as creating a separate high capacity cable for the customer can influence the number and type of voltage dips at the POC. However, such a mitigation measure in the network is a quite expensive investment and the network operator will not be willing to pay for it easily. In most of the cases, the customer needs to implement a mitigation method in his installation at his own expenses. If the network operator provides the customer with the statistics of voltage dips and an approximate number of occurrences of voltage dips at the POC, the customer can accordingly take action to tackle voltage dip problems at the installation. It is also possible to immune the entire site or the whole process chain against various types of voltage dips, but this measure requires significant investments. In contrast, adapting immunisation for a part of process-chain or a sub-process will be more cost effective and less time-consuming solution. While analysing this case, it was observed that ‘drive’ sub-process of the assembly is the bottleneck for restarting the process after a voltage dip event leading to process interruption. The restarting cost of this process accounts for a significant percentage of the total financial losses related to the voltage dips. Therefore attention was paid to this sub-process to immunise it against the voltage dips.

Fig. 5 Schematic of main departments and the detailed assembly process
A sensitive sub-process can be protected against all voltage dips by using an uninterrupted power supply (UPS) or a flywheel. In this case, customer found that installing UPS is the most cost-effective option in comparison to flywheel. Another option can be to protect the sensitive process against the most frequently occurring dip events only. Installing a dynamic voltage restorer (DVR) can provide voltage support (typically up to 30% of the nominal voltage, for one second) during a voltage dip event. Thus, almost 2/3 of all interruptions owing to voltage dips can be avoided by installing DVR in the ‘assembly’ process. The considered installation did not encounter any financial damage when the residual voltage is more than 82% of the nominal voltage. With the DVR installed, it can provide voltage support of another 30% of the nominal voltage. Thus, the installation will be immune to voltage dip with a residual voltage of 52% of the nominal value or more, as shown in Fig. 6.

Fig. 6 Installation protected by a DVR against voltage dips [15]
It was also estimated in the analysis that the investment for a DVR is almost half of the UPS system. A cost–benefit analysis was done for the customer to select the most cost effective and optimum solution. It was found that installing DVR for the whole assembly chain is the economically optimum. It gives the lowest pay-back period and a positive net present value (NPV) when the minimum lifetime of the installation is taken as 5 years [14].
In the present standards, no limiting value is given regarding the number of voltage dip events at a customer’s POC. Therefore a network operator is not directly responsible to restrict the number of voltage dips in the network. Presently, the customers with sensitive processes take mitigation measures by themselves to minimise voltage dip-related problems at their installations. In many cases, customers implement PQ mitigation device or improve immunities of their installation against voltage dips. The customer of the considered case has also adapted an economically optimum mitigation method (DVR) at his
installation to minimise the number of voltage dips causing process interruption. Regulation on the maximum number of voltage dips (of various magnitudes and durations) at a POC could be introduced in the future electricity business to minimise the techno-economic losses of the customers. In this paper, approximate numbers of voltage dips in a year (and the approximate number of dips in each cell of the EN50160 voltage classification table) at a MV customer’s installation are estimated. The network operators in the Netherlands can use this information as reference values while making a PQ contract/agreement with a MV industrial customer. On the other hand, the customer will also be aware of the indicative number of voltage dips that he can face annually at his POC. This will help the customer to design his installation in a more efficient way.
In specific cases, the costs of mitigations can also be shared between the customer and the network operator, based on their mutual agreements.
Presently, many countries of the world are working towards the introduction of voltage quality regulation and identifying the responsibilities of involved parties in the network. In Italy, PQ measurement campaigns are organised and PQ costs for the customers are estimated [16]. Regarding voltage dip, the EN50160 standard methodology was followed to estimate the numbers of dips, process immunity and related outage costs for customers. Further, the responsibilities of the network operator and customers are identified that are comparable with the guidelines proposed in this paper. In South Africa, voltage dip-related responsibilities are specified in their standard [17]. In Sweden, a proposal is given to differentiate various types of voltage dips occurring in different voltage levels [18]. The Swedish energy regulators have defined two parameters to identify the impacts of voltage dips: a maximum permissible event severity (in terms of voltage and duration); and a maximum number of events.
6 Conclusion and further research
In this paper, the annual voltage dip profiles of Dutch networks are estimated. First, the dip profile is found for the HV networks based on the past 4 years field measurement records. It was estimated that on average the customers connected to the HV network will face eight voltage dip events in a year. Next, the HV voltage dip information is combined with the fault statistics of the MV network components to calculate voltage dip profiles at a POC connected in the MV network. Also, the appropriate numbers of dip events in each cell of the EN50160 standard voltage dip classification table are estimated. The annual number of process failures (at a MV customer’s POC) is found out based on the process’s immunity graph and the network’s annual voltage dip profile. In a typical MV network in the Netherlands, an industrial customer can expect approximately 11 voltage dips in a year at the POC; whereas annually three process interruptions can occur when the installation is protected with ‘class 3’ immunity requirements.
Further, it is estimated that the annual number of voltage dips at an average MV site should be restricted to 15 (‘planning-level value’), whereas it will be an alarming situation when this number exceeds 30 (‘compatibility-level value’) in the MV networks of the Netherlands. Assigning a unique compatibility value in the standard for voltage dips is complex as it is largely dependent on voltage level, network type and its topology. Besides that, more research should be done to distinguish between different types of dips and their impacts to various devices and to different parties involved in the network.
Finally, a proposal is given to define voltage dip-related responsibilities for the network operator, the customer and the device manufacturer. As voltage dip mitigation method is quite costly, the decision on investment is to done with utmost care. In this paper, a case study is discussed in which the industrial customer was suffering significant monetary losses because of voltage dips. Therefore the customer performed a cost–benefit analysis for his installation to choose the optimum mitigation method. Based on the 5 years recorded data on voltage dip at the POC, the customer took a cost-effective measure to protect his installation. By that measure, majority of the voltage dips could be avoided that were causing damage to the customer’s installation. Hence, it can be concluded that information on the appropriate number of dips (of different categories) from the network operator would be useful for a customer to design his installation more efficiently and cost effectively.
7 Acknowledgment
The work of this paper is part of the research project ‘Voltage quality in future infrastructures’ (‘Kwaliteit van de spanning in toekomstige infrastructuren (KTI)’ in Dutch), sponsored by the Ministry of Economic Affairs, Agriculture and Innovation of the Netherlands.
8 References
- Caramia, P., Carpinelli, G., Verde, P.: ‘Power quality indices in liberalized markets’ (John Willey & Sons Ltd, 2009)
- Bollen, M., Stephens, M., Djokic, S., et al.: ‘Voltage dip immunity of equipment and installations.’ Prepared by the members of CIGRE/CIRED/UIE Joint Working Group C4.110, April 2010
- IEC 61000-2-8: ‘Electromagnetic compatibility (EMC)–environment– voltage dips and short-circuit interruptions on public electric power supply systems with statistical measurement results’ (International Electrotechnical Commission, 2002, 1st edn.)
- IEC 61000-4-11: ‘Testing and measurement techniques-voltage dips, short interruptions and voltage variations immunity tests’ (Published by International Electrotechnical Commission, 2004, 2nd edn.)
- Botton, S., Delfanti, M., Vailati, R.: ‘The new edition of EN50160: possible further evolutions’. Presented in the Workshop on Voltage Quality Regulation During the Int. Conf. on Harmonics and Quality of Power (ICHQP), Bergamo, Italy, September 2010
- Luiten, R., Smeets, E.L.M.: ‘Spanningskwaliteit in Nederland in 2006’, Doc. No.: 30610502-consulting 07-1088, Arnhem, June 2007 (available in Dutch language only)
- Hesen, P.L.J., Otto, R.: ‘Spanningskwaliteit in Nederland in 2007’, Doc. no. 30713201-consulting 08-0639, Arnhem, April 2008 (available in Dutch language only)
- Hesen, P.L.J., Otto, R., Boer, J.d.: ‘Spanningskwaliteit in Nederland, resultaten 2008.’ A project of Netbeheer Nederland, Doc. no. 30913199-consulting 09-0473, The Netherlands, April 2009 (available in Dutch language only)
- Boer, J.d., Hesen, P.L.J., Otto, R.: ‘Spanningskwaliteit in Nederland resultaten 2009 (laag-, midden- en hoogspanning t/m 150 kV’, Doc. no. 30101070-consulting 10-0786, Arnhem, April 2010 (available in Dutch language only)
- Combrink, F.M., Verhees, L., Bloemhof, G.A.: ‘Betrouwbaarheid van elektriciteitsnetten in Nederland in 2008’. A project of ‘Netbeheer Nederland’, Doc. no. 30913184-consulting 09 0420, The Netherlands, May 2009 (available in Dutch language only)
- Cobben, J.F.G.: ‘Power quality – implications at the point of connection’. PhD thesis, TU/Eindhoven, 2007
- Bhattacharyya, S., Cobben, J.F.G., Kling, W.L.: ‘Assessment of the impacts of voltage dips for a MV customer’. Proc. 14th Int. Conf. on Harmonics and Quality of Power (ICHQP 2010), Bergamo, Italy, September 2010
- Ajodhia, V., Franken, B.: ‘Regulation of voltage quality–work package 4 and 5 from project quality of supply and regulation’, Ref. 30620164-consulting 07-0356, February 2007
- Lumig, M.V.: ‘Voltage dips at an automobile manufacturer, report on case studies power quality’. Published in Leonardo Energy website January 2008. Available: http://www.leonaro-energy.org
- Bhattacharyya, S.: ‘Power quality requirements and responsibilities at the point of connection’. PhD dissertation, TU/Eindhoven, 2011
- Delfanti, M., Fumagalli, E., Garrone, P., Grill, L., Schiavo, L.L.: ‘Toward voltage-quality regulation in Italy’, IEEE Trans. Power Deliv., 2010, 25, (2), pp. 1124–1133
- Koch, R., Dold, A., Johnson, P., McCurrach, R., Thenga, T.: ‘The evolution of regulatory power quality standards in South Africa (1996–2006)’. Proc. 19th Int. Conf. on Electricity Distribution (CIRED 2007), Vienna, June 2007
- Stro¨m, L., Bollen, M.H.J., Kolessar, R.: ‘Voltage quality regulation in Sweden’. Proc. 21st Int. Conf. on Electricity Distribution (CIRED 2011), Frankfurt, June 2011 626
IET Gener. Transm. Distrib., 2012, Vol. 6, Iss. 7, pp. 619–626 625 doi: 10.1049/iet-gtd.2011.0801. www.ietdl.org

What a comprehensive and insightful proposal you’ve put forth in this blog! Your thorough examination of voltage dip-related responsibility sharing at a point of connection demonstrates a deep understanding of the intricacies involved. Your ability to break down complex technical concepts into understandable terms is truly commendable, making this blog a valuable resource for both experts in the field and those looking to grasp the subject. Your dedication to addressing such a specific yet crucial aspect of electrical systems highlights your commitment to enhancing efficiency and reliability. Thank you for sharing your expertise and for taking the initiative to propose a well-thought-out framework that can potentially drive positive change in the industry. Your contribution to the field is greatly appreciated, and your blog sets a standard for thoughtful analysis and problem-solving. Looking forward to more of your insightful work in the future!
LikeLike
What an exciting and forward-looking blog post! The convergence of NASA’s innovation and generative AI design is a true testament to the cutting-edge advancements in technology. Your article does an excellent job of highlighting the significance of this collaboration and its potential impact on the future of aerospace engineering.
LikeLike