Published by Noor Asyikin SULAIMAN1, Kai Wern CHUINK1, Muhammad Noorazlan Shah ZAINUDIN1, Azdiana Md YUSOP1, Siti Fatimah SULAIMAN1, Md Pauzi ABDULLAH2, Centre for Telecommunication Research & Innovation (CeTRI), Fakulti Kejuruteraan Elektronik dan Kejuruteraan Komputer (FKEKK), Universiti Teknikal Malaysia Melaka (UTeM), Hang Tuah Jaya, 76100, Durian Tunggal, Melaka, Malaysia (1), Centre of Electrical Energy Systems (CEES), School of Electrical Engineering, Faculty of Engineering, Universiti Teknologi Malaysia (UTM), 81310 Skudai, Johor, Malaysia (2),
ORCID: 1. 0000-0003-3126-7309; 3. 0000-0001-5621-9632; 4. 0000-0002-1864-1952; 5. 0000-0001-8251-8038
Abstract. The air conditioning system is complex and consumes the most energy in the building. Due to its complexity, it is difficult to identify faults in the system immediately. In this project, fault detection and diagnosis system using decision tree classifier model was developed to detect and diagnose faults in a chilled water air conditioning system. The developed model successfully classified normal condition and five common faults for more than 99% accuracy and precision. A graphical user interface of the system was also developed to ease the users.
Streszczenie. System klimatyzacji jest złożony i zużywa najwięcej energii w budynku. Ze względu na swoją złożoność trudno jest od razu zidentyfikować usterki w systemie. W ramach tego projektu opracowano system wykrywania i diagnostyki usterek wykorzystujący model klasyfikatora drzewa decyzyjnego do wykrywania i diagnozowania usterek w systemie klimatyzacji wody lodowej. Opracowany model pomyślnie sklasyfikował stan normalny i pięć typowych usterek, zapewniając ponad 99% dokładności i precyzji. W celu ułatwienia użytkownikom opracowano również graficzny interfejs użytkownika systemu. (Wykrywanie i diagnostyka usterek w oparciu o dane dla scentralizowanego systemu klimatyzacji na wodę lodową)
Keywords: Air Conditioning System; Decision Tree; Fault Detection and Diagnosis.
Słowa kluczowe: diagnostyka, system klimatyzacji.
Introduction
The demand for heating, ventilation and air conditioning (HVAC) systems have increased dramatically in recent years. In non-residential buildings, HVAC systems utilise up to 50% of the total electricity consumption [1][2]. Therefore, their efficiencies have a significant impact on the total energy performance of these buildings [3]. The centralised chilled water air conditioning system includes components such as a chiller, cooling tower and air handling unit (AHU). Furthermore, all components are interconnected, and faults in each component may affect the performance of other components. Therefore, when the system operates in faulty conditions, it increases the energy usage of the building. It also may create thermal comfort problems among occupants and reduce the component’s lifetime [4].
Early detection of faults and diagnosis of their root cause enables the correction of the fault before additional damage to the system [5]. Thus, fault detection and diagnostics (FDD) techniques are often used to monitor building systems and have gained interest among researchers. There are three methods of FDD; modelbased methods, rule-based methods and data-driven methods. Model-based methods, as proposed in Li et al. [6], Trothe et al. [7] and Alexandersen et al. [8], uses physical knowledge to describe the system to achieve analytical redundancy in order to detect and diagnose the cause of faults. Likewise, Beghi et al. [9] proposed the model-based approach to detect and diagnose common faults in chiller systems. However, the drawbacks of the model-based method are that it can be very complex and faults modelling availability is limited [10].
In contrast, rule-based methods use expert knowledge to describe the behaviour of the system. For instance, Lauro et al. [11] proposed a fuzzy approach for FDD in the AHU system. However, this technique may have conflicting rules issues, especially for a complex system that requires more rules [5]. Therefore, some researchers such as Eboule and Hasan [12], Sulaiman et al. [13], Mattera et al. [14], and Deshmukh et al. [15] combined both model-based and rule-based methods to improve the outputs.
Recently more researchers have gone into data-driven methods, where it is a more straightforward approach. It only requires historical data of the system. Li et al. [16], Fan et al. [17], and Luo et al. [18] have successfully implemented data-driven FDD for chiller systems. Meanwhile, Yun et al. [19], Piscitelli et al. [20], Yan et al. [21] and Li et al. [22] proposed this method in the AHU system. As no research combines all faults in the entire system, Sulaiman et al. [23] have proposed data-driven FDD to identify faults in the centralised air conditioning system. The system is inclusive of the chiller, AHU and cooling tower systems. They successfully applied three machine learning classifiers; multilayer perceptron (MLP), support vector machine (SVM), and deep learning. All classifiers can identify all six common faults in the centralised system.
Decision-tree methods are one of the data-driven FDD methods available. It has been used in several FDD areas, such as in photovoltaic systems [24], transmission lines [25] and industrial machinery [25][26]. Furthermore, it is a topdown method where relevant attribute classes are developed before classifying the data [28]. In other words, the decision tree approach is a realistic, reasonable, and effective approach [29]. For instance, Balasubramaniam [30] and Li et al. [31] successfully implemented this method in detecting faults in AHU and variable refrigerant flow (VRF). However, this technique is not widely used in air conditioning systems as other machine learning methods.
Therefore this paper aims to develop a fault detection and diagnosis (FDD) system using the decision tree classifier model. Datasets from lab-scale centralised chilled water system were used to train and test the developed system. The Decision Tree model is then compared with Support Vector Machine (SVM) and K-Nearest-Neighbors (KNN). A user-friendly graphical user interface (GUI) for the system is also developed to ease the users.
This paper is written in four sections. It starts with some basic background in Section 1. Whereas Section 2 explains the details of the project methodology of this paper. It is inclusive of the development of decision tree FDD and GUI of the system using MATLAB. Then, the results are presented and discussed in Section 3. Lastly, a conclusion is drawn in Section 4 to deduce the outcomes of this project.
Methodology
This section explains the overall flow of this project from lab-scaled setup, data classification, data pre-processing, training, and testing the machine learning model and lastly, developing the GUI for the FDD system.
Experiment Setup
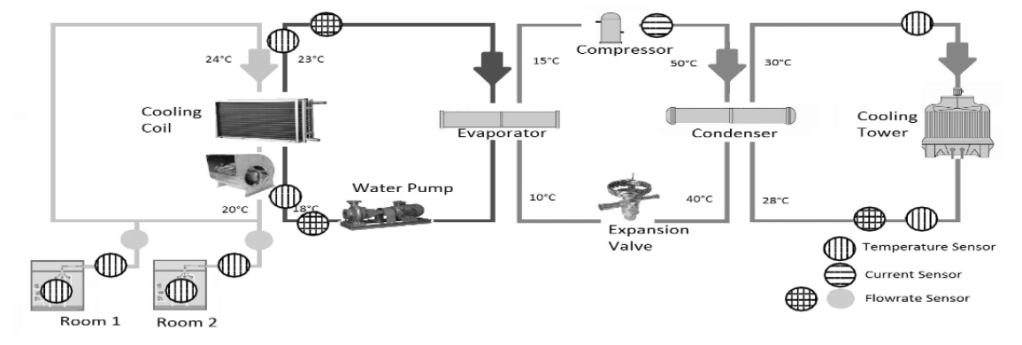
A lab-scaled centralised chilled water system as in [13], [23], [32] was used in this project is shown in Fig.1. It is a centralised chilled water system with 2 test rooms. Fourteen sensors consisting of temperature, air flow rate, water flow rate, and current sensors were installed in the prototype. The locations were depicted as in Fig.1. The sensors generated fourteen parameters data for the FDD and were logged every second using two data acquisition cards. Approximately 21000 total data samples were collected from the lab-scaled system for each condition. The conditions simulated are discussed in the following subsection.
Data Classification
The data was classified into six conditions, as shown in Table 1. Type 1 was the normal condition of the system, which is fault-free data. Types 2 to 6 were faults data which are commonly occurred throughout the entire system. They are a combination of soft and abrupt faults. An abrupt fault is a sudden change in system behaviour pattern due to total component breakdown, such as compressor malfunction. Thus, it is easy to detect due to the impact on the system. However, it is costly to repair. In contrast, soft faults such as damper stuck and air ducting leakage do not change the system behaviour immediately but develop through time. The fault is usually small and almost unnoticeable at the beginning. However, the fault is noticeable in the long run and has a significant impact on the system.
Table 1. List of conditions

Features extraction
The input data from sensors were segmented for mean and standard deviation values for every 5 seconds interval. As a result, the sampling data has been reduced to 4200 for each dataset, whereas the parameters have increased to This process generated a total of 604,800 data for all condition types with 25,200 instances and 28 parameters. The data were split into 70% for training and 30% for testing the model.
Simulation Setup
The models of the decision tree, SVM and KNN, were developed using MATLAB software. As for the decision tree model, the maximum split of the tree was set to 20 splits, and the tree induction was based on classification and regression tree (CART). Meanwhile, the SVM kernel function was the linear kernel. Lastly, the number of neighbours in the KNN model was 10, and the distance metric was Euclidean. The setting is summarised in Table 2.
Table 2. Simulation setting

GUI Setup
Two GUIs for decision tree FDD was developed using the MATLAB App Designer tool. Users can choose either of these two GUIs to detect and diagnose the conditions listed in Table 1. It also allowed users to extract the input features before diagnosing the fault. The first GUI allowed users to import an entire raw dataset to detect and diagnose the fault. The dataset can be in either “.xlsx” or “.cvs” format.

The layout of the GUI is shown in Fig.2. Meanwhile, the second GUI allowed users to insert five randomly sample data from the same condition type. The sequence of parameters format was shown on top of the interface. The layout of the second GUI is shown in Fig.3. Both GUIs were developed for the decision tree model.

Results and Analysis
This section explains the classification results for the decision tree, SVM and KNN model. The results are presented in the confusion matrixes, where the models’ accuracy and precision can be identified. It summarises how successful the classification model predicts all classes, indicating the correlation between actual results and predicted results. It also can identify the mistake patterns. Thus more training data or new parameters can be added to improve the models’ classification.
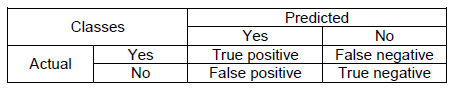
A fundamental concept about the confusion matrix is shown in Table 3. True positive is the number the model correctly predicts the positive class. Similarly, true negative is the number the model correctly predicts the negative class. Meanwhile, false positive is when the model incorrectly predicts the positive class, and false negative is when the model incorrectly predicts the negative class.
Table 3. Confusion matrix
Decision Tree Model
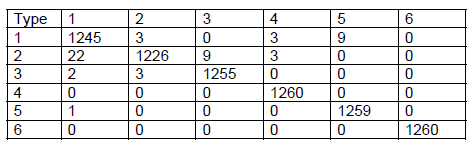
Table 4 and Table 5 show the confusion matrixes for the training and testing dataset of the decision tree model. Both tables show that Type 4, 5, and 6 have achieved 100% accuracy. While Type 1, 2 and 3 have some incorrectly classified data. Likewise, Fig.4 shows the overall performance of the decision tree model. The model can identify all condition types accurately and precisely for more than 99% for both training and testing datasets.
Table 4. The training dataset results

Table 5. The testing dataset results


SVM Model
Fig.5 shows the overall performance of the SVM model. The model recognised all condition types with accuracy and precision of over 99% for both training and testing datasets. The accuracy and precision of the SVM model are slightly lower than the decision tree model.

Table 6 and Table 7 show the confusion matrixes for the training and testing datasets of the model. The results show that almost all types have slightly lower accuracy compared to the decision tree model. However, the misclassification rates were only about 0.06% to 2.5%.
Table 6. The training dataset results

Table 7. The testing dataset results.
KNN Model
Fig.6 shows the KNN classifier model performance. The classifier can distinguish the condition types with accuracy and precision for more than 97%. However, the results were slightly lower than the decision tree and SVM model.

Table 8 and Table 9 show the confusion matrixes of the training and testing datasets of the KNN model. From Table 8, the lowest accuracy achieved was 96.8% for Type 1, similar to Type 1 in Table 9, where it has the lowest accuracy at 95.8%.
Table 8. The training dataset results

Table 9. The testing dataset results

Fault detection and diagnosis system GUI
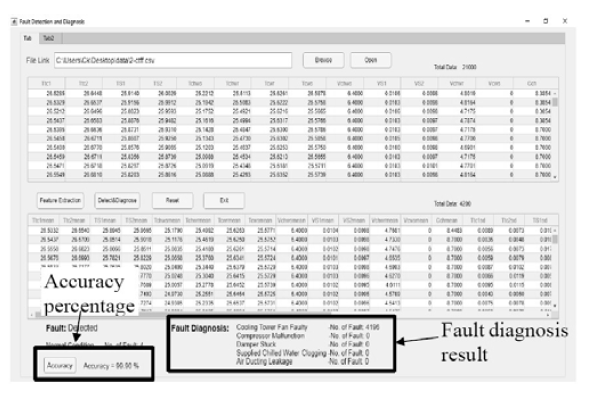
Fig.7 shows the dataset of Type 2 was tested on the first developed GUI. The GUI successfully classified the input data as Type 2 with an accuracy of 99.90%. Only four instances data were misclassified into normal condition.
Meanwhile, Fig.8 shows the GUI result of five sample data from Type 3, compressor malfunction, tested on the second GUI. The system was successfully classified the sample data as Type 3 data. Neither accuracy nor precision percentages were displayed in the second interface.

Discussion
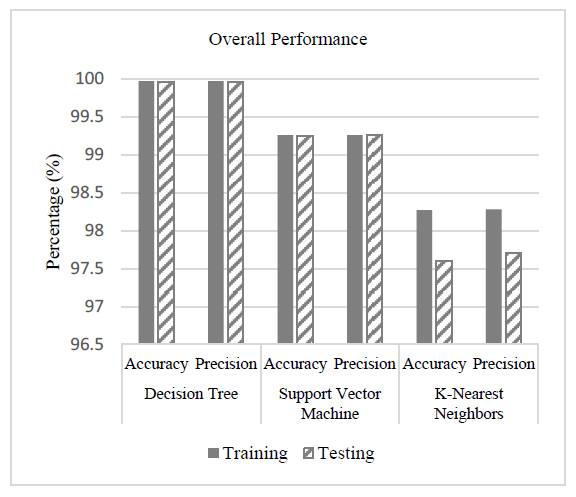
Fig.9 shows the overall performance for the decision tree, SVM and KNN model. The graph clearly shows that all three models successfully classified all types with more than 97% accuracy and precision. The decision tree model has the highest accuracy and precision among all.
Conclusion
The first part of this project discussed the performance of three machine learning models: decision tree, SVM and KNN for data-driven FDD in a centralised chilled water air conditioning system. All classifiers successfully classified six condition types of one normal condition and five faulty conditions. The faulty conditions were among the common faults in the centralised system. Although all classifier models achieved good performance, the decision tree model is the best among all. The accuracy and precision of the decision tree achieved over 99.9% for both training and testing datasets. The second part discussed the developed GUIs for the FDD system using the trained decision tree model. Both GUIs were able to process and classify the data into their types.
Acknowledgement The authors would like to thank Centre for Research and Innovation Management (CRIM), Universiti Teknikal Malaysia Melaka (UTeM) for sponsoring this work.
REFERENCES
[1] C. G. Mattera, J. Quevedo, T. Escobet, H. R. Shaker, and M. Jradi, “A Method for Fault Detection and Diagnostics in Ventilation Units Using Virtual Sensors,” Sensors (Basel)., vol. 18, no. 11, pp. 1–21, 2018.
[2] J. Kim, J. Cai, and J. E. Braun, “Common Faults and Their Prioritization in Small Commercial Buildings Common Faults and Their Prioritization in Small Commercial Buildings,” Golden, CO: National Renewable Energy Laboratory, 2018.
[3] M. F. Othman, H. Abdullah, N. A. Sulaiman, and M. Y. Hassan, “Performance evaluation of an actual building air-conditioning system,” in IOP Conference Series: Materials Science and Engineering, 2013, vol. 50, no. 1.
[4] A. Beghi, R. Brignoli, L. Cecchinato, G. Menegazzo, M. Rampazzo, and F. Simmini, “Data-driven Fault Detection and Diagnosis for HVAC water chillers,” Control Eng. Pract., vol. 53, pp. 79–91, 2016.
[5] W. Kim and S. Katipamula, “A review of fault detection and diagnostics methods for building systems,” Sci. Technol. Built Environ., vol. 24, no. 1, pp. 3–21, 2018.
[6] Z. Li et al., “An Effective Fault Detection and Diagnosis Approach for Chiller System,” IFAC-PapersOnLine, vol. 52, no. 10, pp. 55–60, 2019.
[7] M. E. S. Trothe, H. R. Shaker, M. Jradi, and K. Arendt, “Fault isolability analysis and optimal sensor placement for fault diagnosis in smart buildings,” Energies, vol. 12, no. 9, 2019.
[8] E. K. Alexandersen, M. R. Skydt, S. S. Engelsgaard, M. Bang, M. Jradi, and H. R. Shaker, “A stair-step probabilistic approach for automatic anomaly detection in building ventilation system operation,” Build. Environ., vol. 157, no. February, pp. 165–171, Jun. 2019.
[9] A. Beghi, L. Cecchinato, F. Peterle, M. Rampazzo, and F. Simmini, “Model-based fault detection and diagnosis for centrifugal chillers,” Conf. Control Fault-Tolerant Syst. SysTol, vol. 2016-Novem, pp. 158–163, 2016.
[10] Y. Li and Z. O’Neill, “A critical review of fault modeling of HVAC systems in buildings,” Build. Simul., vol. 11, no. 5, pp. 953–975, 2018.
[11] F. Lauro et al., “Building fan coil electric consumption analysis with fuzzy approaches for fault detection and diagnosis,” Energy Procedia, vol. 62, no. June, pp. 411–420, 2014.
[12] P. S. Pouabe Eboule and A. N. Hasan, “Accurate fault detection and location in power transmission line using concurrent neuro fuzzy technique,” Prz. Elektrotechniczny, vol. 97, no. 1, pp. 37–45, 2021.
[13] N. A. Sulaiman, M. F. Othman, and H. Abdullah, “Fuzzy logic control and fault detection in centralized chilled water system,” Proc. – 2015 IEEE Symp. Ser. Comput. Intell. SSCI 2015, pp. 8–13, 2015.
[14] C. G. Mattera, M. Jradi, M. R. Skydt, S. S. Engelsgaard, and H. R. Shaker, “Fault detection in ventilation units using dynamic energy performance models,” J. Build. Eng., vol. 32, 2020.
[15] S. Deshmukh, S. Samouhos, L. Glicksman, and L. Norford, “Fault detection in commercial building VAV AHU: A case study of an academic building,” Energy Build., vol. 201, pp. 163–173, 2019.
[16] B. Li, F. Cheng, X. Zhang, C. Cui, and W. Cai, “A Novel Semi-supervised Data-driven Method for Chiller Fault Diagnosis with Unlabeled Data,” Appl. Energy, vol. 285, pp. 1–13, 2021.
[17] Y. Fan, X. Cui, H. Han, and H. Lu, “Chiller fault diagnosis with field sensors using the technology of imbalanced data,” Appl. Therm. Eng., vol. 159, no. June, 2019.
[18] X. J. Luo, K. F. Fong, Y. J. Sun, and M. K. H. Leung, “Development of clustering-based sensor fault detection and diagnosis strategy for chilled water system,” Energy Build., vol.186, pp. 17–36, 2019.
[19] W. S. Yun, W. H. Hong, and H. Seo, “A data-driven fault detection and diagnosis scheme for air handling units in building HVAC systems considering undefined states,” J. Build. Eng., vol. 35, 2021.
[20] M. S. Piscitelli, D. M. Mazzarelli, and A. Capozzoli, “Enhancing operational performance of AHUs through an advanced fault detection and diagnosis process based on temporal association and decision rules,” Energy Build., vol. 226, 2020.
[21] K. Yan, J. Huang, W. Shen, and Z. Ji, “Unsupervised learning for fault detection and diagnosis of air handling units,” Energy Build., vol. 210, p. 109689, 2020.
[22] J. Li, Y. Guo, J. Wall, and S. West, “Support vector machine based fault detection and diagnosis for HVAC systems,” Int. J. Intell. Syst. Technol. Appl., vol. 18, no. 1–2, pp. 204–222, 2019.
[23] N. A. Sulaiman, P. Abdullah, H. Abdullah, M. N. S. Zainuddin, and A. Md Yusop, “Fault detection for air conditioning system using machine learning,” IAES Int. J. Artif. Intell., vol. 9, no. 1, pp. 109–116, 2020.
[24] R. Benkercha and S. Moulahoum, “Fault detection and diagnosis based on C4.5 decision tree algorithm for grid connected PV system,” Sol. Energy, vol. 173, no. July, pp. 610–634, 2018.
[25] S. H. . Asman, N. F. . Ab Aziz, U. A. . Ungku Amirulddin, and M. Z. A. Ab Kadir, “Decision Tree Method for Fault Causes Classification Based on RMS-DWT Analysis in 275 kV Transmission Lines Network,” Appl. Sci., vol. 11, no. 4031, 2021.
[26] C. K. Madhusudana, H. Kumar, and S. Narendranath, “Fault Diagnosis of Face Milling Tool using Decision Tree and Sound Signal,” Mater. Today Proc., vol. 5, no. 5, pp. 12035–12044, 2018.
[27] M. Golmoradi, E. Ebrahimi, and M. Javidan, “Fault diagnosis of compressor based on decision tree and fuzzy inference system,” Vibroengineering Procedia, vol. 12, pp. 54–60, 2017.
[28] M. S. Mirnaghi and F. Haghighat, “Fault detection and diagnosis of large-scale HVAC systems in buildings using data driven methods: A comprehensive review,” Energy Build., vol.229, p. 110492, 2020.
[29] A. Contreras-Valdes, J. P. Amezquita-Sanchez, D. Granados-Lieberman, and M. Valtierra-Rodriguez, “Predictive Data Mining Techniques for Fault Diagnosis of Electric Equipment: A Review,” Appl. Sci., vol. 10, no. 950, 2020.
[30] V. Balasubramaniam, “Fault Detection and Diagnosis in Air Handling Units with a Novel Integrated Decision Tree Algorithm,” J. Trends Comput. Sci. Smart Technol., vol. 3, no.1, pp. 49–58, 2021.
[31] G. Li et al., “An improved decision tree-based fault diagnosis method for practical variable refrigerant flow system using virtual sensor-based fault indicators,” Appl. Therm. Eng., vol.129, pp. 1292–1303, 2018.
[32] N. A. Sulaiman, M. F. Othman, and H. Abdullah, “Fuzzy logic control of centralized chilled water system,” J. Teknol., vol. 72, no. 2, pp. 57–62, 2015.
Authors: Noor Asyikin Sulaiman, Ph.D., Universiti Teknikal Malaysia Melaka, Malaysia, E-mail: noor_asyikin@utem.edu.my; Kai Wern Chuink, B. Eng., Universiti Teknikal Malaysia Melaka, Malaysia, E-mail: wernchuink@gmail.com; Muhammad Noorazlan Shah Zainudin, Ph.D., Universiti Teknikal Malaysia Melaka, Malaysia, E-mail: noorazlan@utem.edu.my; Azdiana Md Yusop, Ph.D., Universiti Teknikal Malaysia Melaka, Malaysia, E-mail: azdiana@utem.edu.my; Siti Fatimah Sulaiman, Ph.D., Universiti Teknikal Malaysia Melaka, Malaysia, E-mail: sitifatimahsulaiman@utem.edu.my.
Source & Publisher Item Identifier: PRZEGLĄD ELEKTROTECHNICZNY, ISSN 0033-2097, R. 98 NR 1/2022. doi:10.15199/48.2022.01.47
